
Molecular Specificity, Convergence and Constraint Shape Adaptive Evolution in Nutrient-Poor Environments
One of the central goals of evolutionary biology is to explain and predict the molecular basis of adaptive evolution. We studied the evolution of genetic networks in Saccharomyces cerevisiae (budding yeast) populations propagated for more than 200 generations in different nitrogen-limiting conditions. We find that rapid adaptive evolution in nitrogen-poor environments is dominated by the de novo generation and selection of copy number variants (CNVs), a large fraction of which contain genes encoding specific nitrogen transporters including PUT4, DUR3 and DAL4. The large fitness increases associated with these alleles limits the genetic heterogeneity of adapting populations even in environments with multiple nitrogen sources. Complete identification of acquired point mutations, in individual lineages and entire populations, identified heterogeneity at the level of genetic loci but common themes at the level of functional modules, including genes controlling phosphatidylinositol-3-phosphate metabolism and vacuole biogenesis. Adaptive strategies shared with other nutrient-limited environments point to selection of genetic variation in the TORC1 and Ras/PKA signaling pathways as a general mechanism underlying improved growth in nutrient-limited environments. Within a single population we observed the repeated independent selection of a multi-locus genotype, comprised of the functionally related genes GAT1, MEP2 and LST4. By studying the fitness of individual alleles, and their combination, as well as the evolutionary history of the evolving population, we find that the order in which these mutations are acquired is constrained by epistasis. The identification of repeatedly selected variation at functionally related loci that interact epistatically suggests that gene network polymorphisms (GNPs) may be a frequent outcome of adaptive evolution. Our results provide insight into the mechanistic basis by which cells adapt to nutrient-limited environments and suggest that knowledge of the selective environment and the regulatory mechanisms important for growth and survival in that environment greatly increase the predictability of adaptive evolution.
Published in the journal:
. PLoS Genet 10(1): e32767. doi:10.1371/journal.pgen.1004041
Category:
Research Article
doi:
https://doi.org/10.1371/journal.pgen.1004041
Summary
One of the central goals of evolutionary biology is to explain and predict the molecular basis of adaptive evolution. We studied the evolution of genetic networks in Saccharomyces cerevisiae (budding yeast) populations propagated for more than 200 generations in different nitrogen-limiting conditions. We find that rapid adaptive evolution in nitrogen-poor environments is dominated by the de novo generation and selection of copy number variants (CNVs), a large fraction of which contain genes encoding specific nitrogen transporters including PUT4, DUR3 and DAL4. The large fitness increases associated with these alleles limits the genetic heterogeneity of adapting populations even in environments with multiple nitrogen sources. Complete identification of acquired point mutations, in individual lineages and entire populations, identified heterogeneity at the level of genetic loci but common themes at the level of functional modules, including genes controlling phosphatidylinositol-3-phosphate metabolism and vacuole biogenesis. Adaptive strategies shared with other nutrient-limited environments point to selection of genetic variation in the TORC1 and Ras/PKA signaling pathways as a general mechanism underlying improved growth in nutrient-limited environments. Within a single population we observed the repeated independent selection of a multi-locus genotype, comprised of the functionally related genes GAT1, MEP2 and LST4. By studying the fitness of individual alleles, and their combination, as well as the evolutionary history of the evolving population, we find that the order in which these mutations are acquired is constrained by epistasis. The identification of repeatedly selected variation at functionally related loci that interact epistatically suggests that gene network polymorphisms (GNPs) may be a frequent outcome of adaptive evolution. Our results provide insight into the mechanistic basis by which cells adapt to nutrient-limited environments and suggest that knowledge of the selective environment and the regulatory mechanisms important for growth and survival in that environment greatly increase the predictability of adaptive evolution.
Introduction
Increasingly, the fields of evolutionary and molecular biology are fusing in a research program that has been termed the “functional synthesis” [1]. The power of this approach is exemplified by the molecular reconstruction of ancestral proteins enabling the study of the functional properties [2] and evolutionary histories [3] of individual genes. By contrast, the evolution of pathways and networks comprising multiple genes has thus far been less amenable to functional studies. This is due in part to the difficulty of inferring and engineering ancestral states of genetic networks. An alternative approach to the study of genetic network evolution is the study of long-term natural selection in laboratories. Experimental evolution using microbes has a number of useful features including the ability to monitor evolution in real time and to measure fitness in the relevant environmental condition [4] that makes it ideally suited to the study of gene network evolution.
Uniquely among experimental methods of long-term selection, continuous culturing using chemostats [5], [6] enables establishment of a precise and invariant selective pressure in which cell growth is continuously constrained by the rate of provision of a growth limiting nutrient. In contrast to evolution experiments using serial dilution [4], [7], [8], in which cells undergo repeated cycles of feast and famine, the unchanging nutrient-poor environment of a chemostat reduces fitness to a single component –continuous growth in a nutrient-poor environment – facilitating testing and interpretation of the functional basis of beneficial mutations. Moreover, in chemostats, large population sizes can be maintained (in excess of a billion cells) during the long-term selection thereby minimizing the effects of genetic drift and population bottlenecks.
Despite recent progress in our understanding of the molecular basis of adaptive evolution in chemostats [9]–[14] many questions remain. Does selection target particular loci and preferentially utilize distinct types of alleles? What is the functional basis of adaptation and are there mechanistic relationships between beneficial mutations? Does increased environmental complexity result in increased heterogeneity within a population? To what extent does epistasis constrain adaptive landscapes? Here, we describe the results of experimental evolution of the budding yeast, Saccharomyces cerevisiae, in different nitrogen-limited chemostat environments. Variation in nitrogen availability is frequently encountered in natural ecologies and use of this selection enables comparison with previous adaptive evolution studies in other nutrient-limited environments using chemostats [9], [12], [14].
Importantly, for the goal of understanding genetic network evolution the molecular mechanisms underlying nitrogen utilization in budding yeast have been extensively studied [15], which facilitates interpretation of the functional effects of adaptive mutations. In nitrogen-limited chemostats, the steady-state nitrogen concentration in the culture is extremely low and cells grow continuously in a nitrogen-poor environment. Under these conditions, expression of a set of coordinately regulated genes, the nitrogen catabolite repression (NCR) regulon, is activated by the GATA transcription factors, GLN3 and GAT1 [16]. NCR genes encode a number of transporter and catabolic enzymes for import and assimilation of diverse nitrogen sources, the expression of which is repressed during growth in a nitrogen-rich environment by the negative regulators GZF3 and DAL80 [16].
Despite the greatly simplified and invariant selective conditions of a chemostat we find evidence for at least three distinct adaptive strategies in nitrogen-limited chemostats that operate with different levels of environmental specificity. Consistent with earlier studies in other nutrient limitations [9], [12], [17], comparative analysis among the different nitrogen-limited conditions revealed selection for copy number variant (CNV) alleles that result in increased abundance of transporters specific for the molecular form of nitrogen provided in each environment. We show that these alleles are also selected when multiple nitrogen sources are simultaneously present in the environment and that their inordinate fitness effects likely limit the accumulation of genetic diversity, even in environments with increased environmental complexity. Novel alleles at some loci are recurrently selected in different nitrogen-limited environments, including VAC14 and genes with related functions, pointing to a role for remodeling of phosphatidylinositol-3-phosphate production and vacuole biogenesis in adaptation to nitrogen-limitation. By integrating our results with previous studies we find that variation in a subset of loci is selected in both nitrogen-limited chemostats and glucose-limited chemostats providing evidence for a general adaptive strategy in nutrient poor environments through remodeling of the TORC1 and Ras/PKA pathways.
We also report a striking example of clonal interference in which independent lineages, defined by mutations in three functionally related loci, GAT1, MEP2 and LST4 co-evolve in a single population undergoing adaptive evolution in an ammonium-limited chemostat. By studying the individual and interactive effects of these alleles as well as reconstruction of lineage dynamics, we demonstrate that the order of mutations is constrained by epistatic interactions. We propose that this three-locus genotype comprising functionally related gene products represents a gene network polymorphism (GNP), which may be a more frequent outcome of adaptive evolution than previously appreciated.
Results
To study adaptation in nitrogen-limited environments we founded populations with a haploid Saccharomyces cerevisiae strain isogenic to the reference genome (S288c) in different nitrogen-limited chemostats. A normalized concentration of 800 µM nitrogen was used in all feed media making the molecular form of nitrogen the only variable in each environment (Table 1). A single population in each different nitrogen-limited environment was maintained in continuous exponential growth (D = 0.12 culture volumes/hr; tdoubling = 5.8 hours) for 250 generations (∼2 months).

Adapted clones have dramatically increased fitness
Initially, we studied populations evolving in seven different nitrogen-limited environments. To identify phenotypically distinct clones within each adapted population of ∼1010 cells following 250 generations of selection we performed batch culture growth rate assays on an unbiased sample of 94 clones from each population and selected three individuals that exhibited growth characteristics distinct from each other and the ancestral strain for further characterization (Figure S1 and methods). We determined the relative fitness of each clone in the appropriate nitrogen-limited chemostat environment and typically observed large increases in fitness (>10%) (Figure 1A). This is consistent with mutation and selection rapidly moving strains towards a fitness optimum. It is clear that the ancestral genotype differs in its distance to the fitness optimum with respect to different nitrogen limited environments: fitness increases in clones selected from ammonium-, arginine - and glutamine-limited chemostats are around 25% whereas fitness increases in clones evolved in urea - and allantoin-limited chemostats exceed 80%. In general, individuals from the same population had similar fitness. A minority of clones did not show increased fitness using this assay for reasons that are not clear, but may be indicative of frequency-dependent selection. The majority of evolved clones were unaltered in their ability to grow in nitrogen-rich conditions or showed decreased fitness (typically less than 4%) (Figure S2). Thus, mutations selected in the nitrogen-poor environments are uniquely beneficial in nitrogen-poor environments and exhibit antagonistic pleiotropy in nitrogen-rich environments.

Selection for amplification of specific transporter genes
To identify mutations associated with increased fitness we first analyzed the genomes of selected clones, and entire populations, using array comparative genomic hybridization (aCGH). We observed multiple copy number variants (CNVs), including duplicated and deleted genomic regions, typically greater than ∼10 kb, in individual clones and entire populations (Figure S3). Previously, we reported identification of amplification alleles that include the GAP1 locus in clones adapted to glutamine - or glutamate-limitation [10]. A subset of CNVs present in other nitrogen-limited environments include compelling candidates that are likely to underlie selection of the amplified allele. These include a CNV containing the allantoin permease (DAL4) in allantoin-limited conditions, a CNV including the urea permease (DUR3) in urea-limited conditions and a CNV including the proline permease (PUT4) in proline-limited conditions (Figure 1B). Our ability to detect these CNV alleles in population samples using aCGH (Figure 1B) indicates that they are at high frequency following 250 generations of selection. Consistent with previous studies [9], [18], CNVs are frequently proximal to retrotransposon sequences (Figure 1B), which may increase their spontaneous rate of generation. Previously, we, and others, have identified the repeated selection of copy number variants (CNVs) at the HXT6/7 [9], [17] and SUL1 [9] locus in yeast strains selected from glucose - and sulfur-limited chemostats respectively. In E. coli evolved in lactulose-limiting conditions the lac operon, which includes the lactose permease (lacY), is frequently amplified [19]. Collectively, these findings make clear that in diverse nutrient-limiting conditions, increased production of specific nutrient transporters is a rapid route to increased fitness. The spontaneous rate at which amplification CNVs are generated appears to depend on context [20]; however, estimates of gene amplification rates suggest that they are on the order of nucleotide substitution rates [21]. Selection for spontaneously generated amplification alleles appears to be an expedient means of increasing production of specific nutrient transporters and these alleles are strongly selected in nutrient-poor conditions.
It is notable that we did not detect amplification alleles containing the known high affinity ammonium transporter gene, MEP2, in the ammonium-limited population or the arginine transporter, CAN1, in the arginine-limited population (Figure S3). It remains to be determined if amplification of MEP2 or CAN1 is beneficial in ammonium - or arginine-limited conditions or if these amplification alleles are deleterious for functional or genetic reasons. Moreover, we cannot exclude the possibility that amplification alleles were present at an earlier stage in these populations but were subsequently out-competed.
Aneuploidy and whole genome duplication may contribute to adaptive evolution
We observed additional copy number variants and entire chromosomal aneuploidies that include genes without obvious connections to growth in nitrogen-limited conditions (Figure S3). We identified 7 aneuploid clones among the 18 analyzed clones (∼40%). The recurrent observation of aneuploidy in adaptive evolution studies [9], [18] and as a mechanism of genetic suppression [22] suggests that they are likely to be adaptive, although the mechanistic basis for the selective advantage of aneuploidies remains to be determined.
We quantified the DNA content of all clones, using flow cytometry, and found that in populations adapted to allantoin - and urea-limitation a high frequency of cells had a 2N DNA content (Figure S4). These individuals are still of a haploid mating type (MATa) as demonstrated by successful mating with MATα cells. The resulting triploid cells underwent sporulation, but typically yielded poor spore viability (<10%) consistent with massive unbalanced chromosome content in the meiotic products of triploids (Figure S4). The maintenance of a MATa mating type in diploid cells recovered from chemostat selections indicates that they are the result of failed cytokinesis and not due to spontaneous mating type switching and subsequent mating. We did not detect a fitness advantage in the chemostat that is attributable to the diploid state per se (Figure 1A) consistent with previous studies [23]. Although the high frequency of diploid cells is consistent with selection, the lack of a detectable fitness effect in a wild type diploid cell suggests that selection for diploidization may require the prior acquisition of at least one mutation that is advantageous when increased in copy number as a result of a whole genome duplication.
mRNA expression levels are correlated with increased copy number at multiple scales
To study the functional basis of adaptation we performed genome-wide transcriptional profiling of evolved clones in the same chemostat environment as they had been selected. Divergence in the transcriptome between clones adapted to different nitrogen environments was qualitatively similar to that seen between clones adapted to glucose - and phosphorous-limited environments [9] (Figure S5). Some of the transcriptional variation in clones adapted to nitrogen-limited environments is a direct result of altered copy number due to CNVs as we detected a small but significant positive correlation between DNA copy number and mRNA abundance (Figure S6A). In general, mRNAs corresponding to transporter genes found within CNVs were increased in abundance, consistent with increased DNA copy number resulting in increased transporter abundance (Figure S6A), providing further evidence that these genes drive selection of the CNV.
As previously observed [24], DNA copy number in disomic or trisomic chromosomes of aneuploid cells is proportional to mRNA abundance level (Figure S6B). In some cases this may explain the selection for a specific aneuploidy. For example, a clone recovered from the glutamine-limitation adaptation contains an additional entire copy of chromosome XI, which contains GAP1 [10]. However, other chromosomal aneuploidies do not have an obvious connection to nutrient transport making it unclear how, or why, the large-scale increase in expression of genes along duplicated chromosomes of adapted clones contributes to fitness.
Defining the spectrum of point mutations associated with adaptation
To identify all mutations acquired during the selection experiments we performed whole genome sequencing of 18 clones from the seven populations (see methods). We found an average of 4 SNPs per clone that together represent a broad range of classes (Figure 2A and Table S1). The average number of SNPs is higher than expected (∼1.0) based on the measured spontaneous nucleotide substitution rate [25] but is consistent with the average number of acquired SNPs (∼3.3) reported for equivalent selections in glucose - or phosphorous-limited environments [13], [26], [27]. Whether this reflects an increased mutation rate under conditions of stress, as reported for E. coli [28], or heterogeneity in the number of mitotic events a particular lineage undergoes in a chemostat, remains to be determined. We detected a marginal but statistically significant bias towards SNPs in coding regions: 60/72 SNPs (83%) were found in coding regions, while 72% of yeast genome is coding (exact binomial test, p = 0.035). Although the majority of base changes in coding regions were non-synonymous (52/72; 72%) this is not significantly different than the expected frequency (79%) of non-synonymous mutations [14] (exact binomial test, p = 0.1912). We also identified 8 indels (7 deletions and 1 insertion) of one or two base pairs (Table S1). The average number of indels per clone (∼0.44) is higher than that expected on the basis of the known spontaneous rate of indel events (∼0.06) [25]. All CNVs detected using aCGH were also identified on the basis of sequence read depth. Furthermore, we detected additional deleted genomic segments of several hundred base pairs suggesting that whole genome sequencing has superior sensitivity to aCGH for CNV detection [26] (Table S1). In lineages that had undergone diploidization we detected both homozygous and heterozygous point mutations (Table S1), which allowed us to distinguish mutations that occurred prior to, and after, diploidization, respectively. In sum, comprehensive genome characterization indicates that in individual clones evolving in nitrogen-limited environments, multiple mutations are acquired in a short period of time that range from single nucleotide substitutions to complete duplication of the genome (Figure 2B).

Whereas sequencing of clonal isolates provides information on individual lineages, deep sequencing of entire populations provides a means of assessing the genetic diversity in a population at a particular time point in the evolutionary history of the population [29]. We sought to identify all alleles that had risen to appreciable frequencies following 250 generations of selection using whole genome sequencing of entire populations (Table S2). We identified fixed and non-fixed alleles and estimated their frequencies on the basis of sequence read counts (Figure S7). Despite sequence read depths in excess of 300-fold, we detected few additional mutations in populations that were not identified in clones. Populations typically contained less than 10 SNPs at frequencies >5% (Table 1). A single exception was identified; in the population adapted to allantoin-limitation we found 486 mutations, which is likely the result of mutator phenotype due to loss of function in the mismatch repair gene, MSH2, which we estimate to have a frequency of ∼6% in the population (Table S3).
Increased environmental complexity does not result in increased genetic diversity
We were surprised by the low genetic diversity in populations adapted to individual nitrogen sources (see Table 1) especially since previous analyses of E. coli populations evolving in glucose-limited chemostats have suggested the presence of multiple ecotypes [30], [31]. We hypothesized that the low genetic diversity within populations may be a related to the presence of a single nitrogen source in the environment. To study the effect of increasing the complexity of environments on genetic variation in adapting populations, we performed additional long-term selection experiments using mixtures of 2–4 different nitrogen sources. Following the same period of selection we did not detect increased genetic complexity, as assessed by population deep sequencing, in these selections compared with populations adapted to a single nitrogen source (Table 1). We performed aCGH on clones and populations evolved in the presence of mixed nitrogen sources and detected CNVs that include transporter genes specific to individual nitrogen sources present in each environment (Figure S8). However, we did not detect any lineages containing multiple CNVs that would improve transport of more than one of the available nitrogen sources in an environment, suggesting that lineages underwent specialization in the mixed environments. The highest frequency CNVs in populations adapted to mixed nitrogen sources transport non-preferred nitrogen sources (proline, allantoin and urea) (Figure S8), which also tend to be associated with the greatest individual fitness increases (Figure 1A). Collectively, our observations in single and mixed nitrogen-limited environments are consistent with a highly skewed distribution of fitness effects in which CNV alleles that include transporter genes have large fitness effects and therefore a high probability of sweeping to fixation. The large effect sizes of these CNV alleles limits genetic diversity even in environments of increased complexity.
Identification of specific and convergent targets of selection
High throughput sequencing of clones and populations revealed that genetic variation at a number of loci was repeatedly selected in different nitrogen-limited selections (Figure 3A). In addition to amplification of permease genes in conditions in which they increase import rates of nitrogen-containing compounds, we find that inactivating alleles are selected in conditions in which their function provides no benefit or may be deleterious. As we previously reported, this is the case for GAP1, which is amplified in glutamine - and glutamate-limited conditions and deleted when the nitrogen source is not an amino acid such as allantoin and urea [10] (Figure 3A). Similarly, amplification alleles containing PUT4, which encodes a proline permease, are selected in environments in which proline is a nitrogen source, but an inactivating mutation in PUT4 was found in the arginine-limited environment. We hypothesize that loss of function mutations in these genes are selected as the NCR-derepressing conditions of a nitrogen-limited chemostat result in their high expression, which is futile in the absence of the substrate(s) they transport.

We identified six loci that acquired point mutations in multiple nitrogen-limitation selections. The most striking of these was VAC14, which is mutant in 8 of the 11 different selective environments. Sequence variants in VAC14 are predominantly loss of function mutations and in two populations we found multiple independent VAC14 alleles (Figure 3A). VAC14 encodes a scaffold component of the protein complex regulating inter-conversion of phosphatidylinositide-3-phosphate (PI3P) to phosphatidylinositide-3,5-bisphosphate (PI(3,5)P2) [32]. Interestingly, an additional repeatedly mutated locus, FAB1, encodes the 1-phosphatidylinositol-3-phosphate 5-kinase that functionally interacts with VAC14. When all mutations identified in clones and populations are considered (Table S1 and Table S2), there is a clear enrichment for molecular functions related to phosphatidylinositol biosynthetic processes and the related processes of autophagosome and vacuole biogenesis (Figure 3B) indicating that they are a convergent target of selection across nitrogen-poor environments. Functional enrichment analysis of mutations in populations and among clones also identified several additional molecular processes related to nitrogen metabolism (Figure 3B). Thus, the molecular basis of adaptive evolution in nitrogen-limited environments exhibits convergence at both the level of individual genes, and at the level of modules, defined by functionally related genes.
It is possible that some adaptive alleles recovered in our experiments are not specifically related to nitrogen utilization, but underlie adaptation to the requirement of continuous growth in nutrient-limited conditions. To identify such loci we compared the loci associated with adaptive evolution in nitrogen-limited environments with those identified in previous studies of adaptation to glucose-, phosphate - and sulfur-limited environments [9], [12]–[14] (Figure 3A). Several loci mutated in both glucose - and nitrogen-limited chemostats encode components of signaling pathways that regulate cell growth in response to the nutritional state of the environment. At least two of these genes (RIM15 and WHI2) regulate entry into a quiescent (G0) state. Loss of the ability to enter G0 may be beneficial in the chemostat, as even transient entry into G0 will prolong the cell division cycle leading to cells being outcompeted. Selection for this class of mutations may be analogous to the recurrent loss of function mutations found in the stress response sigma factor, rpoS, in experimental evolution of E. coli in chemostats [33]. No mutated loci were shared with phosphate and sulfur-limited selections.
Identification of a recurrently selected three-locus genotype comprising functionally related genes
The population adapted to ammonium-limitation was the only population in which we did not detect evidence of CNVs in either clones or the entire population (Figure 2B, Table S1 and Table S2). However, clones from this population displayed the greatest divergence in nitrogen catabolite repression (NCR) gene expression among all clones analyzed (Figure 4A and Figure S9) and had large fitness increases (Figure 1A) suggesting that they had undergone significant adaptive evolution.

We found that these two clones, and a third that was not analyzed for gene expression, contain mutations in the DNA binding domain of the zinc finger transcription factor GAT1 (Figure 4B), which encodes a positive regulator of NCR expression [15]. A subset of NCR genes is increased in expression in these clones including those encoding the high affinity (MEP2) and low affinity (MEP1 and MEP3) ammonium permease genes (Figure 4A). Interestingly, several NCR transcripts are also decreased in expression suggesting that the GAT1 mutations may have differential effects on its transcriptional targets.
In addition to mutations in GAT1, we found that the three clones from the ammonium-limitation selection contained one of two different mutations in the identical codon of a predicted transmembrane domain of the high affinity ammonium transporter MEP2, a transcriptional target of GAT1 [34] (Figure 4C). Furthermore, two of these clones contained mutations in LST4, which encodes a protein required for efficient sorting of permeases from the Golgi to plasma membrane [35]. The acquired mutations in LST4 are unlikely to render it non-functional based on drug sensitivity assays (Figure S10). The three genes, GAT1, MEP2 and LST4 that comprise this recurrently selected multilocus genotype encode functionally related gene products (Figure 4D) consistent with adaptive evolution proceeding via the sequential accumulation of variation in genetic networks within lineages.
Population dynamics of the three-locus genotype
We aimed to determine the temporal dynamics with which the mutations in GAT1, MEP2 and LST4 occurred and were selected. Population sequencing of the ammonium-limitation adapted population after 250 generations of selection identified 10 SNPs with detectable allele frequencies (>5%) (Table S1 and Table S2). Allele frequencies in the population are informative about the order in which mutations were acquired in each asexually reproducing lineage; however, the timing of mutational events cannot be deduced on the basis of allele frequencies. To reconstruct the evolutionary history of the lineages we determined allele frequencies throughout the evolution experiments using Sanger sequencing [9] (methods; Figure S11). The resulting trajectories (Figure 5A) show that within a single population the same two locus genotype (gat1, mep2) was independently generated and selected three times (lineages A1, B1, and B3) and the three locus genotype (gat1, mep2, lst4) was generated at least twice (lineages A1 and B3). Interestingly, in both lineages, mutations in GAT1 and LST4 occurred in rapid succession and subsequently increased in frequency (i.e. lineage A0 and lineage B3 in Figure 5A), which is suggestive of a synergistic interaction between LST4 and GAT1. Although we detect dramatic changes in allele frequencies during the selection no individual genotype swept to complete fixation (i.e. a “hard sweep”). Rather, competition (i.e. clonal interference) between lineages bearing different alleles in the identical multi-locus genotype resulted in alternating “soft sweeps”.
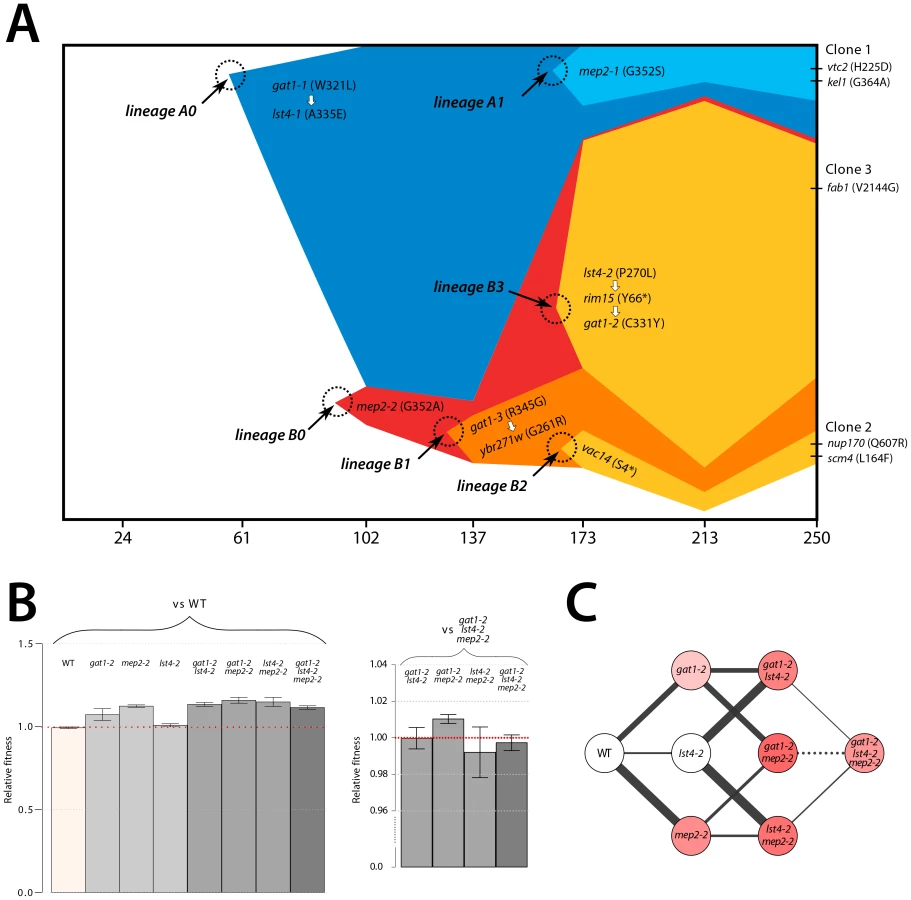
Epistasis constrains the order of mutational events
As functionally related genes are enriched for genetic interactions [36], we hypothesized that epistatic interactions might exist between GAT1, MEP2 and, LST4. To test this hypothesis we constructed strains containing the eight possible combinations of the gat1-2, lst4-2 and mep2-2 alleles identified in clone 3 (methods). The mutations in MEP2 and GAT1 are individually beneficial; however, the mutation in LST4 does not confer a selective advantage on its own (Figure 5B). The double mutation genotypes comprised of either mep2-2 and lst4-4 or gat1-2 and lst4-2 are more fit than expected by summation of their individual fitness effect providing evidence for positive epistasis. However, we found that the combined effect of the gat1-2/lst4-2/mep2-2 alleles does not result in significantly increased fitness compared with the gat1-2/lst4-2 or mep2-2/lst4-2 double mutant genotypes consistent with negative epistasis. To more accurately compare fitness effects of different genotypes we directly competed double mutant genotypes directly with the gat1-2/lst4-2/mep2-2 genotype. Consistent with our initial observations we find that the gat1-2/lst4-2/mep2-2 triple mutant genotype is not significantly fitter than the gat1-2/lst4-2 or lst4-2/mep2-2 double mutant genotypes and is in fact significantly less fit than the gat1-2/mep2-2 genotype. Thus, an LST4 mutation is beneficial only in the background of an individual mutation in GAT1 or MEP2 whereas it is detrimental in the background of the GAT1/MEP2 double mutant (Figure 5C). This sign epistatic interaction is consistent with the order of mutation acquisition in the three lineages in the population: an LST4 mutation is observed after the occurrence of a GAT1 mutation (lineage A0) or a MEP2 mutation (lineage B3), but not in the lineage that contains a mutation in both GAT1 and MEP2 (lineage B1).
Discussion
A major motivation for Novick and Szilard's introduction of the chemostat was the study of spontaneous mutations and evolution [5]. Seminal studies by Paquin and Adams in the 1980s established the use of budding yeast in experimental evolution studies in chemostats [37], [38]. The advent of genome-scale methods for comprehensive identification of changes in gene expression [39], structural genomic variation [18] and DNA sequence [40] provided insight into the molecular basis of adaptive evolution in chemostats. For many years, experimental evolution using chemostats and budding yeast have primarily been performed using glucose as the growth limiting substrate. More recently, we reported a survey of adaptive evolution of budding yeast in glucose-, phosphate - and sulfur-limited environments [9]. Comparison among these selections revealed that the number of adaptive strategies differs as a function of the selective pressure and thus the details of the selective regime dictate the “repeatability” of evolution. Here, we have built on our recent report of adaptation in nitrogen-limited chemostats [10] to yield a comprehensive survey of adaptive strategies in environments that are limited for different sources of nitrogen. Our new study allows us to draw several general conclusions about the mechanistic bases of adaptive evolution in nutrient-poor environments and provide new insight in the complexity and dynamics of adaptive evolution.
Alleles that specifically increase the transport kinetics of the compound containing the growth-limiting nutrient are recurrently selected
In a chemostat, the rate of cell growth is constrained by the concentration of a single nutrient that is essential for growth [41]. Thus, there is intense selective pressure for adaptive strategies that improve the import or metabolism of the growth-limiting nutrient. In our study, we initially provided a single source of nitrogen at a growth-limiting concentration. We observed massively increased fitness of in selected lineages following 250 generations of selection when fitness was assessed in the same environment as that in which the selection was performed. In the majority of cases, analysis of individual lineages identified CNVs that include a transporter gene that specifically transports the molecular form of nitrogen provided in the environment. Thus, in addition to the amplification of the GAP1 locus in glutamine - and glutamate-limited conditions [10], we find DUR3 amplification alleles in urea-limited environments, DAL4 amplification alleles in allantoin-limited environments and PUT4 amplification alleles in proline-limited environments. The fact that these CNVs are detected in DNA samples of entire populations indicates that they are at high frequency in these populations, most likely as a result of selection. Transcriptome analysis indicates that these alleles result in increased gene expression, which likely results in increased protein production. Our new results are consistent with previous studies in budding yeast that have identified amplification of the HXT6/7 locus in populations adapted to glucose-limitation [9], [12], [17] and amplification of the SUL1 locus, encoding the high affinity sulfur-permease, in populations adapted to sulfur limitation [9]. The large fitness increases attributable to these specific CNV alleles means that they dominate the evolutionary dynamics of adapting populations thereby limiting the genetic diversity in nutrient-limited environments. CNV alleles have been reported to underlie increased fitness in a diversity of selective environments and organisms, including humans, suggesting that they are a class of genetic variation that are of general importance for adaptive evolution.
Increased fitness associated with nutrient transporter amplification is specific to nutrient-poor environments. Using competitive growth rate assays in nitrogen-rich environment we find that evolved clones tend to have decreased fitness. Similar fitness trade-offs in carbon-rich environments have been reported for lineages adapted to glucose-limited chemostats [14]. Amplified transporter alleles may be an underlying source of this antagonistic pleiotropy. Previously, we have shown that inactivating mutations in GAP1 are selected in chemostats containing limiting concentrations of non-amino acid nitrogen sources [10]. In the current study we identified a PUT4 inactivating mutation in a lineage evolved under arginine limitation (Figure 3A). In environments in which the limiting nutrient is present in a predominant molecular form, loss of some transporter genes may be beneficial either through reduction in the energetic cost of their unnecessary production or as a result of a function that is deleterious in the particular environment. Future work will be required to rigorously test the hypothesis that CNV alleles are a molecular basis of antagonistic pleiotropy.
A hierarchy of generalist strategies underlies adaptive evolution in nutrient-poor environments
In addition to selection of specific transporter amplification alleles in different nitrogen-limited environments, we find evidence for convergent routes to increased fitness across different nitrogen-limited environments. The most striking evidence comes from the multiple inactivating and nonsynonymous mutations that we identified in VAC14. We found at least one, and as many as three, independent alleles within the 2.6 kb coding region of VAC14 in eight of the eleven populations that we studied (Figure 3A). VAC14 encodes a scaffold component of the protein complex regulating inter-conversion of phosphatidylinositide-3-phosphate (PI3P) to phosphatidylinositide-3,5-bisphosphate (PI(3,5)P2) [32]. In addition, we found mutations in FAB1, which encodes a PI3P 5-kinase and VAC7, a regulator of FAB1, in different nitrogen-limited populations, albeit, much less frequently than VAC14 mutations (Table S1). Control of PI(3,5)P2 levels by VAC14, VAC7 and FAB1 is important for several cellular processes including protein trafficking and maintenance of vacuole size and acidity [42], [43]. Loss of function of VAC14 results in decreased PI(3,5)P2 levels leading to enlarged vacuoles due to defective vacuolar fission [44]. Enlarged vacuoles may be beneficial in nitrogen-limited conditions as vacuoles function as a reserve for nitrogen stores as well as being the compartment for recycling of cytosolic proteins through autophagy [45]. Non-synonymous mutations in the VAC7 and FAB1 may have similar consequences on PI(3,5)P2 levels and vacuole biogenesis as VAC14 loss of function mutations. Although identifying the precise mechanistic basis by which mutations in these functionally related genes contribute to increased fitness in nitrogen-limited environments requires additional study, their selection in different nitrogen-limited environments, and their absence in the mutational spectra identified in other nutrient-limited conditions reported to date, suggests that novel alleles at these loci underlie a generalist strategy specific to nitrogen-limited conditions.
By integration of our results with previous studies in other nutrient-limited environments, we find evidence for adaptive strategies involving remodeling of the TORC1 and Ras/PKA signaling pathways that may be general to nutrient limitation. These signaling pathways control cellular growth rate in response to nutrient availability by regulating diverse cellular processes [46], [47]. In particular, mutations in the regulator of cell cycle exit and entry into G0, RIM15 are found in different glucose - and nitrogen-limitation selections (Figure 3A). RIM15 is known to have an important role in integrating signals from multiple nutrient responsive signaling pathways including TORC1 and Ras/PKA [48], [49]. A reduced capacity to enter a G0 state could be beneficial in a variety of nutrient-limitations in chemostats. Consistent with this hypothesis, additional genes that are mutant in both nitrogen - and glucose-limited chemostats include WHI2, a negative regulator of G1 cyclin expression, IRA1 and GPB2, both of which are negative regulators of the Ras/PKA pathway, and NGR1, an RNA-binding protein involved in regulation of cell growth control. Selection for this class of mutations in different nutrient limitations is consistent with the argument that recurrent selection for loss of rpoS in E. coli populations evolved in glucose-, nitrogen - [50] and phosphorous-limited [51] chemostats underlies a tradeoff between the cellular response to nutrient starvation and maintenance of stress resistance.
Selected variation accumulates in genetic networks under epistatic constraints
Although transporter amplifications dominate the majority of our adaptive evolution experiments, we did not identify transporter amplification alleles in two of our populations (ammonium and arginine limitation); the population that underwent adaptive evolution in an ammonium-limited environment was the only population in which we did not identify any CNVs or large-scale chromosomal events. Nutrient transport is still a primary target of selection in this population as we found two independently acquired non-synonymous SNPs that result in amino acid substitutions at the same amino acid residue in MEP2 (G352A and G352S). The mutated site is in a predicted trans-membrane domain (Figure 4C) making it likely that these mutations alter the affinity of MEP2 for ammonium either directly or indirectly. Fitness tests of one of a strain containing one of these mutations (G352A) show that this variant confers a fitness increase exceeding 10% (Figure 5B). Interestingly, we find evidence that independently generated alleles containing this precise variant may have been selected in natural yeast populations. Although our ancestral strain, which is isogenic to S288c, encodes a glycine at residue 352 in MEP2, this site is polymorphic among S. cerevisiae strains with 19/26 strains in the SGD database (http://www.yeastgenome.org) encoding an alanine at residue 352. Moreover, the reference genomes of Saccharomyces sensu stricto species, including S. uvarum, S. mikatae, and S. paradoxus, all contain an alanine at residue 352 in MEP2 homologues. It is interesting to note that a recent study reported recurrent selection of MEP2 fusion alleles when a hybrid S. cerevisiae/S. uvarum strain was evolved in ammonium-limited chemostats [52]. S. cerevisiae and S. uvarum differ at 17 residues in the MEP2 protein, one of which is the 352nd amino acid. Consistent with the importance of the 352A allele under conditions of ammonium-limitation, all independently selected S. cerevisiae/S. uvarum MEP2 fusion alleles retained the carboxy terminus-encoding portion of the S. uvarum MEP2 allele, which codes for an alanine at codon 352. Collectively, these observations suggest that the selection that we imposed in the laboratory bears some resemblance to selection experienced by yeast cells in the natural world with a strikingly convergent response to selection at the molecular level.
The population adapted to ammonium-limitation provides evidence that accumulation of variation in functionally related genes underlies adaptive evolution in nutrient-limited environments. Two lineages within the population that contain mutations in MEP2 also contained mutations in GAT1, which encodes a transcriptional activator of MEP2 (in addition to other NCR genes) as well as mutations in LST4, which encodes a protein that functions in protein sorting to plasma membranes [53]. Analysis of the dynamics with which these mutations were selected demonstrates that their sequential acquisition underlies clonal interference dynamics in this population. Clonal interference due to multiple independent mutations at the same locus has been documented in a variety of experimental evolution studies (e.g. [54]). Our current results show that competing lineages in the same population can accumulate mutations at multiple, common loci as has been observed in E. coli [29]. Interestingly, unlike the recurrently selected three locus genotype identified in [29] comprising variants in spoT, rbs and nadR, which encode functionally unrelated gene products the three loci that define the recurrently selected genotype identified in our study, GAT1, MEP2 and LST4, comprise a functionally related gene network (Figure 4D).
The order in which mutations at these three loci are acquired appears to be constrained by epistatic interactions. By studying all possible allelic combinations at these three loci we determined that the lst4-2 allele exhibits positive epistasis with the mep2-2 and gat1-2 alleles individually. However, the two locus gat1-2/mep2-2 genotype is more fit than the three locus gat1-2/mep2-2/lst4-2 genotype (Figure 5C). This negative epistatic interaction is consistent with the observation that an LST4 mutation occurs in the background of a GAT1 mutation (lineage A0) or a MEP2 mutation (lineage B3), but does not occur in the lineage in which both a GAT1 and MEP2 mutation has already occurred (lineages B1 and B2) (Figure 5A). It is also interesting to note that the double mutant genotypes (gat1-2/lst4-2 and lst4-2/mep2-2) and the triple mutant genotype (gat1-2/lst4-2/mep2-2) do not differ significantly in their fitness (Figure 5C), suggesting that they will coexist in an evolving population. Consistent with this expectation, the lineages A0 and A1, which differ only at LST4 and the lineages B1 and B3, which differ at LST4 and two additional loci, co-exist that for around 100 generations (Figure 5A).
Increasingly, resolution of the multigenic basis of quantitative trait variation to nucleotide variants demonstrates that allelic variants in functionally related genes underlies adaptive evolution [55], [56]. As the multi locus genotype that we have identified is 1) comprised of functionally related gene products that 2) interact epistatically with one another, we propose that it comprises a gene network polymorphism (GNP) similar to that reported for the galactose-utilization regulon segregating in diverged Saccharomyces kudriavzevii populations [57]. Given a sufficiently large population size, we show that nearly identical GNPs can be recurrently generated and selected within a population resulting in “soft sweeps” in which the GNPs are maintained at intermediate frequencies. The rapid generation of a GNP in a particular niche may lead to balanced unlinked GNPs (buGNPs) segregating in the larger population as observed in the Saccharomyces kudriavzevii population [57].
Conclusion
Our study provides new insight into the functional basis of adaptive evolution in nutrient-limited environments. Consistent with the low concentration of a single growth-limiting substrate representing the dominant selective pressure in a chemostat we find evidence for strong selection of alleles that enhance transport of the specific molecular form of the limiting nutrient. In addition, we have identified a mechanism underlying adaptive evolution that appears to be shared among different nitrogen-limited environments, involving phospholipid metabolism and vacuole biogenesis, and a mechanism shared between nitrogen - and carbon-limited environments, entailing nutrient-responsive growth regulating pathways. The identification of a finite number of adaptive strategies in nutrient-limited environments suggests that adaptive evolution of large populations in nutrient-limited environments proceeds along a limited number of paths. Thus, the combination of precise knowledge of the selective environment experienced by a population of organisms and the molecular mechanisms that underlie growth and survival in that environment is likely to greatly enhance the predictability of adaptive evolution.
Materials and Methods
Strains and media
For all adaptive evolution experiments we founded populations with a haploid derivative (FY4) of the S288c reference strain. For competition assays, we integrated constitutively expressed mCherry or mCitrine-labeled constructs, marked with the kanMX4 cassette, at the HO locus using the high efficiency yeast transformation protocol [58]. All nitrogen-limiting media contained 800 µM nitrogen regardless of the molecular form of the nitrogen and 1 g/L CaCl2-2H2O, 1 g/L of NaCl, 5 g/L of MgSO4-7H2O, 10 g/L KH2PO4, 2% glucose and trace metals and vitamins as previously described [59].
Long-term selection
We founded populations with FY4 in 200 mL of nitrogen-limited media. Chemostat cultures were maintained using Sixfors fermentors (Infors) at 30°C, constantly stirred at 400 rpm in aerobic conditions and diluted at a rate of 0.12 hr−1 (population doubling time 5.8 hr). Each steady-state population of ∼1010 cells was maintained in continuous mode for 250 generations (∼2 months). A 2 mL population sample was obtained every 20 generations and archived at −80°C in 15% glycerol.
Isolation of clones
Following 250 generations of selection we randomly plated cells onto rich media (YPD), and selected an unbiased sample of 94 clones. We grew all clones from each population in 96 well plates containing the same nitrogen source as that used in the selection experiment and recorded optical densities at 600 nm every 0.5 hr over 24 hours using a 96-well Tecan plate reader. Each plate included the ancestral strain (FY4) and a blank well. We estimated the growth rate and the saturation density of all strains using the ‘grofit’ package [60] in R and selected three clones from each population for further analysis.
Determination of cell ploidy
We determined the DNA content of evolved clones by staining with Sytox green and analyzing at least 10,000 cells using flow cytometry. FY4 and an isogenic diploid (FY4/FY5) were used for calibration. In addition, each evolved clone was mated with an isogenic strain (FY5) of the opposite mating type (MATα). The resulting strain was sporulated and at least 20 tetrads were dissected using a micromanipulator. Spore viability was determined after three days growth on YPD at 30°C.
Fitness estimates
Each mutant was competed in a chemostat against the ancestral strain (FY4) or a mutant bearing gat1-2, mep2-2, and lst4-2 mutations, engineered to constitutively express either mCherry or mCitrine, in the same nitrogen-limited condition used in the selection experiment. We inoculated the unlabeled evolved clone and labeled reference strain in separate chemostat vessels and obtained steady-state cultures of 200 mL. We then mixed the evolved clone with the labeled reference strain to a final ratio of 1∶5. We obtained 2 mL samples every 2–3 generations over a total of ∼20 generations. Samples were stored at 4°C in phosphate buffered saline (PBS) containing 0.01% Tween 20. The relative ratio of the fluorescently labeled reference strain and the unlabeled evolved clone was measured by counting at least 100,000 cells from each sample using flow cytometry. We used linear regression of the log transformed (ln) ratio of evolved/reference strain abundance against time (in generations) to estimate the selection coefficient (s, the slope of the fit linear line) and associated standard error (s.e) using the ‘lm’ function in R. We calculated the 95% confidence interval of the regression coefficient in R. The relative fitness, normalized to wild type, is 1+s. Competition assays in batch culture were performed using synthetic deficient (SD) media containing 5 g/L ammonium sulfate and were performed using analogous methods by first growing evolved and fluorescently-labeled ancestral strains in isolation to log phase and then mixing them at a 1∶1 ratio. Cultures were maintained in log phase growth for 24 hours (less than 12 generations) and sampled 5–6 times. The relative abundance of the two strains and fitness coefficients were determined using the same flow cytometry and analytical methods used for chemostat competitions.
DNA microarrays
RNA samples were obtained from evolved clones grown in chemostats limited for the same nitrogen source in which they had been selected. In addition, we obtained RNA samples of the ancestral strain (FY4) grown in each of the nitrogen-limited conditions. Gene expression profiling was performed using Agilent 60-mer DNA microarrays as previously described [9], [24]. We used a common reference for all expression analysis, obtained from a sample of the ancestral strain grown in an ammonium sulfate-limited chemostat growing at a dilution rate of 0.12 hr−1. We identified gene expression variation specific to evolved clones by normalizing each mRNA abundance measurement with the expression level of that transcript in the ancestral strain grown in the same environment.
Array Comparative Genomic Hybridization (aCGH) was performed using Agilent 60mer DNA microarrays as previously described [9], [24]. Genomic DNA (gDNA) from evolved clones and entire populations was prepared using the QIAGEN genomic DNA extraction kit, labeled with Cy3 and co-hybridized with Cy5-labeled DNA from the ancestral strain. The resulting log2 transformed ratio was segmented using the ‘DNAcopy’ package [61] in R.
Library preparation for next-generation sequencing
We obtained gDNA from each evolved clone and the ancestral strain (FY4) from 10 mL overnight cultures using the QIAGEN genomic DNA extraction kit. For population samples, gDNA was extracted from 10 mL samples taken directly from the adapting population. 1 µg of gDNA sample was then sonicated in a Covaris AFA to obtain fragments of 300–500 bp. To blunt the ends of fragmented gDNA we incubated with PNK (10 Unit) and T4 DNA polymerase (12 unit) at 20°C for 30 min, and then purified using QIAGEN Min-Elute Columns. Adenosine overhangs were added to the blunted DNA using Exo(-) Klenow (15 Unit) incubated at 37°C for 20 minutes, followed by purification using QIAGEN Min-Elute Column and elution in 19 µL EB buffer. To multiplex genome sequencing we ligated one of six unique 120 bp adapters (BIOO) using Quick ligase at 23°C for 20 minutes. The ligated samples were purified, and adaptor dimers removed, using AMPure XP beads (Agencourt). The purified samples were loaded on a 2% agarose gel with TAE buffer, run at 100 V for 60 min and then stained with SYBR gold. We excised a region of the gel corresponding to 300 to 500 bp and then recovered DNA using a QIAquick Gel Extraction kit. The ligated DNA was PCR amplified using adapter-specific primers and High-Fidelity DNA polymerase in 25 µL reaction volume for 12 cycles to minimize amplification. The concentrations of libraries were determined by qPCR using the Kapa SYBR qPCR Master mix kit and the PhiX library sample as a control. The final samples were diluted in 10 mM Tris-HCl, pH 8.0 and 0.05% Tween 20 and 2 nM of each DNA library was loaded onto a flow cell.
Sequencing data generation and preprocessing
DNA libraries were sequenced using either single end (36 bp and 77 bp) or paired end (2×100 bp or 2×50 bp) protocols on a Illumina HiSeq 2000. Standard metrics were used to assess data quality. We used the Saccharomyces cerevisiae S288C reference genome, obtained from the SGD database on Feb 03, 2011 to align reads using BWA 0.5.9 [62]. We trimmed bases with base quality less than 20 from the 3′ end of each read. We removed reads with mapping quality less than 20. In addition, PCR duplicates were removed using Picard 1.57 (http://picard.sourceforge.net). We generated BAM files from all remaining reads using samtools 0.1.18 [63]. The average read depth of all sequenced strains is ∼160 X as shown in the Table S4.
SNP and indel identification in clonal samples
To identify SNPs we used samtool 0.1.18 and bcftools 0.1.17 with the Bayesian inference option. We determined an empirical quality score cutoff of 160 using bcftools. For paired end sequencing data we excluded all anomalous read pairs. As clonal individuals are haploid we required SNP alleles to have call frequencies close to 1.0. In duplicated genomic regions or diploidized clones, which may contain heterozygous SNPs, we lowered this requirement to a call frequency near 0.5. In addition, we excluded all SNP calls that were also identified in the ancestral strain. To identify small insertions and deletions (indels) we used the DINDEL package [64]. We first generated candidate variants from BAM files using DINDEL, and then realigned each of them to the reference sequence in order to minimize false positive calls that are frequent in repetitive regions. Indels detected by DINDEL package are therefore defined as those that are shorter than the sequence read length (50 bp or 100 bp depending on sequencing mode).
Identifying SNP alleles in heterogeneous population
We developed a heuristic threshold to identify low frequency SNPs in population sequencing data. First, we used two different BQ cutoffs, of 20 and 30, to identify SNPs using SNVer [65]. By comparing different population sequencing data to each other and to the ancestor, we identified SNPs in populations as ones that (1) are not found in the sequencing data from the ancestor and (2) exist uniquely in sequencing data from one population using both the high (30) and low (20) BQ cutoff options. We empirically found that optimal p-value cutoff of SNP calls generated using SNVer was 1×10⁻⁸, and the minimum total number of read counts covering the SNP location should be 50% of the average read counts in each population sequencing data. Using these heuristics we were able to detect SNPs with frequencies of at least 5% in population sequencing data. The allele frequency of each SNP in a population was determined by dividing the number of reads containing the alternative base by the total number of bases mapping to that position.
Functional enrichment analysis
We collected all GO terms from ‘GO.db’ and ‘org.Sc.sgd.db’ packages in R, resulting in 6,366 ORFs assigned to 4,583 GO terms. We excluded any GO terms for which the number of assigned genes is less than 2 or more than 100. For a tested set of mutated genes we excluded ones without any GO annotation, incremented the count for each additional mutation identified in loci with multiple independent alleles and included both genes neighboring an intergenic SNPs. We then counted how many mutated loci are assigned to each term. We computed the p-value for each GO term using a one-tailed Fisher exact test. We used a Bonferroni correction to correct for multiple hypothesis testing.
Drug sensitivity assays
We tested clones for sensitivity to 10 mM D-histidine (D-His) and 500 µM azetidine-2-carboxylate (ADCB), which are imported by nitrogen catabolite repression (NCR) regulated transporters [66]. We aimed to test drug sensitivities in both NCR-repressing and NCR-activating conditions. Therefore we used plates that containued either ammonium, which represses NCR-regulated genes or proline, which results in derepression of NCR-regulated genes [67]. Each mutant was first grown in liquid cultures containing YPD or SD plus ammonium sulfate (SD-AS). We then spotted normalized cell concentrations at ten-fold dilutions on solid agar containing SD-AS or SD plus 5 g/L proline (SD-Pro) with or without the drug. Sensitivity to drugs was determined following 2 days growth at 30°C.
Estimation of allele and genotype dynamics
We prepared gDNA from population samples taken at 7 intermediate time point in addition to the final generation (i.e. 24, 61, 102, 137, 173, 213, and 250 generations) using a rapid gDNA extraction protocol [68]. We amplified 200–500 bp length amplicons that contain the SNP at a central position. All amplicons were sequenced using Sanger sequencing and the resulting electropherogram analyzed using PeakPicker to estimate allele frequencies as described [9], [69]. Vectors of allele frequencies were clustered and averaged if the Pearson correlation coefficient of two mutations was greater than 0.97 and the difference in allele frequencies in the final generation (based on deep sequencing) was less than 4%. As allele frequency estimates from Sanger sequencing are less accurate than those obtained from deep sequencing data we excluded a small number of allele frequency estimates derived from Sanger sequencing that were inconsistent with our deep sequencing results. All steps in this procedure are summarized in Figure S11.
Measurement of genetic interactions among alleles
We backcrossed clone 3, recovered from the ammonium-limited condition to the ancestral strain of opposite mating type (FY5; MATα), sporulated the hybrid diploid and dissected tetrads. All segregants were tested for mating type using halo assays [70]. We obtained more than one hundred backcrossed strains bearing different combinations of the 5 mutations acquired by clone 3. Genomic DNA for each strain was prepared using a rapid DNA extraction protocol [68]. Genotyping was performed using allele specific PCR (the list of allele specific primers is presented in Table S5). Eight strains identified by this process contained all possible combinations of the three mutations of interest – gat1-2, mep2-2 and lst4-2 – and the ancestral alleles of the two additional loci (RIM15 and FAB1) that were not studied. Each strain was individually competed against the mCitrine-labeled reference strains as described.
Accession numbers
All DNA sequencing data are available from the NCBI Sequence Read Archive with accession number SRP032757. DNA microarray data are available through the NCBI Gene expression Omnibus with accession number GSE52787.
Supporting Information
Zdroje
1. DeanAM, ThorntonJW (2007) Mechanistic approaches to the study of evolution: the functional synthesis. Nature Reviews Genetics 8 : 675–688 doi:10.1038/nrg2160
2. ThomsonJM, GaucherEA, BurganMF, De KeeDW, LiT, et al. (2005) Resurrecting ancestral alcohol dehydrogenases from yeast. Nature genetics 37 : 630–635 doi:10.1038/ng1553
3. BridghamJT, OrtlundEA, ThorntonJW (2009) An epistatic ratchet constrains the direction of glucocorticoid receptor evolution. Nature 461 : 515–519 doi:10.1038/nature08249
4. ElenaSF, LenskiRE (2003) Evolution experiments with microorganisms: the dynamics and genetic bases of adaptation. Nature Reviews Genetics 4 : 457–469 doi:10.1038/nrg1088
5. NovickA, SzilardL (1950) Description of the chemostat. Science 112 : 715–716.
6. MonodJ (1950) La technique de culture continue. Théorie et applications. Ann Inst Pasteur 79 : 390–410.
7. LenskiRE, TravisanoM (1994) Dynamics of adaptation and diversification: a 10,000-generation experiment with bacterial populations. Proceedings of the National Academy of Sciences 91 : 6808–6814.
8. LangGI, BotsteinD, DesaiMM (2011) Genetic variation and the fate of beneficial mutations in asexual populations. Genetics 188 : 647–661 doi:10.1534/genetics.111.128942
9. GreshamD, DesaiMM, TuckerCM, JenqHT, PaiDA, et al. (2008) The repertoire and dynamics of evolutionary adaptations to controlled nutrient-limited environments in yeast. PLoS Genet 4: e1000303 doi:10.1371/journal.pgen.1000303.t005
10. GreshamD, UsaiteR, GermannSM, LisbyM, BotsteinD, et al. (2010) Adaptation to diverse nitrogen-limited environments by deletion or extrachromosomal element formation of the GAP1 locus. Proceedings of the National Academy of Sciences 107 : 18551–18556 doi:10.1073/pnas.1014023107
11. FerenciT (2007) Bacterial physiology, regulation and mutational adaptation in a chemostat environment. Advances in microbial physiology 53 : 169–315 doi:10.1016/S0065-2911(07)53003-1
12. KaoKC, SherlockG (2008) Molecular characterization of clonal interference during adaptive evolution in asexual populations of Saccharomyces cerevisiae. Nature genetics 40 : 1499–1504 doi:10.1038/ng.280
13. KvitekDJ, SherlockG (2011) Reciprocal sign epistasis between frequently experimentally evolved adaptive mutations causes a rugged fitness landscape. PLoS Genet 7: e1002056 doi:10.1371/journal.pgen.1002056
14. WengerJW, PiotrowskiJ, NagarajanS, ChiottiK, SherlockG, et al. (2011) Hunger artists: yeast adapted to carbon limitation show trade-offs under carbon sufficiency. PLoS Genet 7: e1002202 doi:10.1371/journal.pgen.1002202
15. MagasanikB, KaiserCA (2002) Nitrogen regulation in Saccharomyces cerevisiae. Gene 290 : 1–18 doi:10.1016/S0378-1119(02)00558-9
16. CooperTG (2002) Transmitting the signal of excess nitrogen in Saccharomyces cerevisiae from the Tor proteins to the GATA factors: connecting the dots. FEMS Microbiology Reviews 26 : 223–238 doi:10.1111/j.1574-6976.2002.tb00612.x
17. BrownCJ, ToddKM, RosenzweigRF (1998) Multiple duplications of yeast hexose transport genes in response to selection in a glucose-limited environment. Mol Biol Evol 15 : 931–942.
18. DunhamMJ, BadraneH, FereaT, AdamsJ, BrownPO, et al. (2002) Characteristic genome rearrangements in experimental evolution of Saccharomyces cerevisiae. Proceedings of the National Academy of Sciences of the United States of America 99 : 16144–16149 doi:10.1073/pnas.242624799
19. ZhongS, KhodurskyA, DykhuizenDE, DeanAM (2004) Evolutionary genomics of ecological specialization. Proceedings of the National Academy of Sciences of the United States of America 101 : 11719 doi:10.1073/pnas.0404397101
20. ZhangH, ZeidlerAFB, SongW, PucciaCM, MalcE, et al. (2013) Gene copy-number variation in haploid and diploid strains of the yeast Saccharomyces cerevisiae. Genetics 193 : 785–801 doi:10.1534/genetics.112.146522
21. DorseyM, PetersonC, BrayK, PaquinCE (1992) Spontaneous amplification of the ADH4 gene in Saccharomyces cerevisiae. Genetics 132 : 943–950.
22. RancatiG, PavelkaN, FlehartyB, NollA, TrimbleR, et al. (2008) Aneuploidy underlies rapid adaptive evolution of yeast cells deprived of a conserved cytokinesis motor. Cell 135 : 879–893 doi:10.1016/j.cell.2008.09.039
23. GersteinAC, OttoSP (2011) Cryptic fitness advantage: diploids invade haploid populations despite lacking any apparent advantage as measured by standard fitness assays. PloS one 6: e26599 doi:10.1371/journal.pone.0026599
24. TorresEM, SokolskyT, TuckerCM, ChanLY, BoselliM, et al. (2007) Effects of aneuploidy on cellular physiology and cell division in haploid yeast. Science 317 : 916–924 doi:10.1126/science.1142210
25. LynchM, SungW, MorrisK, CoffeyN, LandryCR, et al. (2008) A genome-wide view of the spectrum of spontaneous mutations in yeast. Proceedings of the National Academy of Sciences of the United States of America 105 : 9272–9277 doi:10.1073/pnas.0803466105
26. ArayaCL, PayenC, DunhamMJ, FieldsS (2010) Whole-genome sequencing of a laboratory-evolved yeast strain. BMC Genomics 11 : 88 doi:10.1186/1471-2164-11-88
27. DettmanJR, RodrigueN, MelnykAH, WongA, BaileySF, et al. (2012) Evolutionary insight from whole-genome sequencing of experimentally evolved microbes. Mol Ecol 21 : 2058–2077 doi:10.1111/j.1365-294X.2012.05484.x
28. Notley-McRobbL, SeetoS, FerenciT (2003) The influence of cellular physiology on the initiation of mutational pathways in Escherichia coli populations. Proc Biol Sci 270 : 843–848 doi:10.1098/rspb.2002.2295
29. HerronMD, DoebeliM (2013) Parallel Evolutionary Dynamics of Adaptive Diversification in Escherichia coli. PLoS Biol 11: e1001490 doi:10.1371/journal.pbio.1001490
30. MaharjanR, SeetoS, Notley-McRobbL, FerenciT (2006) Clonal adaptive radiation in a constant environment. Science 313 : 514–517 doi:10.1126/science.1129865
31. MaharjanRP, FerenciT, ReevesPR, LiY, LiuB, et al. (2012) The multiplicity of divergence mechanisms in a single evolving population. Genome Biology 13: R41 doi:10.1186/gb-2012-13-6-r41
32. JinN, ChowCY, LiuL, ZolovSN, BronsonR, et al. (2008) VAC14 nucleates a protein complex essential for the acute interconversion of PI3P and PI(3,5)P(2) in yeast and mouse. The EMBO Journal 27 : 3221–3234 doi:10.1038/emboj.2008.248
33. Notley-McRobbL, KingT, FerenciT (2002) rpoS mutations and loss of general stress resistance in Escherichia coli populations as a consequence of conflict between competing stress responses. Journal of bacteriology 184 : 806–811 doi:10.1128/JB.184.3.806-811.2002
34. ScherensB, FellerA, VierendeelsF, MessenguyF, DuboisE (2006) Identification of direct and indirect targets of the Gln3 and Gat1 activators by transcriptional profiling in response to nitrogen availability in the short and long term. FEMS Yeast Research 6 : 777–791 doi:10.1111/j.1567-1364.2006.00060.x
35. RobergKJ, BickelS, RowleyN, KaiserCA (1997) Control of amino acid permease sorting in the late secretory pathway of Saccharomyces cerevisiae by SEC13, LST4, LST7 and LST8. Genetics 147 : 1569–1584.
36. CostanzoM, BaryshnikovaA, BellayJ, KimY, SpearED, et al. (2010) The Genetic Landscape of a Cell. Science 327 : 425–431 doi:10.1126/science.1180823
37. PaquinC, AdamsJ (1983) Frequency of fixation of adaptive mutations is higher in evolving diploid than haploid yeast populations. Nature 302 : 495–500.
38. PaquinCE, AdamsJ (1983) Relative fitness can decrease in evolving asexual populations of S. cerevisiae. Nature 306 : 368–370.
39. FereaTL, BotsteinD, BrownPO, RosenzweigRF (1999) Systematic changes in gene expression patterns following adaptive evolution in yeast. Proceedings of the National Academy of Sciences 96 : 9721–9726 doi:10.1073/pnas.96.17.9721
40. GreshamD, RuderferDM, PrattSC, SchachererJ, DunhamMJ, et al. (2006) Genome-wide detection of polymorphisms at nucleotide resolution with a single DNA microarray. Science 311 : 1932–1936 doi:10.1126/science.1123726
41. KubitschekHE (1970) Introduction to research with continuous cultures. Prentice Hall 195.
42. RudgeSA, AndersonDM, EmrSD (2004) Vacuole size control: regulation of PtdIns(3,5)P2 levels by the vacuole-associated Vac14-Fig4 complex, a PtdIns(3,5)P2-specific phosphatase. Molecular Biology of the Cell 15 : 24–36 doi:10.1091/mbc.E03-05-0297
43. DoveSK, McEwenRK, MayesA, HughesDC, BeggsJD, et al. (2002) Vac14 controls PtdIns (3, 5) P2 synthesis and Fab1-dependent protein trafficking to the multivesicular body. Curr Biol 12 : 885–893 doi:10.1016/S0960-9822(02)00891-6
44. WeismanLS (2003) Yeast vacuole inheritance and dynamics. Annu Rev Genet 37 : 435–460 doi:10.1146/annurev.genet.37.050203.103207
45. LiSC, KanePM (2009) The yeast lysosome-like vacuole: endpoint and crossroads. Biochim Biophys Acta 1793 : 650–663 doi:10.1016/j.bbamcr.2008.08.003
46. CardenasME, CutlerNS, LorenzMC, Di ComoCJ, HeitmanJ (1999) The TOR signaling cascade regulates gene expression in response to nutrients. Genes Dev 13 : 3271–3279 doi:10.1101/gad.13.24.3271
47. TamanoiF (2011) Ras signaling in yeast. Genes Cancer 2 : 210–215 doi:10.1177/1947601911407322
48. CameroniE, HuloN, RoosenJ, WinderickxJ, De VirgilioC (2004) The novel yeast PAS kinase Rim15 orchestrates G0-associated antioxidant defense mechanisms. Cell Cycle 3 : 460–466 doi:10.4161/cc.3.4.791
49. SwinnenE, WankeV, RoosenJ, SmetsB, DuboulozF, et al. (2006) Rim15 and the crossroads of nutrient signalling pathways in Saccharomyces cerevisiae. Cell Div 1 : 3 doi:10.1186/1747-1028-1-3
50. FerenciT (2003) What is driving the acquisition of mutS and rpoS polymorphisms in Escherichia coli? Trends Microbiol 11 : 457–461 doi:10.1016/j.tim.2003.08.003
51. WangL, SpiraB, ZhouZ, FengL, MaharjanRP, et al. (2010) Divergence involving global regulatory gene mutations in an Escherichia coli population evolving under phosphate limitation. Genome Biol Evol 2 : 478–487 doi:10.1093/gbe/evq035
52. DunnB, PaulishT, StanberyA, PiotrowskiJ, KonigesG, et al. (2013) Recurrent Rearrangement during Adaptive Evolution in an Interspecific Yeast Hybrid Suggests a Model for Rapid Introgression. PLoS Genet 9: e1003366 doi:10.1371/journal.pgen.1003366
53. Rubio-TexeiraM, KaiserCA (2006) Amino acids regulate retrieval of the yeast general amino acid permease from the vacuolar targeting pathway. Molecular Biology of the Cell 17 : 3031–3050 doi:10.1091/mbc.E05-07-0669
54. LeeM-C, MarxCJ (2013) Synchronous waves of failed soft sweeps in the laboratory: remarkably rampant clonal interference of alleles at a single locus. Genetics 193 : 943–952 doi:10.1534/genetics.112.148502
55. GerkeJ, LorenzK, CohenB (2009) Genetic interactions between transcription factors cause natural variation in yeast. Science 323 : 498–501 doi:10.1126/science.1166426
56. SteinerCC, WeberJN, HoekstraHE (2007) Adaptive variation in beach mice produced by two interacting pigmentation genes. PLoS Biol 5: e219 doi:10.1371/journal.pbio.0050219.g001
57. HittingerCT, GonçalvesP, SampaioJP, DoverJ, JohnstonM, et al. (2010) Remarkably ancient balanced polymorphisms in a multi-locus gene network. Nature 464 : 54–58 doi:10.1038/nature08791
58. GietzRD, SchiestlRH (2007) High-efficiency yeast transformation using the LiAc/SS carrier DNA/PEG method. Nature protocols 2 : 31–34 doi:10.1038/nprot.2007.13
59. BrauerMJ, HuttenhowerC, AiroldiEM, RosensteinR, MateseJC, et al. (2008) Coordination of Growth Rate, Cell Cycle, Stress Response, and Metabolic Activity in Yeast. Molecular Biology of the Cell 19 : 352–367 doi:10.1091/mbc.E07-08-0779
60. KahmM, HasenbrinkG, Lichtenberg-FratéH, LudwigJ, KschischoM (2010) grofit: fitting biological growth curves with R. Journal of Statistical Software 33 : 1–21.
61. VenkatramanES, OlshenAB (2007) A faster circular binary segmentation algorithm for the analysis of array CGH data. Bioinformatics 23 : 657–663 doi:10.1093/bioinformatics/btl646
62. LiH, DurbinR (2010) Fast and accurate long-read alignment with Burrows-Wheeler transform. Bioinformatics 26 : 589–595 doi:10.1093/bioinformatics/btp698
63. LiH, HandsakerB, WysokerA, FennellT, RuanJ, et al. (2009) The Sequence Alignment/Map format and SAMtools. Bioinformatics 25 : 2078–2079 doi:10.1093/bioinformatics/btp352
64. AlbersCA, LunterG, MacArthurDG, McVeanG, OuwehandWH, et al. (2011) Dindel: accurate indel calls from short-read data. Genome Res 21 : 961–973 doi:10.1101/gr.112326.110
65. WeiZ, WangW, HuP, LyonGJ, HakonarsonH (2011) SNVer: a statistical tool for variant calling in analysis of pooled or individual next-generation sequencing data. Nucleic Acids Research 39: e132 doi:10.1093/nar/gkr599
66. AndréassonC, NeveEPA, LjungdahlPO (2004) Four permeases import proline and the toxic proline analogue azetidine-2-carboxylate into yeast. Yeast 21 : 193–199 doi:10.1002/yea.1052
67. SchureEG, RielNA, VerripsCT (2000) The role of ammonia metabolism in nitrogen catabolite repression in Saccharomyces cerevisiae. FEMS Microbiology Reviews 24 : 67–83 doi:10.1111/j.1574-6976.2000.tb00533.x
68. LõokeM, KristjuhanK, KristjuhanA (2011) Extraction of genomic DNA from yeasts for PCR-based applications. BioTechniques 50 : 325–328 doi:10.2144/000113672
69. GeB, GurdS, GaudinT, DoreC, LepageP, et al. (2005) Survey of allelic expression using EST mining. Genome Res 15 : 1584–1591 doi:10.1101/gr.4023805
70. JuliusD, BlairL, BrakeA, SpragueG, ThornerJ (1983) Yeast alpha factor is processed from a larger precursor polypeptide: the essential role of a membrane-bound dipeptidyl aminopeptidase. Cell 32 : 839–852.
71. GodardP, UrrestarazuA, VissersS, KontosK, BontempiG, et al. (2007) Effect of 21 different nitrogen sources on global gene expression in the yeast Saccharomyces cerevisiae. Molecular and Cellular Biology 27 : 3065–3086 doi:10.1128/MCB.01084-06
72. ArnoldK, KieferF, KoppJ, BatteyJND, PodvinecM, et al. (2009) The Protein Model Portal. J Struct Funct Genomics 10 : 1–8 doi:10.1007/s10969-008-9048-5
73. DrotschmannK (1999) Mutator phenotypes of yeast strains heterozygous for mutations in the MSH2 gene. Proceedings of the National Academy of Sciences 96 : 2970–2975 doi:10.1073/pnas.96.6.2970
74. BarrickJE, LenskiRE (2009) Genome-wide mutational diversity in an evolving population of Escherichia coli. Cold Spring Harb Symp Quant Biol 74 : 119–129 doi:10.1101/sqb.2009.74.018
Štítky
Genetika Reprodukční medicínaČlánek vyšel v časopise
PLOS Genetics
2014 Číslo 1
Nejčtenější v tomto čísle
- GATA6 Is a Crucial Regulator of Shh in the Limb Bud
- Large Inverted Duplications in the Human Genome Form via a Fold-Back Mechanism
- Differential Effects of Collagen Prolyl 3-Hydroxylation on Skeletal Tissues
- Affects Plant Architecture by Regulating Local Auxin Biosynthesis