
Zinc Finger Transcription Factors Displaced SREBP Proteins as the Major Sterol Regulators during Saccharomycotina Evolution
In most eukaryotes, including the majority of fungi, expression of sterol biosynthesis genes is regulated by Sterol-Regulatory Element Binding Proteins (SREBPs), which are basic helix-loop-helix transcription activators. However, in yeasts such as Saccharomyces cerevisiae and Candida albicans sterol synthesis is instead regulated by Upc2, an unrelated transcription factor with a Gal4-type zinc finger. The SREBPs in S. cerevisiae (Hms1) and C. albicans (Cph2) have lost a domain, are not major regulators of sterol synthesis, and instead regulate filamentous growth. We report here that rewiring of the sterol regulon, with Upc2 taking over from SREBP, likely occurred in the common ancestor of all Saccharomycotina. Yarrowia lipolytica, a deep-branching species, is the only genome known to contain intact and full-length orthologs of both SREBP (Sre1) and Upc2. Deleting YlUPC2, but not YlSRE1, confers susceptibility to azole drugs. Sterol levels are significantly reduced in the YlUPC2 deletion. RNA-seq analysis shows that hypoxic regulation of sterol synthesis genes in Y. lipolytica is predominantly mediated by Upc2. However, YlSre1 still retains a role in hypoxic regulation; growth of Y. lipolytica in hypoxic conditions is reduced in a Ylupc2 deletion and is abolished in a Ylsre1/Ylupc2 double deletion, and YlSre1 regulates sterol gene expression during hypoxia adaptation. We show that YlSRE1, and to a lesser extent YlUPC2, are required for switching from yeast to filamentous growth in hypoxia. Sre1 appears to have an ancestral role in the regulation of filamentation, which became decoupled from its role in sterol gene regulation by the arrival of Upc2 in the Saccharomycotina.
Published in the journal:
. PLoS Genet 10(1): e32767. doi:10.1371/journal.pgen.1004076
Category:
Research Article
doi:
https://doi.org/10.1371/journal.pgen.1004076
Summary
In most eukaryotes, including the majority of fungi, expression of sterol biosynthesis genes is regulated by Sterol-Regulatory Element Binding Proteins (SREBPs), which are basic helix-loop-helix transcription activators. However, in yeasts such as Saccharomyces cerevisiae and Candida albicans sterol synthesis is instead regulated by Upc2, an unrelated transcription factor with a Gal4-type zinc finger. The SREBPs in S. cerevisiae (Hms1) and C. albicans (Cph2) have lost a domain, are not major regulators of sterol synthesis, and instead regulate filamentous growth. We report here that rewiring of the sterol regulon, with Upc2 taking over from SREBP, likely occurred in the common ancestor of all Saccharomycotina. Yarrowia lipolytica, a deep-branching species, is the only genome known to contain intact and full-length orthologs of both SREBP (Sre1) and Upc2. Deleting YlUPC2, but not YlSRE1, confers susceptibility to azole drugs. Sterol levels are significantly reduced in the YlUPC2 deletion. RNA-seq analysis shows that hypoxic regulation of sterol synthesis genes in Y. lipolytica is predominantly mediated by Upc2. However, YlSre1 still retains a role in hypoxic regulation; growth of Y. lipolytica in hypoxic conditions is reduced in a Ylupc2 deletion and is abolished in a Ylsre1/Ylupc2 double deletion, and YlSre1 regulates sterol gene expression during hypoxia adaptation. We show that YlSRE1, and to a lesser extent YlUPC2, are required for switching from yeast to filamentous growth in hypoxia. Sre1 appears to have an ancestral role in the regulation of filamentation, which became decoupled from its role in sterol gene regulation by the arrival of Upc2 in the Saccharomycotina.
Introduction
Changes in gene regulatory networks are an important mechanism of evolutionary adaptation. Transcriptional re-wiring can result from gene loss, gene duplication, alterations in transcription factor binding sites, or changes in protein modularity that affect the interaction of transcription factors with other regulators [1], [2], [3], [4], [5]. A hybrid ancestral state may be resolved in different ways in different lineages, such as occurred in the regulation of cell type specific genes in the Saccharomycotina yeasts [1], [6] and the substitution of transcription factors regulating of ribosomal protein genes in Ascomycota fungi [2]. Other examples include substitution of the transcription factor Cph1 with Gal4 for regulation of galactose metabolism genes in the Saccharomyces clade [7], and changes in telomere binding proteins [8]. Large-scale analysis of promoter motifs and transcription factor conservation suggests that re-wiring of networks may be relatively common in eukaryotes [9]. However, most reported evolutionary changes involve the connection or disconnection of a group of target genes from a particular transcription factor, while the cellular function of the factor remains the same [9].
We describe here a major transcriptional re-wiring event that occurred in the evolution of sterol synthesis (an oxygen-dependent process) in eukaryotes. Regulation of sterol synthesis by Sterol Regulatory-element Binding Proteins (SREBPs) is very well conserved between metazoa and most fungi, but this conserved system has been disrupted in the clade of yeasts that includes S. cerevisiae. In these yeasts the role of SREBPs in sterol synthesis has been replaced by Upc2 (reviewed in [10], [11], [12]).
SREBPs regulate cholesterol synthesis and uptake, and fatty-acid synthesis in mammalian cells [13]. They are a family of transcription factors with a bHLH (basic Helix-loop-Helix) domain with a characteristic tyrosine residue. When sterol levels are high, SREBPs interact with the sterol-sensing protein Scap (SREBP cleavage-activating protein) and the complex is retained at the endoplasmic reticulum (ER) through association with INSIG (insulin-induced protein) [14]. When sterol levels drop, cholesterol no longer binds to Scap, disrupting the interaction with INSIG and resulting in transport of the SREBP-Scap complex to the Golgi apparatus [15]. Here, two proteases (site-1 protease and site-2 protease) cleave SREBP firstly in the loop within the Golgi lumen, and secondly to release the N-terminal domain. The N-terminus of SREBP enters the nucleus where it acts to regulate gene expression (reviewed in [10], [16]).
SREBPs are well conserved in many fungi and have been shown to regulate sterol synthesis in several species, particularly in response to low oxygen [10]. Not all components of the pathway are conserved. In Basidiomycetes (such as Cryptococcus neoformans) and in some Ascomycetes (e.g. Schizosaccharomyces pombe) SREBPs interact with Scap proteins, but the INSIG homolog appears to play no role in retention in the ER membrane [17]. The N-terminal region of SREBP is released by a single cleavage reaction. In C. neoformans, this cleavage is carried out by a homolog of the mammalian site-2 protease [18], [19]. In the Ascomycetes (Sch. pombe and Aspergillus fumigatus), processing does not require the site-1/site-2 proteases but instead uses the Dsc E3 ligase complex and the proteasome [20], [21], [22]. Some Ascomycete lineages such as Eurotiomycetes (including A. fumigatus) have lost Scap, and it is not clear what their sterol-sensing mechanism is [10], [11].
At least some fungal SREBPs are also regulated by oxygen levels independently of sterol levels. In Sch. pombe, oxygen-dependent degradation of the N-terminus of the SREBP protein (Sre1N) is regulated by Ofd1, a member of the prolyl hydroxylase family, and by Nro1, a nuclear protein [23], [24]. Ofd1 also regulates binding of Sre1N to sterol regulatory elements (SRE) [25].
Surprisingly, within the Saccharomycotina subphylum of the Ascomycetes, SREBP proteins appear to play little or no role in regulating oxygen-dependent expression of sterol biosynthesis genes. Some SREBP-like proteins, with the characteristic tyrosine in the bHLH domain, are present in these species, for example C. albicans Cph2 and S. cerevisiae Hms1 [10]. However, these proteins are often considerably shorter than their homologs in other Ascomycetes, and no role for them in sterol gene regulation has been demonstrated [26]. Instead, sterol gene expression in Saccharomycotina is controlled by Upc2 proteins, which have Gal4-type Zn2-Cys6 zinc finger domains, and are structurally unrelated to SREBPs. Members of the Upc2 family regulate expression of sterol and other hypoxic genes in S. cerevisiae, Candida glabrata, C. albicans and C. parapsilosis [27], [28], [29], [30], [31].
We observed that Yarrowia lipolytica, representing the most divergent known lineage of the Saccharomycotina, is unique among fungi in having a genome that contains readily identifiable genes for both SREBP and Upc2. It may thus be a ‘molecular fossil’ of a transition stage during the handover of control of sterol metabolism from SREBP to Upc2 in the Saccharomycotina. We show here that in Y. lipolytica, both Upc2 and SREBP play a role in responding to hypoxic conditions. However, Upc2 is the main regulator of sterol genes. SREBP (Sre1), and to a lesser extent Upc2, regulates filamentous growth. Our analysis suggests that re-wiring of the ergosterol synthesis module occurred in an early ancestor of the Saccharomycotina, when regulation was ceded to Upc2.
Results
Conservation of Sre1 and Upc2
The Saccharomycotina is a lineage within the Ascomycetes that includes the Saccharomycetaceae and CTG clades (Figure 1A). The CTG clade contains Candida species in which the codon CTG is translated as serine rather than leucine [32], [33]. Y. lipolytica, a lipid degrading yeast [34], lies at the very base of the Saccharomycotina. Y. lipolytica has a gene (YALI0D15334) that is similar to Sre1 from Sch. pombe (maximum 30% identity) and SrbA from A. fumigatus (maximum 44%). One of the conserved regions corresponds to a bHLH domain near the N terminus, with a tyrosine rather than an arginine in the basic domain [35] (Figure 1A,B). The arginine-to-tyrosine substitution changes the DNA sequence that is bound, from the standard E-box recognized by most bHLH proteins to sequence called a sterol regulatory element-1 (SRE-1) [36]. The similarity to the SREBPs extends beyond the bHLH region. The Y. lipolytica protein also has a domain (DUF2014; Figure 1A) towards its C terminus that is shared with Sch. pombe Sre1 and A. fumigatus SrbA and other filamentous Ascomycetes. The function of this domain is unknown. It may be important for interaction with Scap and therefore for retention of SREBP in the membrane. However, SREBP proteins of Aspergillus species, which have lost Scap [10], retain the DUF2014 domain. The DUF2014 domain appears to have been acquired by the SREBPs in the ancestor of the Ascomycota, as it is not found in Sre1 of C. neoformans and other Basidiomycetes.

Most fungi have only one family of SREBP-like proteins, but Saccharomyces and Candida species have homologs of two potential SREBP-like protein families, both of which have bHLH domains with the characteristic tyrosine residue. One family (pink region in Figure 1C) is represented by Tye7 in S. cerevisiae and C. albicans. This family is restricted to the Saccharomycotina and is composed of short proteins (218–385 amino acids) without a DUF2014 domain. Tye7 regulates expression of glycolytic genes in S. cerevisiae and C. albicans [37], [38], [39], [40]. The second family (orange region in Figure 1C), is represented by Cph2 in C. albicans and Hms1 in S. cerevisiae. This family contains longer proteins with higher similarity to Sch. pombe Sre1 and Sre2, and has bHLH regions more similar to other SREBPs (Figure 1B,C). However, there is little conservation in the C-terminal regions between Hms1/Cph2 and the other fungal SREBPs, and the DUF2014 domain is not generally present, although in Meyerozyma guilliermondii (within the Candida clade) a remnant is recognizable (Pfam [41] E-value of 3.5e-4, compared to 3.4e-80 for the Y. lipolytica protein). Hms1 orthologs in S. cerevisiae and other species in the post-Whole Genome Duplication clade [42] are much smaller, and as a result the bHLH domain is closer to the C terminus (Figure 1A). The structure of the Hms1/Cph2 proteins including the apparent historical DUF2014 domain in M. guilliermondii, and their phylogenetic closeness to Sch. pombe Sre1 and the Pezizomycotina SREBPs, suggests that they (rather than Tye7) are the Saccharomycotina orthologs of SREBP. However, they have undergone substantial modification, including the degeneration of the DUF2014 domain. The Y. lipolytica protein, which we have named Sre1, is the only one within the Saccharomycotina species that retains an intact DUF2014 domain. It clearly falls within the Cph2/Hms1 clade (Figure 1C).
In C. neoformans, Sch. pombe and A. fumigatus, oxygen regulates the cleavage and localization of the SREBP transcription factor domain, releasing it from the ER and Golgi membrane and facilitating entry into the nucleus [18], [19], [20], [21], [22]. The C. neoformans and Sch. pombe proteins have two predicted membrane spanning domains, suggesting that both C and N termini are facing into the cytoplasm ([43], Figure 1A, Figure S1). SrbA from A. fumigatus is predicted to contain at least two (and possibly up to four) transmembrane domains, indicating that the protein is localized to membrane structures, with at least the N terminus facing the cytoplasm (Figure S1). Within the Saccharomycotina however there is very little evidence that the SREBP proteins are localized to membranes. For Sre1 from Y. lipolytica and Cph2 from C. albicans, there is <10% probability of one or two transmembrane domains respectively, and there is no indication of any transmembrane domain in the S. cerevisiae Hms1 protein.
In contrast to SREBP, orthologs of Upc2 are only clearly identifiable within the Saccharomycotina (Figure 1A; Figure 2). In fact, in the post-Whole Genome Duplication clade, two paralogs (known as Upc2 and Ecm22 [30]) have been retained in all species (yellow clade in Figure 2). The Upc2 and Ecm22 proteins contain a fungal Zn2-Cys6 binuclear cluster domain, and a domain associated with fungal-specific transcription factors. The Upc2/Ecm22 proteins from the Saccharomycotina form a monophyletic clade that is not closely related to any other Zn2-Cys6 proteins of the Saccharomycotina (such as Lys14), or Ascomycota (Figure 2). The most likely interpretation of the phylogeny in Figure 2 is that Upc2 arose in the common ancestor of the Saccharomycotina, before the split between the Y. lipolytica lineage from the rest of the clade. Upc2 was presumably created by duplication of another zinc finger protein gene, but it has diverged to the point where its orthologs in species such as Aspergillus and Komagataella, if they exist, are unrecognizable (Figure 2).

Y. lipolytica Upc2 regulates sterol metabolism
To determine the role of the Sre1 (YALI0D15334) and Upc2 (YALI0B15818) orthologs in Y. lipolytica we knocked out both genes in the W29 background (Figure S2). YlUPC2 was replaced with URA3, and YlSRE1 with LEU2, in Y. lipolytica Po1d (leu2–270, ura3–302 [44]) using fusion PCR [45] and previously described transformation methods [46]. The remaining markers (LEU2 or URA3) were re-introduced into all strains, to reconstitute prototrophy (Table S1). YlSRE1 and YlUPC2 were also reintroduced at the endogenous locus by insertion of a cassette containing the relevant open reading frame plus 800 bp of the upstream region and a hygromycin resistance marker (HygEx). Deleting YlSRE1 has a minimal effect on growth on rich media, whereas deleting YlUPC2 reduces growth further, and the double deletion has a pronounced growth defect (Figure 3, growth curves are shown in Figure S3).

Deleting YlUPC2 dramatically increases the susceptibility of Y. lipolytica to ketoconazole, whereas deleting YlSRE1 has no obvious effect (Figure 3A). The level of drug required to inhibit growth is much higher when cells are grown on synthetic complete (SC) media than when grown on rich media (YPD); the reason for the difference is not known, but deleting YUPC2 has the same effect on both media. The susceptibility phenotype is similar to that observed when UPC2 is deleted in S. cerevisiae [47], C. albicans [48], [49] and C. parapsilosis [27], and when SrbA is deleted in A. fumigatus [50] and SRE1 in C. neoformans [19]. Azole drugs target the ergosterol pathway in fungi, and in particular the product of the ERG11 gene, which encodes Lanosterol 14-alpha-demethylase. We therefore measured the level of sterols in the various genetic backgrounds (Figure 3B). Cells were grown in defined minimal media, and sterols were extracted using an alcoholic KOH solution and heptane [49]. Figure 3B shows that deletingYlUPC2 reduces absorbance at wavelengths that are indicative of lower sterol content, which are restored when the YlUPC2 gene is re-introduced. Two independent deletions of YlSRE1 had no reduction in sterol levels. There appears to be a slight additional reduction in the double deletion background relative to the Ylupc2 deletion, but this is not statistically significant.
Deleting YlUPC2 greatly reduces growth in hypoxic (1% O2) compared to normoxic conditions, during growth on both synthetic complete (SC) media containing methionine or rich (YPD) media (Figure 3A). Deleting YlSRE1 also reduces hypoxic growth, which is more pronounced on defined media. The strain carrying deletions of both YlUPC2 and YlSRE1 grows poorly on YPD plates in normoxia, and fails to grow at all in hypoxic conditions. Adding fatty acids to SC media (in the form of Tween 80) improves growth of all strains, but the effect of deleting YlUPC2 and YLSRE1 is still evident (Figure 3). Addition of ergosterol does not rescue the phenotype any further, though this is possibly because Y. lipolytica cannot import sterols either aerobically or anaerobically (Figure S4). Reintroducing YlUPC2 and YlSRE1 in the single deletion strains restores growth in hypoxia (Figure 3).
In Aspergillus fumigatus, SrbA regulates expression of iron uptake genes, as well as of ergosterol synthesis [51]. We therefore tested the effect of deleting YlUPC2 and YlSRE1 on growth in low iron conditions. Figure 3C shows that when iron levels are depleted by adding the iron chelator BPS (4,7-diphenyl-1,10-phenanthrolinedisulfonic acid), the Ylupc2 deletion strain fails to grow, whereas deleting YlSRE1 has no effect. The phenotype is rescued by adding additional exogenous iron. In Y. lipolytica, UPC2 therefore regulates both iron acquisition and sterol metabolism.
Sre1 and Upc2 regulate filamentation in hypoxic conditions
Y. lipolytica and C. albicans are unusual among the Saccharomycotina species in that they can switch from growth as yeast cells to fully filamentous (hyphal) growth in certain conditions [52], [53]. Other species grow as yeast and pseudohyphae, or are locked in the filamentous form [54]. Y. lipolytica is truly dimorphic [34], [55]. Hyphae are induced by altering carbon source or pH, or by growing in hypoxic conditions [55], [56] [57]. We determined the effect of deleting YlUPC2 and YlSRE1 on hypoxia-induced filamentation of cells growing in rich (YPD) or minimal (SC) media, in both solid and liquid conditions (Figure 4). During growth in liquid YPD in normoxia, the strains are predominantly yeast-like, irrespective of the genetic background. Very few short filaments are formed. During growth in hypoxic conditions, the wild type and reconstituted strains are hyperfilamentous. The Ylupc2 deletion also produces some long filaments. However, the Ylsre1 deletion generates only very short filaments. Adding fatty acids (Tween 80) recovers the hypoxia-induced filamentation phenotype in the Ylsre1 background, and improves filamentation of the Ylupc2 deletion.

There is very little difference in cell morphology in cells growing in liquid SC in normoxic or hypoxic conditions. The wild type and reconstituted strains are filamentous, whereas the Ylupc2 and Ylsre1 deletions are predominantly yeast-like, with some short filaments found in the Ylsre1 background. Adding Tween 80 rescues the induction of filamentation of Ylupc2 and Ylsre1 in hypoxic conditions, and partially increases filamentation of the Ylsre1 deletion even in normoxia.
It has been reported that filamentation levels are higher on solid rather than liquid media [58]. On solid YPD media, we found that the wild type and the Ylupc2 deletion strains are filamentous in both normoxic and hypoxic conditions. However, the sre1 deletion fails to filament, even in hypoxia. On solid SC media, hypoxia induces filamentation of the wild type and the Ylupc2 deletion, but not the Ylsre1 deletion. Overall, our results show that YlSre1 is required for hypoxic-induced filamentation in all conditions and media tested, and YlUpc2 is required in most conditions. The double deletion remains in the yeast morphology, and fails to grow at all in hypoxia, suggesting that the two transcription factors act synergistically.
Differential gene expression in hypoxia
To determine the roles of YlUpc2 and YlSre1 in regulating the hypoxic response, we first characterized the transcriptional profile of Y. lipolytica during growth in low oxygen. Y. lipolytica can tolerate oxygen levels as low as 1% (Figure 3), but it is incapable of anaerobic growth [52]. We used strand-specific RNA-seq to compare the transcriptional profile of cells grown in YPD in atmospheric oxygen levels and at 1% O2. Differentially expressed genes were identified using DESeq [59].
Approximately 1,900 genes are differentially expressed in low oxygen, corresponding to 30% of the genome (Table S2). This corresponds well with the response of S. cerevisiae, where >2,000 genes have altered expression in anaerobic conditions [60]. We used DAVID (Database for Annotation, Visualization and Integrated Discovery) to identify enrichment of specific categories among the differentially expressed genes [61]. DAVID applies several categorization tools, incorporating annotation categories that include Gene Ontology assignments, KEGG metabolic pathways, and InterPro database of protein families and domains. Genes upregulated in hypoxia are enriched for categories associated with membrane structure, ion binding and oxidoreductase activity (Table 1).

Notably, transcription factors are also significantly over-represented in genes upregulated in hypoxia (Table 1, Table S6). Expression of 78 genes with potential transcription factor activity is upregulated, including both YlUPC2 and YlSRE1 (Table S6). Expression of HOY1, a homeobox gene required for hyphal development in Y. lipolytica [58], [62], is among the genes with the highest fold induction. Interestingly, the transcription factor with the greatest increase in expression in hypoxia (YALI0C03564g) encodes a protein of unknown function, with a bHLH domain (Table S3). However, this domain does not contain the atypical Tyr residue, and probably binds to an E-box sequence rather than an SRE-1 element.
Downregulated genes are enriched in processes including ribosome biogenesis, rRNA processing, translation and microtubule function (Table 1, Table S6). These changes reflect the fact that the strains are growing slowly in hypoxic conditions (Figure 3, [63]).
Regulation of the hypoxic response
To compare the effects of deleting YlUPC2 and YLSRE1 on the transcriptional profile of Y. lipolytica we analyzed the RNA-seq data using gene enrichment analysis implemented in DAVID [61], and by hierarchical clustering (Table 1, Figure 5, Figure S7). The overall transcriptional response of the deletion strains to hypoxia is very similar to the response of the wild type (Figure 5A,B). More than 1200 genes are differentially expressed in hypoxia in all three backgrounds (Figure 5B). This suggests that there are many other transcription factors apart from UPC2 and SRE1 that regulate the hypoxic response, supporting our analysis of hypoxic induction in wild type cells (Table 1).

Gene enrichment analysis shows that deleting Ylupc2 results in lowered expression of steroid metabolism genes, even when the strains are grown in normoxic conditions (Table 1, Table S6). The effect of YlUPC2 on sterol metabolism during hypoxic growth is also obvious from the hierarchical cluster analysis (Figure 5A). Expression of one cluster of 14 genes is notably reduced in the Ylupc2 deletion, while remaining upregulated in the Ylsre1 strain grown in hypoxia (Figure 5A). This group includes four genes required for ergosterol biosynthesis, all of which function in the oxygen-dependent part of the pathway. Two are paralogs of ERG2 (C-8 sterol isomerase), one of which we have designated as ERG2-2. Expression of both is greatly reduced in the Ylupc2 deletion, but not in the Ylsre1 background. Most of the remaining genes in the cluster have roles in redox reactions, such as formate dehydrogenase, superoxide dismutase and glutathione-S-transferase.
Although not all of the ergosterol metabolism genes fall in the same cluster shown in Figure 5A, many are highly expressed in hypoxic conditions in wild type cells, and expression is greatly reduced (or abolished) in a Ylupc2 deletion (Figure 5C). To determine if YlUpc2 is likely to be a direct regulator of ERG genes, we looked for evidence of enrichment of potential binding sites in the upstream promoters. We found that the Upc2 motif defined in S. cerevisiae is enriched in the promoter regions of ergosterol genes in all Saccharomycotina species, including Y. lipolytica (Table 2, genes shown in Figure 5C). In contrast, there is no enrichment in the equivalent promoters of Sch. pombe or A. fumigatus, species in which ergosterol genes are regulated by SREBPs [10]. Potential binding motifs were identified in 16 of the 21 promoters tested. ERG2 and ERG2-2, the two genes with the strongest reduction in expression in the Ylupc2 deletion (Figure 5A, Figure 6), have four potential binding sites each.


Genes with reduced expression in the Ylupc2 deletion relative to wild type in hypoxic conditions are also enriched for processes associated with cell redox, antioxidant activity and glutathione-S-transferase (Table 1, Table S6). YlUpc2 may therefore be involved in protection from oxidative stress. Many of the other downregulated genes are enriched for processes associated with translation, such as ribosome biogenesis and rRNA processes (Table 1, Table S6). This most likely reflects the fact that deleting Ylupc2 further reduces growth in hypoxia (Figure 3).
Sre1 does not play a major role in regulating expression of sterol genes during long term growth in hypoxia; expression of the ERG genes in the Ylsre1 deletion is very similar to that of the wild type cells grown in hypoxic conditions (Figure 5A,B), and sterol levels are not reduced in a Ylsre1 deletion (Figure 3C). Deleting YlSRE1 results in increased expression of lipid metabolism and fatty acid metabolism genes (Table 1, Table S6). However, unlike in mammalian cells, Drosophila, and Sch. pombe, the potential targets are mostly associated with lipid degradation, rather than biosynthesis (Table S6, [13], [64], [65]). The most highly enriched processes among downregulated genes compared to wild type are associated with ribosomal biogenesis and rRNA binding, which correlates with poor growth. Genes upregulated in the Ylsre1 deletion relative to wild type are mostly associated with proteasome-dependent proteolysis, which may also result from slow growth (Table 2).
In the Ylupc2/Ylsre1 double deletion, growth is greatly diminished and most downregulated genes are associated with translation (Table S6). Enrichment categories of upregulated genes are very similar to the categories upregulated during hypoxic growth of wild type cells (Table S6). It was not possible to determine the effect of deleting both YlUPC2 and YlSRE1 on the transcriptional response to hypoxia, because the double deletion strain fails to grow in low oxygen conditions (Figure 3).
For the RNA-seq experiments, cells were grown in rich media to minimize the effects of reduced cell growth, which is more pronounced in synthetic complete media (Figure 3). The strains were also grown for prolonged periods in hypoxic conditions. It is possible that the gene expression patterns would be different during growth in defined media, and during earlier stages of adaptation to low oxygen. We therefore used quantitative PCR to measure the expression of five genes in the ergosterol pathway in cells grown in synthetic complete media in high oxygen to mid log phase, which were shifted to hypoxic conditions for 2 hours. Figure 6 shows that YlUPC2 is required for maximum hypoxic induction of all five genes. In particular, expression of ERG2 and its paralog ERG2-2 is completely dependent on YlUPC2, even in normoxic conditions. This pattern is similar to that observed in the RNA-seq experiments. However we find that YlSRE1 is required for maximal hypoxic induction of at least four genes (ERG2, ERG3, ERG11 and ERG25). It is therefore likely that YlSre1 plays a role in regulating expression of ergosterol genes at early stages of hypoxic adaptation.
Discussion
Upc2 regulates sterol synthesis in the Saccharomycotina
Sterols are essential for maintaining membrane structure and function, and synthesis in fungi and other eukaryotes is very carefully regulated at several levels [66]. Our results indicate that Upc2 is the major regulator of expression of sterol synthesis genes in Y. lipolytica. Expression of many of the sterol genes is reduced in the Ylupc2 deletion, particularly during hypoxic growth, and the level of sterols in the cell is also reduced (Figure 3, Figure 5). Promoter analysis also indicates that the Upc2 binding sites are enriched in the promoters of sterol synthesis genes in Y. lipolytica and other species of the Saccharomycotina, but not in the equivalent promoters in A. fumigatus or Sch. pombe (Table 2). It is therefore likely that Upc2 homologs are the main regulators of sterol synthesis in all Saccharomycotina species. This has been shown experimentally for C. albicans, C. parapsilosis, S. cerevisiae and C. glabrata [27], [28], [29], [30], [31], [67], and now for Y. lipolytica.
Although the role of Upc2 is generally conserved, there are also substantial species-specific variations. Deleting Ylupc2 results in a growth defect, which has not been reported in other Saccharomycotina species [30], [49]. YlUpc2 also regulates expression of ERG genes in normoxia (in particular, expression of ERG2 and ERG2-2, Figure 6). In C. albicans, the role of Upc2 is generally only evident when ergosterol gene expression is induced with ketoconazole or growth in hypoxia, or with gain-of-function alleles of UPC2 [29], [68]. In S. cerevisiae, Upc2/Ecm22 regulates expression of sterol synthesis and sterol uptake genes [30], [69]. The Upc2 paralogs control sterol import in C. glabrata [70], but not in C. albicans [31]. Y. lipolytica does not have an obvious ortholog of the AUS1/PDR11 sterol transporters from S. cerevisiae [69], [71] nor of the regulator of sterol import, SUT1 [72]. Y. lipolytica also apparently does not import cholesterol (and therefore probably ergosterol) in aerobic or hypoxic conditions (Figure S4).
The Upc2 proteins in the Saccharomycotina are under considerable evolutionary constraint (indicated by short branch lengths in Figure 2), and are relatively distant from even their closest Pezizomycotina counterparts. This supports our hypothesis that Upc2 appeared in, or was substantially modified in, the ancestor of the Saccharomycotina (Figure 7), and the function has been generally conserved since. In Y. lipolytica, Upc2 also regulates iron uptake, which is controlled by SREBPs in A. fumigatus [51].
It is currently unknown how Upc2 proteins sense oxygen. However, the mechanism seems to be different from SREBP type of proteins. Our recent unpublished data indicate that Upc2 in S. cerevisiae does not undergo proteolytic cleavage, both its C - and N-terminus localize to the nucleus upon activation and its DNA binding domain seems to lose transcriptional activity without the protein's C-terminus. In addition, introducing an HA-tag at the C terminus of C. albicans Upc2 results in a gain-of-function, which may result from altered activation rather than processing [68].
Role of Sre1 in the hypoxic response
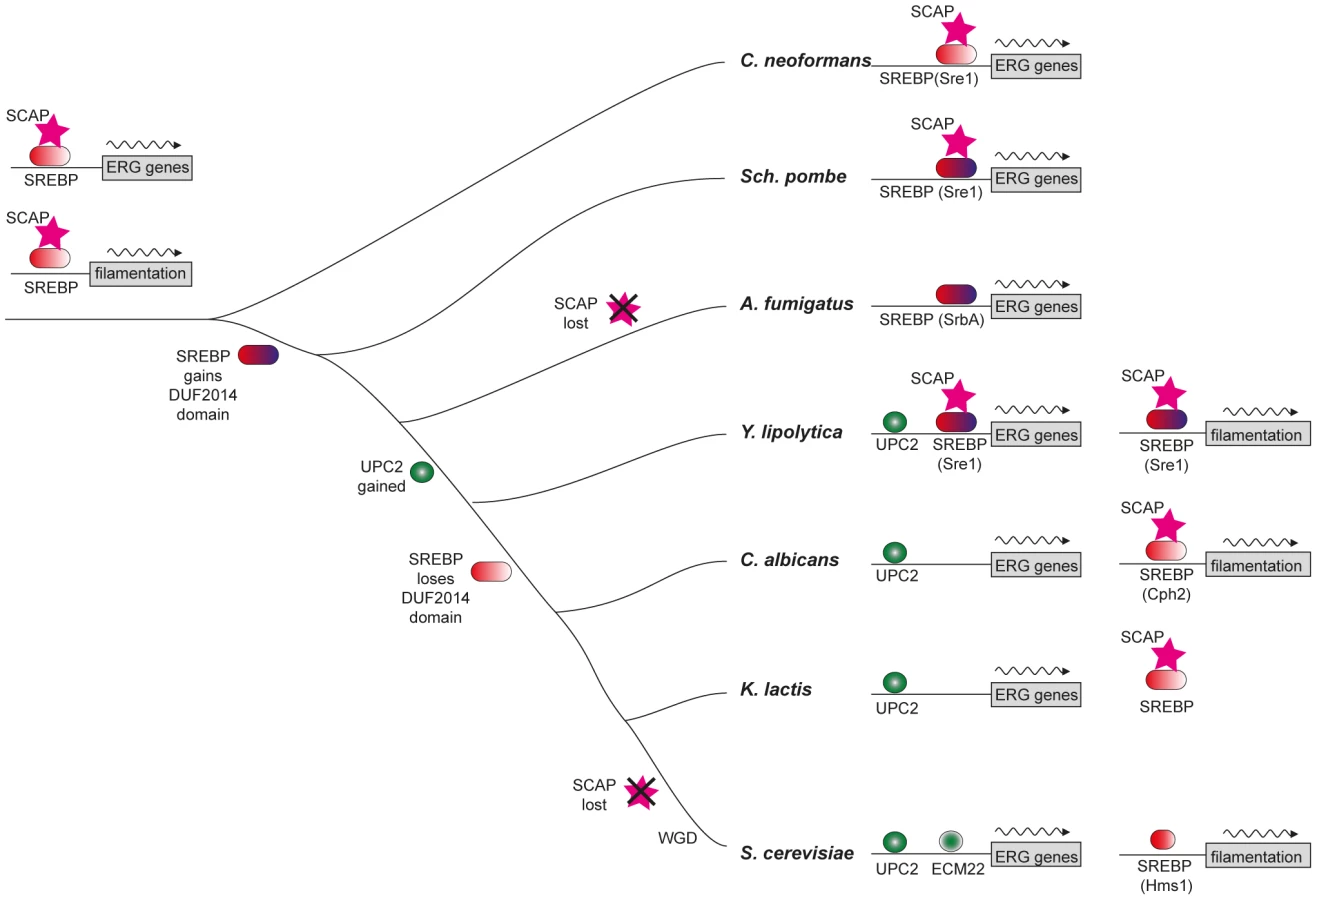
SREBPs are major regulators of sterol synthesis and of the hypoxic response in Basidiomycete fungi (e.g. C. neoformans) and in some Ascomycetes (e.g. Sch. pombe and A. fumigatus, Figure 7) [10], [11], [12]. The SREBPs in the Ascomycetes gained a domain (DUF2014), whose function is currently unknown (Figure 7). DUF2014 is retained in the Y. lipolytica protein, but was lost in the most likely orthologs of Sre1 in the other Saccharomycotina species, including S. cerevisiae (Hms1) and C. albicans (Cph2). Hms1 and Cph2 have no known role in hypoxic regulation. However, we find that in Y. lipolytica, deleting SRE1 reduces growth in hypoxic conditions (Figure 3). The defect in long-term hypoxic growth is unlikely to be due to regulation of sterol synthesis, because expression is not reduced in rich media (Figure 5A), and sterol levels are not reduced in the Ylsre1 single deletion (Figure 3B). However, Sre1 contributes to induction of ERG genes during hypoxic adaptation (Figure 6). This suggests that whereas Upc2 is the major regulator of sterol genes, both Sre1 and Upc2 act synergistically at ERG promoters is some conditions (Figure 7). YlSre1 also has a role in response to long-term hypoxic growth that is separate from that of sterol biosynthesis.
The overall hypoxic response of Y. lipolytica is somewhat different to that of other fungi. Expression of fatty acid biosynthesis, drug transport and membrane proteins is increased, similar to that observed in fungi like S. cerevisiae and C. albicans (reviewed in [11]). Expression of sterol metabolism is also increased; although we do not find enrichment of sterol metabolism genes in the RNA-seq analysis using DAVID, it is clear from hierarchical clustering and from qRT-PCR (Figure 5, Figure 6). Unlike in S. cerevisiae and C. albicans, we did not observe changes in central carbon metabolism, such as upregulation of glycolysis and downregulation of the TCA cycle [29], [73]. Similar changes do occur in some obligate aerobes like A. fumigatus [74], but expression of glycolysis is reduced in others such as Trichoderma reesii [75]. In the aerobe C. neoformans, respiration is increased in low oxygen [19]. It is possible that we would observe different patterns in Y. lipolytica if we measured expression levels during short-term adaptation to hypoxia, or during growth in minimal media.
Sre1 and Upc2 regulate filamentation
SREBP-like proteins from both S. cerevisiae and C. albicans are involved in regulating cell morphology. Overexpressing HMS1 in S. cerevisiae results in hyperfilamentous growth [76]. The SREBP Cph2 from C. albicans was first isolated as a high copy inducer of pseudohyphal growth in S. cerevisiae, and it was subsequently shown that deleting cph2 in C. albicans reduced the ability to switch to hyphal growth on Lees medium [26]. Hyphal induction in other conditions (such as growth following the addition of serum) is not impaired. Cph2 acts through the TEA/ATTS transcription factor TEC1 to regulate filamentous growth. Several other pathways also regulate filamentation, including the Efg1-regulated cAMP-dependent protein kinase A (PKA) pathway, and the Cph1-mediated mitogen-activated protein kinase (MAPK) pathway (reviewed in [77]). The different pathways converge on some of the same target genes [78]. In Y. lipolytica, the equivalent MAPK pathway regulates filamentous (or mycelial) growth, whereas the cAMP-dependent PKA pathway is required for yeast-like growth [79], [80], [81], [82]. Filamentation is also regulated by Tec1; however, unlike C. albicans, Tec1 appears to promote yeast rather than hyphal growth [83].
We show that YlSre1 is required for hypoxia-induced filamentation, and that the filamentation phenotype is rescued by the addition of fatty acids (Figure 4). There are some differences in phenotype in liquid versus solid media and in rich versus minimal media, suggesting that there are several different signals inducing filamentous growth. However, deleting YlSRE1 reduces filamentation in most conditions. Our results suggest that the bHLH Sre1-like proteins are ancient regulators of morphology, and indeed of filamentous growth, in the Saccharomycotina. Family members regulate cell morphology in at least three species – S. cerevisiae, C. albicans, and in the basal species Y. lipolytica. The role may be even older, as the Sre1 homolog in A. fumigatus (SrbA) is also required for cell polarity and hyphal branching [50]. We do not yet know how Sre1 regulates filamentation, though it may be linked to regulation of fatty acid synthesis. However, we note that one of the few known regulators of filamentation in Y. lipolytica (Hoy1 [58]) is induced in hypoxia (Tables S2, S3).
Upc2 also plays a role in hypoxia-induced filamentation in Y. lipolytica (Figure 4). The phenotype is generally less pronounced than deleting Ylsre1, especially in rich media. However, the double deletion fails to filament in any condition. It is therefore likely that in Y. lipolytica, Sre1 and Upc2 both regulate filamentation genes, similar to their dual role in regulating ergosterol metabolism.
In mammalian cells and in some fungi, SREBPs act together with sterol-sensing Scap proteins to regulate oxygen sensing [10]. Scaps retain SREBPs in the membrane in C. neoformans and Sch. pombe, though there is no homolog present in A. fumigatus or other Eurotiomycete species [10], [50]. There is a Scap homolog in Y. lipolytica (YALI0F00968p) that contains a sterol-sensing domain and several predicted transmembrane domains (Figure 7, Figure S5). There is also an apparent homolog in C. albicans and other species in the CTG clade, but these proteins have lost the sterol-sensing domain (Figure S5). Within the Saccharomyces clade, Scap has been lost from S. cerevisiae and its close relatives (Figure 7). However, Scap is present in other lineages, and a potential sterol-sensing domain is clearly identifiable (Figure 7, Figure S5). It therefore appears that Scap may play a role in sensing sterols (and therefore low oxygen) in some of the species in the Saccharomycotina. In other species (and in particular in the Saccharomyces and Candida clades) it is unlikely that Scaps and SREBPs are involved in sterol sensing.
We present here a significant example of transcriptional re-wiring, resulting from the substitution of SREBPs, conserved across a wide stretch of evolutionary time from Metazoa to fungi, by the Upc2 transcription factor that arose in the Saccharomycotina. The re-wiring is particularly important for fungal pathogens because expression of the sterol synthesis module confers susceptibility to azole drugs. We also describe a dramatic change in the function of SREBP homologs in the Saccharomycotina, from regulators of sterol synthesis to regulators of filamentation. Our results suggest that Y. lipolytica may represent a transitional stage, where both Upc2 and SREBPs contribute to regulation of sterol metabolism and filamentation.
Materials and methods
Media and strains
Yeast strains were maintained on solid YPD agar plates (1% yeast extract; 2% Bacto peptone; 2% glucose; 2% agar) at 28°C unless otherwise indicated. Hygromycin (Sigma) was added to YPD (1% yeast extra, 2% Bacto peptone, 2% glucose) at a final concentration of 300 µg/ml. Ketoconazole was added to YPD at a final concentration of 0.025 µg/ml and to SC at 1 µg/ml. Hypoxic conditions (1% O2, 99% N2) were obtained using an InVivo2 400 hypoxic chamber. Transformants were selected on synthetic complete (SC) agar (0.19% yeast nitrogen base (YNB) without amino acids; 2% glucose; 2% agar; 0.5% ammonium sulfate; 0.075% amino acid drop-out mix lacking the relevant amino acid). For phenotype analysis, overnight cultures from single colonies were grown in liquid and solid SC (0.67% YNB, 2% glucose, 2% agar where required) or YPD media at 28°C and 200 rpm. 0.5 ml of the saturated overnight culture was washed twice with and resuspended in 1 ml PBS. Cells were diluted to 6.25×10⁵ cells in 1 ml PBS, and further 5-fold dilutions in PBS were generated. 3 µl were transferred to relevant media, incubated at 28°C at either 21% O2 or 1% O2 for 2 days and then photographed.
Bacterial strains were grown on LB agar without NaCl (1.5% agar; 1% tryptone; 0.5% yeast extract) supplemented with kanamycin at a final concentration of 50 µg/ml.
Calcofluor White staining
For liquid cultures, cells from a single colony on SC medium were incubated in 10 ml YPD or SC media and 1% Tween 80 - EtOH (vol∶vol = 1∶1) where indicated, and incubated at 28°C and 21% O2 or 1% O2 overnight. The cultures were washed, resuspended in PBS and 5 µl was mixed with 5 µl of 0.2 mM Calcofluor White (dissolved in 10 mM NaOH) and mounted on a glass slide with coverslip. Cells from colonies on solid media after 2 days growth were washed in PBS, resuspended in 100 µl PBS, and stained as above.
Cells were observed under UV fluorescence and photographed using a ColorView II camera mounted on a Zeiss AxioImager M1 fluorescent microscope using axiovision software.
Gene deletions
Gene disruption cassettes were generated using fusion PCR (Figure S2). Approximately 1000 bp upstream from the start codon of YlUPC2 and YlSRE1 were amplified from Y. lipolytica Po1d using primers UPC2_p1 and UPC2_p2uraa or SRE1_p1 and SRE1_p2_leua/SRE1_p2_uraa, and from downstream of the stop codon using primers UPC2_t1_urab and UPC2_t2 or SRE1_t1_leub/SRE1_t1_urab and SRE1_t2 (Table S4). The Y. lipolytica LEU2 and URA3 genes were amplified from plasmids JMP802 and JMP803 [84], [85] using primers LEU-A and LEU-B or URA-A and URA-B. Primers UPC2_p2uraa and SRE1_p2_leua have 20 bp complementary to URA-A and LEU-A respectively (highlighted in bold, Table S4). Primers UPC2_t1urab and SRE1_t1_leub have 20 bp complementary to URA-B and LEU-B respectively (marked in bold, Table S4).
To make the complete disruption construct, the flanking regions and marker sequences were combined in a fusion PCR reaction using Ex Taq (TaKaRa Bio Inc.) with primers UPC2_p1 and UPC2_t2 or SRE1_p1 and SRE1_t2. The PCR conditions were 2 min at 94°, then 5 cycles of 30 s at 94°, 30 s at 60°, and 1.5 min at 72°, followed by 25 cyces of 30 s at 94°, 30 s at 60°, 3 min at 72°, and a final extension of 5 min at 72°. All PCR products were purified using a Qiagen PCR purification kit following the manufacturer's protocol and were introduced into Y. lipolytica by chemical transformation [46].
UPC2 was replaced with URA3 in Y. lipolytica Po1d generating strain SMY1. The LEU2 marker was introduced into this background to make a prototrophic upc2 deletion (SMY2). Similarly, SRE1 was replaced with LEU2 in Y. lipolytica Po1d generating strain SMY3. The URA3 marker was introduced into this background to make a prototrophic sre1 deletion (SMY8). SRE1 was also replaced with LEU2 in Y. lipolytica JMY330 (URA3+) generating a second prototrophic Ylsre1 deletion strain, SMY5. To make the double deletion, URA3 was used to replace UPC2 in SMY3, generating the prototrophic strain SMY4. The LEU2 marker was introduced into JMY330 to make a prototrophic version of Y. lipolytica Po1d (JMY2900) which is used as the wild type strain in this study.
To reintroduce YlUPC2 and YlSRE1, regions from approximately 800 bp upstream of the start of the gene to the stop of the gene were amplified using primers URI_xhoI_F and URI_avrII_R or SRI_claI_F and SRI_bamHI_R. The forward primers introduce an XhoI (YlUPC2) or ClaI (YlSRE1) site and the reverse primers introduce AvrII or BamHI sites. Digested products were cloned into plasmid JMP804 (unpublished) which contains a hygromycin (Hygex) resistance marker . Transformation was targeted to the YlUPC2 or YlSRE1 promoters by digestion with either PshaI or PpmuI. The digested plasmids were introduced into SMY2 (Ylupc2Δ) or SMY5 (Ylsre1Δ) by chemical transformation [46] generating SMY6 (reconstituted YlUPC2) and SMY7 (reconstituted YlSRE1).
Sterol measurements
All strains were grown in CSM complete medium (0.17% yeast nitrogen base without amino acids (Difco), 0.5% ammonium sulfate, 2% glucose, and supplemented with CSM supplement mixture (Sunrise Science Products)) for 48 h. Cultures equivalent to 100 A600 units were spun down and washed once with 10 ml of sterile water. The pellets were resuspended in 1 ml of an alcoholic KOH solution (12.5 g KOH, 17.5 ml H2O and filled to 50 ml with EtOH) and incubated at 85°C for 1 hour in 2 ml microfuge tubes. Finally 0.5 ml of heptane was added and vortexed for 3 minutes. After separation of the phases, the upper heptane phase was transferred to a new tube. Heptane extracts were diluted with 100% EtOH in 1∶5 ratio and absorbance between 230 and 320 nm was measured [49]. Three peaks of 270, 280 and 295 were used for quantification (T-test, p-value<0.05 for the Ylupc2/wild type comparison). The experiment was performed using three biological replicates, and the average measurements are presented.
RNA-seq analysis
Cells were grown at 28°C overnight and then diluted to an A600 of 0.2, and grown until they reach an A600 of 1 at 28°C in YPD, in either 21% or 1% O2. Two to five biological replicates were used per sample (Table S5). Cells were harvested from 50 ml of culture by centrifugation, and either subjected to RNA extraction or frozen at −80°C. Total RNA was extracted from fresh or frozen cell pellets using a RiboPure Yeast Kit (Ambion). RNA concentrations were determined using a NanoDrop 1000 (Thermo Scientific), while quality and integrity was checked using a Bioanalyzer 2100 (Agilent Technologies). mRNA was prepared from total RNA using oligo dT Dynabeads (Invitrogen). 18 strand-specific libraries (Table S5) were generated by incorporation of dUTP as described in Guida et al [27], except that several samples were combined in one lane by multiplexing. One of 3 index adaptors (i6, i10 or i11, Table S4) was ligated to the samples to allow multiplexing. Adapters were ligated by mixing 25 µl of 2× Quick DNA Ligase Buffer (NEB), 1 µl (15 µM) of the specific adaptor mix, and 3 µl Quick T4 DNA Ligase with library samples. Ligations were carried out for 15 min at 20°C. The DNA was purified with a QIAquick PCR purification kit and MinElute column. The DNA was eluted with 10 µl EB.
Sequencing was carried out in-house on an Illumina Genome Analyzer IIx according to manufacturer's instructions, resulting in read lengths of approximately 42 bases. For four samples (Table S5) libraries were generated and sequenced by GATC using an Illumina HiSeq 2000. All data has been submitted to Gene Expression Omnibus and is available at accession number GSE47433.
Read mapping and expression analysis
Gene annotations were obtained from Génolevures and manually curated using RNAseq data by the Neuvéglise group. In-house reads were processed according to version 1.8 of Illumina's Genome Analysis Pipeline. Multiplexed samples were separated using a Perl script and quality was tested using FASTQC (http://www.bioinformatics.babraham.ac.uk/projects/fastqc/). Each sample dataset was aligned to the 6 Y. lipolytica chromosomes using TopHat [86]. Reads mapped to two or more locations were removed from analysis. Data were visualized using the Artemis genome browser [87]. Raw counts of reads mapped to genes were calculated using HT-Seq. These were used as input for differential gene expression analysis using DESeq, with a P-value cutoff of < = 0.05 and LogFC cut off of > = 1 [59].
Differentially expressed gene lists were analyzed using the online DAVID functional annotation tool [61] with the Y. lipolytica gene background and default settings (Classification Stringency: Medium). Gene Ontology (GO) FAT terms, KEGG Pathways, InterPro and Swiss-Prot databases were selected for functional annotation clustering. Hierarchical cluster analysis implemented in R was used to identify genes with shared and different expression patterns in the wild type, Ylsre1 deletion and Ylupc2 deletion when exposed to hypoxia. Genes that were differentially expressed in at least one comparison were clustered, using the log2 fold change values generated from DESeq analysis. Hierarchical cluster analysis implemented in R (http://www.R-project.org) was used to identify genes with shared and different expression patterns in the wild type, Ylsre1 deletion and Ylupc2 deletion when exposed to hypoxia. Genes that were differentially expressed in at least one comparison were included.
qRT-PCR
Overnight cultures grown at 28°C in YPD media were washed twice with PBS and diluted to an A600 of 0.2 in SC media in two flasks. Cultures were grown to an A600 of 1.0 at 28°C in normoxic conditions (21% oxygen) and one flask was moved to a hypoxic environment (1% oxygen) for 2 hours. The normoxic sample was resuspended in RNAlater (Ambion) and frozen at −80°C. Total RNA was extracted and cDNA was prepared as described previously [88]. qRT-PCR was carried out on an Agilent Technologies Stratagene Mx2005p system using Brilliant III Ultra-Fast SYBR Green QPCR Master Mix (600882) as per the manufacturer's instructions. Two technical replicates were used for each sample. Cycling conditions consisted of 1 cycle at 95°C for 3 min followed by 40 cycles of 95°C for 10 s and 60°C for 30 s. A final cycle of 95°C for 1 min was followed by melting curve analysis performed at 55°C to 95°C (temperature transition, 0.2°C/sec) with stepwise fluorescence detection. Primers used for analysis are listed in Table S4. Relative expression changes were identified using the ΔCT method, compared to the expression of ACT1.
Promoter motif analysis
The Upc2 binding site motif [89] was downloaded from the JASPAR database (http://jaspar.genereg.net/) [90] and used as input for tffind (http://globin.cse.psu.edu/dist/tffind/) to scan promoter regions from each genome (Table 2) using a cut off of 0.95 (95% confidence). A one-tailed Fisher exact test was performed to compare the enrichment among ergosterol pathway genes relative to the background group (rest of promoter regions in genome containing a motif). The number of binding sites per promoter was not considered. Fisher exact tests were calculated using the R Statistics package (http://www.r-project.org).
Phylogenetic analysis
SREBP-like proteins were retrieved from the NCBI protein database using BLASTP with human SREBPF1, Schizosaccharomyces pombe Sre1, and Cryptococcus neoformans CNJ02310 as queries. Only proteins containing the atypical Tyr residue were retained. Sequences were imported into SeaView [91] for downstream analyses. Sequences from orthologous clades were aligned using MUSCLE [92], after which these clades were profile-aligned with each other using ClustalW2 [93]. Phylogenetic trees were constructed from the bHLH region of the alignment with PhyML, using the LG substitution model with four rate classes. Similar methods were used to construct phylogenetic trees for Upc2 and Scap proteins.
Transmembrane helices were predicted using the TMHMM server (http://www.cbs.dtu.dk/services/TMHMM/) [94] and protein domains were predicted using Pfam [41].
Supporting Information
Zdroje
1. BakerCR, BoothLN, SorrellsTR, JohnsonAD (2012) Protein modularity, cooperative binding, and hybrid regulatory states underlie transcriptional network diversification. Cell 151 : 80–95.
2. TanayA, RegevA, ShamirR (2005) Conservation and evolvability in regulatory networks: the evolution of ribosomal regulation in yeast. Proc Natl Acad Sci U S A 102 : 7203–7208.
3. BakerCR, Hanson-SmithV, JohnsonAD (2013) Following gene duplication, paralog interference constrains transcriptional circuit evolution. Science 342 : 104–108.
4. WeirauchMT, HughesTR (2010) Dramatic changes in transcription factor binding over evolutionary time. Genome Biol 11 : 122.
5. ThompsonDA, RoyS, ChanM, StyczynskyMP, PfiffnerJ, et al. (2013) Evolutionary principles of modular gene regulation in yeasts. Elife 2: e00603.
6. TsongAE, TuchBB, LiH, JohnsonAD (2006) Evolution of alternative transcriptional circuits with identical logic. Nature 443 : 415–420.
7. MartchenkoM, LevitinA, HoguesH, NantelA, WhitewayM (2007) Transcriptional rewiring of fungal galactose-metabolism circuitry. Curr Biol 17 : 1007–1013.
8. HoguesH, LavoieH, SellamA, MangosM, RoemerT, et al. (2008) Transcription factor substitution during the evolution of fungal ribosome regulation. Mol Cell 29 : 552–562.
9. HabibN, WapinskiI, MargalitH, RegevA, FriedmanN (2012) A functional selection model explains evolutionary robustness despite plasticity in regulatory networks. Mol Syst Biol 8 : 619.
10. BienCM, EspenshadePJ (2010) Sterol regulatory element binding proteins in fungi: hypoxic transcription factors linked to pathogenesis. Eukaryot Cell 9 : 352–359.
11. ButlerG (2013) Hypoxia and gene expression in eukaryotic microbes. Ann Rev Microbiol 67 : 291–312.
12. ErnstJF, TielkerD (2008) Responses to hypoxia in fungal pathogens. Cell Microbiol 11 : 183–190.
13. HortonJD, GoldsteinJL, BrownMS (2002) SREBPs: activators of the complete program of cholesterol and fatty acid synthesis in the liver. J Clin Invest 109 : 1125–1131.
14. BrownAJ, SunL, FeramiscoJD, BrownMS, GoldsteinJL (2002) Cholesterol addition to ER membranes alters conformation of SCAP, the SREBP escort protein that regulates cholesterol metabolism. Mol Cell 10 : 237–245.
15. RadhakrishnanA, IkedaY, KwonHJ, BrownMS, GoldsteinJL (2007) Sterol-regulated transport of SREBPs from endoplasmic reticulum to Golgi: oxysterols block transport by binding to Insig. Proc Natl Acad Sci U S A 104 : 6511–6518.
16. EspenshadePJ, HughesAL (2007) Regulation of sterol synthesis in eukaryotes. Annu Rev Genet 41 : 401–427.
17. BurgJS, PowellDW, ChaiR, HughesAL, LinkAJ, et al. (2008) Insig regulates HMG-CoA reductase by controlling enzyme phosphorylation in fission yeast. Cell Metab 8 : 522–531.
18. ChangYC, IngavaleSS, BienC, EspenshadeP, Kwon-ChungKJ (2009) Conservation of the sterol regulatory element-binding protein pathway and its pathobiological importance in Cryptococcus neoformans. Eukaryot Cell 8 : 1770–1779.
19. ChunCD, LiuOW, MadhaniHD (2007) A link between virulence and homeostatic responses to hypoxia during infection by the human fungal pathogen Cryptococcus neoformans. PLoS Pathog 3: e22.
20. StewartEV, LloydSJ, BurgJS, NwosuCC, LintnerRE, et al. (2012) Yeast sterol regulatory element-binding protein (SREBP) cleavage requires Cdc48 and Dsc5, a ubiquitin regulatory X domain-containing subunit of the Golgi Dsc E3 ligase. J Biol Chem 287 : 672–681.
21. StewartEV, NwosuCC, TongZ, RoguevA, CumminsTD, et al. (2011) Yeast SREBP cleavage activation requires the Golgi Dsc E3 ligase complex. Mol Cell 42 : 160–171.
22. WillgerSD, CornishEJ, ChungD, FlemingBA, LehmannMM, et al. (2012) Dsc orthologs are required for hypoxia adaptation, triazole drug responses and fungal virulence in Aspergillus fumigatus. Eukaryot Cell 1557–1567.
23. HughesBT, EspenshadePJ (2008) Oxygen-regulated degradation of fission yeast SREBP by Ofd1, a prolyl hydroxylase family member. EMBO J 27 : 1491–1501.
24. LeeCY, StewartEV, HughesBT, EspenshadePJ (2009) Oxygen-dependent binding of Nro1 to the prolyl hydroxylase Ofd1 regulates SREBP degradation in yeast. EMBO J 28 : 135–143.
25. LeeCY, YehTL, HughesBT, EspenshadePJ (2011) Regulation of the Sre1 hypoxic transcription factor by oxygen-dependent control of DNA binding. Mol Cell 44 : 225–234.
26. LaneS, ZhouS, PanT, DaiQ, LiuH (2001) The basic helix-loop-helix transcription factor Cph2 regulates hyphal development in Candida albicans partly via TEC1. Mol Cell Biol 21 : 6418–6428.
27. GuidaA, LindstadtC, MaguireSL, DingC, HigginsDG, et al. (2011) Using RNA-seq to determine the transcriptional landscape and the hypoxic response of the pathogenic yeast Candida parapsilosis. BMC Genomics 12 : 628.
28. HootSJ, OliverBG, WhiteTC (2008) Candida albicans UPC2 is transcriptionally induced in response to antifungal drugs and anaerobicity through Upc2p-dependent and -independent mechanisms. Microbiology 154 : 2748–2756.
29. SynnottJM, GuidaA, Mulhern-HaugheyS, HigginsDG, ButlerG (2010) Regulation of the hypoxic response in Candida albicans. Eukaryot Cell 9 : 1734–1746.
30. VikA, RineJ (2001) Upc2p and Ecm22p, dual regulators of sterol biosynthesis in Saccharomyces cerevisiae. Mol Cell Biol 21 : 6395–6405.
31. ZavrelM, HootSJ, WhiteTC (2013) Comparison of sterol import under aerobic and anaerobic conditions in three fungal species: Candida albicans, Candida glabrata and Saccharomyces cerevisiae. Eukaryot Cell 12 : 725–38.
32. SantosMA, TuiteMF (1995) The CUG codon is decoded in vivo as serine and not leucine in Candida albicans. Nucleic Acids Res 23 : 1481–1486.
33. FitzpatrickDA, LogueME, StajichJE, ButlerG (2006) A fungal phylogeny based on 42 complete genomes derived from supertree and combined gene analysis. BMC Evol Biol 6 : 99.
34. NicaudJM (2012) Yarrowia lipolytica. Yeast 29 : 409–418.
35. ParragaA, BellsolellL, Ferre-D'AmareAR, BurleySK (1998) Co-crystal structure of sterol regulatory element binding protein 1a at 2.3 A resolution. Structure 6 : 661–672.
36. KimJB, SpottsGD, HalvorsenYD, ShihHM, EllenbergerT, et al. (1995) Dual DNA binding specificity of ADD1/SREBP1 controlled by a single amino acid in the basic helix-loop-helix domain. Mol Cell Biol 15 : 2582–2588.
37. NishiK, ParkCS, PepperAE, EichingerG, InnisMA, et al. (1995) The GCR1 requirement for yeast glycolytic gene expression is suppressed by dominant mutations in the SGC1 gene, which encodes a novel basic-helix-loop-helix protein. Mol Cell Biol 15 : 2646–2653.
38. SatoT, LopezMC, SugiokaS, JigamiY, BakerHV, et al. (1999) The E-box DNA binding protein Sgc1p suppresses the gcr2 mutation, which is involved in transcriptional activation of glycolytic genes in Saccharomyces cerevisiae. FEBS Lett 463 : 307–311.
39. AskewC, SellamA, EppE, HoguesH, MullickA, et al. (2009) Transcriptional regulation of carbohydrate metabolism in the human pathogen Candida albicans. PLoS Pathog 5: e1000612.
40. BonhommeJ, ChauvelM, GoyardS, RouxP, RossignolT, et al. (2011) Contribution of the glycolytic flux and hypoxia adaptation to efficient biofilm formation by Candida albicans. Mol Microbiol 80 : 995–1013.
41. PuntaM, CoggillPC, EberhardtRY, MistryJ, TateJ, et al. (2012) The Pfam protein families database. Nucleic Acids Res 40: D290–301.
42. WolfeKH, ShieldsDC (1997) Molecular evidence for an ancient duplication of the entire yeast genome. Nature 387 : 708–713.
43. HughesAL, ToddBL, EspenshadePJ (2005) SREBP pathway responds to sterols and functions as an oxygen sensor in fission yeast. Cell 120 : 831–842.
44. Barth G, Gaillardin C (1996) Yarrowia lipolytica. In: Wolf K, editor. Nonconventional yeasts in biotechnology A handbook. Berlin, Germany: Springer-Verlag. pp. 313–388.
45. NobleSM, JohnsonAD (2005) Strains and strategies for large-scale gene deletion studies of the diploid human fungal pathogen Candida albicans. Eukaryot Cell 4 : 298–309.
46. Le DallMT, NicaudJM, GaillardinC (1994) Multiple-copy integration in the yeast Yarrowia lipolytica. Curr Genet 26 : 38–44.
47. AkacheB, TurcotteB (2002) New regulators of drug sensitivity in the family of yeast zinc cluster proteins. J Biol Chem 277 : 21254–21260.
48. MacPhersonS, AkacheB, WeberS, De DekenX, RaymondM, et al. (2005) Candida albicans zinc cluster protein Upc2p confers resistance to antifungal drugs and is an activator of ergosterol biosynthetic genes. Antimicrob Agents Chemother 49 : 1745–1752.
49. SilverPM, OliverBG, WhiteTC (2004) Role of Candida albicans transcription factor Upc2p in drug resistance and sterol metabolism. Eukaryot Cell 3 : 1391–1397.
50. WillgerSD, PuttikamonkulS, KimKH, BurrittJB, GrahlN, et al. (2008) A sterol-regulatory element binding protein is required for cell polarity, hypoxia adaptation, azole drug resistance, and virulence in Aspergillus fumigatus. PLoS Pathog 4: e1000200.
51. BlatzerM, BarkerBM, WillgerSD, BeckmannN, BlosserSJ, et al. (2011) SREBP coordinates iron and ergosterol homeostasis to mediate triazole drug and hypoxia responses in the human fungal pathogen Aspergillus fumigatus. PLoS Genet 7: e1002374.
52. BarthG, GaillardinC (1997) Physiology and genetics of the dimorphic fungus Yarrowia lipolytica. FEMS Microbiol Rev 19 : 219–237.
53. SudberyP, GowN, BermanJ (2004) The distinct morphogenic states of Candida albicans. Trends Microbiol 12 : 317–324.
54. WendlandJ, WaltherA (2005) Ashbya gossypii: a model for fungal developmental biology. Nat Rev Microbiol 3 : 421–429.
55. Morales-VargasAT, DominguezA, Ruiz-HerreraJ (2012) Identification of dimorphism-involved genes of Yarrowia lipolytica by means of microarray analysis. Res Microbiol 163 : 378–387.
56. Perez-CampoFM, DominguezA (2001) Factors affecting the morphogenetic switch in Yarrowia lipolytica. Curr Microbiol 43 : 429–433.
57. Ruiz-HerreraJ, SentandreuR (2002) Different effectors of dimorphism in Yarrowia lipolytica. Arch Microbiol 178 : 477–483.
58. Torres-GuzmanJC, DominguezA (1997) HOY1, a homeo gene required for hyphal formation in Yarrowia lipolytica. Mol Cell Biol 17 : 6283–6293.
59. AndersS, HuberW (2010) Differential expression analysis for sequence count data. Genome Biol 11: R106.
60. LaiLC, KosorukoffAL, BurkePV, KwastKE (2006) Metabolic-state-dependent remodeling of the transcriptome in response to anoxia and subsequent reoxygenation in Saccharomyces cerevisiae. Eukaryot Cell 5 : 1468–1489.
61. Huang daW, ShermanBT, LempickiRA (2009) Systematic and integrative analysis of large gene lists using DAVID bioinformatics resources. Nat Protoc 4 : 44–57.
62. MorinM, MonteolivaL, InsenserM, GilC, DominguezA (2007) Proteomic analysis reveals metabolic changes during yeast to hypha transition in Yarrowia lipolytica. J Mass Spec 42 : 1453–1462.
63. BrauerMJ, HuttenhowerC, AiroldiEM, RosensteinR, MateseJC, et al. (2008) Coordination of growth rate, cell cycle, stress response, and metabolic activity in yeast. Mol Biol Cell 19 : 352–367.
64. SeegmillerAC, DobrosotskayaI, GoldsteinJL, HoYK, BrownMS, et al. (2002) The SREBP pathway in Drosophila: regulation by palmitate, not sterols. Dev Cell 2 : 229–238.
65. ToddBL, StewartEV, BurgJS, HughesAL, EspenshadePJ (2006) Sterol regulatory element binding protein is a principal regulator of anaerobic gene expression in fission yeast. Mol Cell Biol 26 : 2817–2831.
66. RaychaudhuriS, YoungBP, EspenshadePJ, LoewenCJr (2012) Regulation of lipid metabolism: a tale of two yeasts. Curr Opin Cell Biol 24 : 502–508.
67. NagiM, NakayamaH, TanabeK, BardM, AoyamaT, et al. (2011) Transcription factors CgUPC2A and CgUPC2B regulate ergosterol biosynthetic genes in Candida glabrata. Genes Cells 16 : 80–89.
68. ZnaidiS, WeberS, Al-AbdinOZ, BommeP, SaidaneS, et al. (2008) Genomewide location analysis of Candida albicans Upc2p, a regulator of sterol metabolism and azole drug resistance. Eukaryot Cell 7 : 836–847.
69. WilcoxLJ, BalderesDA, WhartonB, TinkelenbergAH, RaoG, et al. (2002) Transcriptional profiling identifies two members of the ATP-binding cassette transporter superfamily required for sterol uptake in yeast. J Biol Chem 277 : 32466–32472.
70. NakayamaH, TanabeK, BardM, HodgsonW, WuS, et al. (2007) The Candida glabrata putative sterol transporter gene CgAUS1 protects cells against azoles in the presence of serum. The Journal of antimicrobial chemotherapy 60 : 1264–1272.
71. KohutP, WustnerD, HronskaL, KuchlerK, HapalaI, et al. (2011) The role of ABC proteins Aus1p and Pdr11p in the uptake of external sterols in yeast: dehydroergosterol fluorescence study. Biochem Biophys Res Commun 404 : 233–238.
72. BourotS, KarstF (1995) Isolation and characterization of the Saccharomyces cerevisiae SUT1 gene involved in sterol uptake. Gene 165 : 97–102.
73. KwastKE, LaiLC, MendaN, JamesDT3rd, ArefS, et al. (2002) Genomic analyses of anaerobically induced genes in Saccharomyces cerevisiae: functional roles of Rox1 and other factors in mediating the anoxic response. J Bacteriol 184 : 250–265.
74. BarkerBM, KrollK, VodischM, MazurieA, KniemeyerO, et al. (2012) Transcriptomic and proteomic analyses of the Aspergillus fumigatus hypoxia response using an oxygen-controlled fermenter. BMC Genomics 13 : 62.
75. BonaccorsiED, FerreiraAJ, ChambergoFS, RamosAS, MantovaniMC, et al. (2006) Transcriptional response of the obligatory aerobe Trichoderma reesei to hypoxia and transient anoxia: implications for energy production and survival in the absence of oxygen. Biochemistry (Mosc) 45 : 3912–3924.
76. LorenzMC, HeitmanJ (1998) Regulators of pseudohyphal differentiation in Saccharomyces cerevisiae identified through multicopy suppressor analysis in ammonium permease mutant strains. Genetics 150 : 1443–1457.
77. LiuH (2001) Transcriptional control of dimorphism in Candida albicans. Curr Opin Microbiol 4 : 728–735.
78. LaneS, BirseC, ZhouS, MatsonR, LiuH (2001) DNA array studies demonstrate convergent regulation of virulence factors by Cph1, Cph2, and Efg1 in Candida albicans. J Biol Chem 276 : 48988–48996.
79. RichardM, QuijanoRR, BezzateS, Bordon-PallierF, GaillardinC (2001) Tagging morphogenetic genes by insertional mutagenesis in the yeast Yarrowia lipolytica. J Bacteriol 183 : 3098–3107.
80. Cervantes-ChavezJA, KronbergF, PasseronS, Ruiz-HerreraJ (2009) Regulatory role of the PKA pathway in dimorphism and mating in Yarrowia lipolytica. Fungal Genet Biol 46 : 390–399.
81. Cervantes-ChavezJA, Ruiz-HerreraJ (2007) The regulatory subunit of protein kinase A promotes hyphal growth and plays an essential role in Yarrowia lipolytica. FEMS Yeast Res 7 : 929–940.
82. Cervantes-ChavezJA, Ruiz-HerreraJ (2006) STE11 disruption reveals the central role of a MAPK pathway in dimorphism and mating in Yarrowia lipolytica. FEMS Yeast Res 6 : 801–815.
83. ZhaoXF, LiM, LiYQ, ChenXD, GaoXD (2013) The TEA/ATTS transcription factor YlTec1p represses the yeast-to-hypha transition in the dimorphic yeast Yarrowia lipolytica. FEMS Yeast Res 13 : 50–61.
84. NicaudJM, MadzakC, van den BroekP, GyslerC, DubocP, et al. (2002) Protein expression and secretion in the yeast Yarrowia lipolytica. FEMS Yeast Res 2 : 371–379.
85. HaddoucheR, PoirierY, DelessertS, SabirovaJ, PagotY, et al. (2011) Engineering polyhydroxyalkanoate content and monomer composition in the oleaginous yeast Yarrowia lipolytica by modifying the ss-oxidation multifunctional protein. Appl Microbiol Biotechnol 91 : 1327–1340.
86. TrapnellC, PachterL, SalzbergSL (2009) TopHat: discovering splice junctions with RNA-Seq. Bioinformatics 25 : 1105–1111.
87. RutherfordK, ParkhillJ, CrookJ, HorsnellT, RiceP, et al. (2000) Artemis: sequence visualization and annotation. Bioinformatics 16 : 944–945.
88. ConnollyLA, RiccombeniA, GrozerZ, HollandLM, LynchDB, et al. (2013) The APSES transcription factor Efg1 is a global regulator that controls morphogenesis and biofilm formation in Candida parapsilosis. Mol Microbiol 90 : 36–53.
89. BadisG, ChanET, van BakelH, Pena-CastilloL, TilloD, et al. (2008) A library of yeast transcription factor motifs reveals a widespread function for Rsc3 in targeting nucleosome exclusion at promoters. Mol Cell 32 : 878–887.
90. Portales-CasamarE, ThongjueaS, KwonAT, ArenillasD, ZhaoX, et al. (2010) JASPAR 2010: the greatly expanded open-access database of transcription factor binding profiles. Nucleic Acids Res 38: D105–110.
91. GouyM, GuindonS, GascuelO (2010) SeaView version 4: A multiplatform graphical user interface for sequence alignment and phylogenetic tree building. Mol Biol Evol 27 : 221–224.
92. EdgarRC (2004) MUSCLE: a multiple sequence alignment method with reduced time and space complexity. BMC Bioinformatics 5 : 113.
93. ThompsonJD, GibsonTJ, HigginsDG (2002) Multiple sequence alignment using ClustalW and ClustalX. Curr Protoc Bioinformatics Chapter 2 Unit 2 3.
94. KroghA, LarssonB, von HeijneG, SonnhammerEL (2001) Predicting transmembrane protein topology with a hidden Markov model: application to complete genomes. J Mol Biol 305 : 567–580.
95. MaguireSL, OheigeartaighSS, ByrneKP, SchroderMS, O'GaoraP, et al. (2013) Comparative genome analysis and gene finding in Candida species using CGOB. Mol Biol Evol 30 : 1281–1291.
Štítky
Genetika Reprodukční medicínaČlánek vyšel v časopise
PLOS Genetics
2014 Číslo 1
Nejčtenější v tomto čísle
- GATA6 Is a Crucial Regulator of Shh in the Limb Bud
- Large Inverted Duplications in the Human Genome Form via a Fold-Back Mechanism
- Differential Effects of Collagen Prolyl 3-Hydroxylation on Skeletal Tissues
- Affects Plant Architecture by Regulating Local Auxin Biosynthesis