
Divergent Effects of Human Cytomegalovirus and Herpes Simplex Virus-1 on Cellular Metabolism
Viruses rely on the metabolic network of the host cell to provide energy and macromolecular precursors to fuel viral replication. Here we used mass spectrometry to examine the impact of two related herpesviruses, human cytomegalovirus (HCMV) and herpes simplex virus type-1 (HSV-1), on the metabolism of fibroblast and epithelial host cells. Each virus triggered strong metabolic changes that were conserved across different host cell types. The metabolic effects of the two viruses were, however, largely distinct. HCMV but not HSV-1 increased glycolytic flux. HCMV profoundly increased TCA compound levels and flow of two carbon units required for TCA cycle turning and fatty acid synthesis. HSV-1 increased anapleurotic influx to the TCA cycle through pyruvate carboxylase, feeding pyrimidine biosynthesis. Thus, these two related herpesviruses drive diverse host cells to execute distinct, virus-specific metabolic programs. Current drugs target nucleotide metabolism for treatment of both viruses. Although our results confirm that this is a robust target for HSV-1, therapeutic interventions at other points in metabolism might prove more effective for treatment of HCMV.
Published in the journal:
. PLoS Pathog 7(7): e32767. doi:10.1371/journal.ppat.1002124
Category:
Research Article
doi:
https://doi.org/10.1371/journal.ppat.1002124
Summary
Viruses rely on the metabolic network of the host cell to provide energy and macromolecular precursors to fuel viral replication. Here we used mass spectrometry to examine the impact of two related herpesviruses, human cytomegalovirus (HCMV) and herpes simplex virus type-1 (HSV-1), on the metabolism of fibroblast and epithelial host cells. Each virus triggered strong metabolic changes that were conserved across different host cell types. The metabolic effects of the two viruses were, however, largely distinct. HCMV but not HSV-1 increased glycolytic flux. HCMV profoundly increased TCA compound levels and flow of two carbon units required for TCA cycle turning and fatty acid synthesis. HSV-1 increased anapleurotic influx to the TCA cycle through pyruvate carboxylase, feeding pyrimidine biosynthesis. Thus, these two related herpesviruses drive diverse host cells to execute distinct, virus-specific metabolic programs. Current drugs target nucleotide metabolism for treatment of both viruses. Although our results confirm that this is a robust target for HSV-1, therapeutic interventions at other points in metabolism might prove more effective for treatment of HCMV.
Introduction
Herpesviruses are large, enveloped, double-stranded DNA viruses, capable of both lytic infection and life-long latency in mammalian hosts [1]. They are major causes of human disease. A majority of adults are infected with herpes simplex virus 1 (HSV-1) and/or human cytomegalovirus (HCMV). An alpha-herpesvirus, HSV-1 infects a wide range of organisms and cells types, causing symptoms ranging from cold sores to encephalitis. The prototypical beta-herpesvirus, HCMV, selectively infects non-transformed human cells. Although frequently asymptomatic, HCMV causes severe disease in neonates and immunocompromised adults. All herpesviruses encode metabolic enzymes in their genomes, primarily ones involved in nucleotide metabolism. The HSV-1 genome encodes a viral thymidine kinase, ribonucleotide reductase, dUTPase and uracil DNA glycosylase, while HCMV encodes a functional form of uracil DNA glycosylase [2]. Like all viruses, however, they rely primarily on the metabolic capabilities of their cellular hosts for replication. Specifically, the host provides the energy, amino acids and lipids, as well as most nucleotides, required by the virus.
Improved technologies for measuring both enzymes and metabolites is enabling for the first time in-depth analysis of virus-host cell metabolic interactions. Liquid chromatography coupled to mass spectrometry (LC-MS) facilitates direct measurement of a large number of cellular metabolites [3], [4]. Combined with isotope tracers, metabolic flows (fluxes) can also be determined. These new tools have revealed that, rather than passively relying on basal host cell metabolic activity, many viruses actively redirect host cell metabolism [5], [6], [7]. For example, hepatitis C virus up-regulates host cell glycolysis and modulates concentrations of specific lipids [8]. Similarly, hepatitis B virus replication perturbs cholesterol metabolism by inducing increased 7-dehydrocholesterol levels [9].
Among herpes viruses, the metabolic effects of HCMV have been the most extensively studied. Infection of a human fibroblast cell line with HCMV leads to two-fold increases in glycolytic activity and nucleotide synthesis, as well as yet greater increases in citric acid cycle flux and lipid biosynthesis [10]. Consistent with HCMV's reliance on the metabolic fluxes that it induces, inhibition of the committed step of fatty acid synthesis and elongation, acetyl-CoA carboxylase, blocks HCMV replication [10]. The virus also induces an increased dependence on glutamine that serves to drive the TCA cycle [10], [11]. These metabolic changes are only partially accounted for by increased levels of enzyme transcripts, indicating the involvement of multiple regulatory mechanisms [6].
A limitation of studies of virus-host metabolic interactions to date is that they have focused on single virus-host cell pairs. Moreover, they have often employed transformed host cells that differ markedly from the cells usually infected in vivo. This has precluded understanding whether the observed metabolic effects of viruses are relevant in their natural host cells, preserved across host cell types, and conserved within families of related viruses. To address these issues, here we compare and contrast the metabolic effects of HCMV and HSV-1, across both fibroblast and epithelial host cells. Specifically, we studied the laboratory-adapted AD-169 strain of HCMV, which is restricted to growth in fibroblasts, and whose metabolic effects have been previously studied [6], [10]. In addition, we examined the epitheliotropic clinical isolate strain TB40/E, which grows in many cell types, to study the infection of epithelial cells [12]. For HSV-1 infections, we chose the highly-passaged, non-neuroinvasive KOS 1.1 strain and a prototypical neuroinvasive strain, the F strain [13], [14]. Both primary human foreskin fibroblasts and the MRC5 fibroblast cell line were analyzed after infection by both viruses. HSV-1 infection was also studied in the Vero African green monkey renal epithelial cell line which is traditionally used for its growth. Given HCMV's propensity to cause retinitis [15], it was studied in the ARPE-19 retinal pigment epithelial cell line.
Using LC-MS to probe core metabolite concentrations and fluxes, we find that HCMV and HSV-1 both trigger major metabolic changes in their cellular hosts, and that these changes are similar across different host cell types and for different strains of the same virus. In contrast, the effects of HCMV and HSV-1 diverge markedly. HCMV most greatly impacts pathways generating substrates for lipid metabolism, whereas HSV-1 most greatly impacts deoxypyrimidine metabolism.
Results
HCMV and HSV-1 trigger distinct metabolome changes
We examined the metabolic changes triggered by infection of fibroblast and epithelial host cells with HCMV and HSV-1. Fibroblasts (HFF and MRC5) were held at confluence for 3–5 days then serum-starved for 24 hours prior to infection, while epithelial cells (ARPE19 and Vero) were infected at 80–90% confluence and maintained in the presence of dialyzed serum at all times. As a consequence the fibroblast host cells were growth arrested at the time of infection, while the epithelial cells continued to replicate after mock inoculation [16]. Consistent with their different growth states, there were substantial differences in the metabolome of the host cells prior to infection, with compounds directly involved in proliferative processes such as carbamoyl-aspartate (pyrimidine biosynthesis), dTTP (DNA synthesis), and S-methyl-5′-thioadenosine (polyamine synthesis) markedly higher in the growing epithelial cells than the quiescent fibroblasts (Figure S1). Other compounds, such as those involved in mitochondrial fatty acid oxidation (carnitine and acetyl-carnitine), were higher in growth arrested fibroblasts compared to growing epithelial cells.
Infections were performed at a multiplicity of 3 pfu/cell to ensure near complete exposure of the cell population. Cultures infected with one of the virus strains, or treated with a virus-free mock inoculum, were grown in parallel and sampled at regular time intervals from the beginning of infection until peak virus yields were achieved. Medium was changed every 24 h to ensure a consistent nutrient supply to the cells; lack of media changes in earlier work [6] resulted in some different metabolite patterns from those observed here. In particular, we find that citrate and malate levels increase >10-fold during HCMV infection, compared to the 2-fold change seen in previously published work [6]. Maximum virus output was reached at around 24 h post infection (hpi) in HSV-1 infected cells, and around 96 hpi HCMV infected cells (Figure S2).
Over 80 metabolites were identified and detected in all experiments. Relative concentrations of these species, between infected and mock-infected cells, are shown in Figure 1 (for blue/yellow version of the heat map, see Figure S3; for source data, see Table S1). A third of the compounds were measured by both high resolution mass spectrometry (orbitrap) and triple quadrupole mass spectrometry (QQQ). The profile of any single metabolite detected in multiple LC-MS methods was found to be similar, as indicated by co-clustering of the associated data in almost all cases (Figure 1).

Both viruses triggered >4-fold changes in the levels of roughly half of the metabolites assayed. Among the metabolites changing markedly, those increasing outnumbered those decreasing roughly two-to-one. Although the magnitude of the changes in compound levels depended on the host cell, typically being smaller in the growing epithelial cells, the majority of the trends were host cell invariant. This is remarkable given the differing initial growth and metabolic states of the host cells, and it indicates a robust ability of the viruses to re-program metabolism.
Extracting major trends from the dataset by singular value decomposition [17] resulted in two characteristic vectors that accounted for >10% of the information in the dataset (Figure S4A). These vectors represent prototypical metabolite response patterns. The first vector accounts for 16% of the variation in metabolite levels over the time courses. In this vector, the signal as a function of time shows a similar trend in each of the time courses, thus representing a generic metabolite concentration response to herpesvirus infection (Figure S4B). The smaller signal in the first and last columns corresponding to the infections of epithelial cells reflects the smaller fold-changes in metabolite levels induced by viral infection in the growing epithelial cells compared to growth arrested fibroblasts. The strongest contributor to the generic infection response is dTTP, whose upregulation is consistent with the shared need of both viruses to replicate their DNA. The second vector, accounting for 12% of the variation in the dataset, represents a virus-specific response with opposing patterns for the HCMV and HSV-1 infection time courses (Figure S4B). Key contributors to this virus-specific response include TCA cycle intermediates, consistent with their rise during HCMV but not HSV-1 infection, and the nucleotides dUMP and dTMP, consistent with their rise during HSV-1 but not HCMV infection.
The third most significant vector, which accounts for 6% of the information in the dataset, represents a metabolic response characteristic of Vero cells (Figure S4B). While most of the changes proved to be host cell-independent, the third vector draws attention to the impact of different host cell types on the metabolic effects of viruses. The strongest contributors to this vector are citrate/isocitrate and N-carbamoyl-L-aspartate, due to their depletion in infected Vero cells in contrast to their accumulation in all other cell types. The remaining characteristic vectors account for the other 66% of the information. This large amount of residual information reflects a myriad of metabolite, virus, and cell-type specific dynamics. For example, proline and glycine-betaine showed cell type-specific upward or downward trends. Other metabolites, such as dTTP, showed different dynamic response patterns across different host cell types.
In all cell types tested, HCMV infection induced phosphoenolpyruvate, deoxypyrimidine triphosphates, CDP-choline, and acetylated amino acids, as well as a striking and coordinated increase in citrate, malate and other TCA cycle intermediates (Figure 1). Depleted compounds included glycerophosphoinositol, taurine, and a number of pentose phosphate pathway metabolites. On the other hand, HSV-1 triggered increased levels of pentose phosphate pathway intermediates, as well as glycolytic intermediates, and deoxypyrimidines (Figure 1). Notably depleted compounds included glycine betaine, taurine, creatine, and NAD+. The conserved decrease in the osmolyte, taurine, in both HCMV and HSV-1 likely reflects a host cell response to virus-induced increases in cell volume [18]. Glycolysis, the citric acid cycle, and pyrimidine biosynthesis are discussed in greater detail below.
Glycolytic flux during HCMV and HSV-1 infection
Glycolysis and the TCA cycle form the backbone of central carbon metabolism in mammalian cells. Through these two pathways glucose is either oxidized to produce energy in the form of NADH and ATP, or converted to precursors of amino acids, lipids and nucleotides. The levels of glycolytic intermediates are altered in a strikingly different manner during HCMV and HSV-1 infections (Figure 2A). The concentrations of metabolites in lower glycolysis increase during HCMV infection, while levels of upper glycolytic intermediates drop. Conversely, in response to HSV-1 infection the opposite occurs. While these concentration measurements are informative, it is not possible to deduce whether changes in influx, efflux or a combination of both are responsible for the perturbations of the metabolite levels. Neither the turnover rate of a metabolic intermediate, nor the material flow through a pathway, can be predicted based on metabolite pool sizes alone. To understand how material flow, i.e., flux, is altered, further assays must be employed.

In cultured mammalian cells, the enzyme-catalyzed reactions of glycolysis convert the bulk of glucose imported from the extracellular environment to lactate, which gets excreted. Thus, changes in the rate of material flow through glycolysis can be approximated by measuring the rate of glucose consumption and lactate production. We determined the glucose uptake and lactate excretion rates in infected and mock treated HFFs by directly measuring the amount of glucose and lactate in the extracellular medium over time (Figure 2B). HCMV increased the uptake of glucose (p = 0.02) and the excretion of lactate (p = 0.0006), in agreement with previously published results on HCMV-infected fibroblasts [10], [19], [20] (Figure 2B). On the contrary, in HSV-1 infected cells the glucose uptake (p = 0.21) and lactate excretion (p = 0.002) rates decreased to a modest extent.
In addition to glucose from the medium, glycolysis can also be fueled by glucose acquired from the breakdown of stored glycogen. Moreover, decreased lactate production can reflect increased glycolytic efflux to the TCA cycle, rather than decreased glycolytic flux. To confirm our conclusions based on the glucose and lactate measurements, we also measured the rate of incorporation of isotope-labeled nutrients into downstream metabolites. Following a switch to labeled media, metabolite pools become progressively more labeled, with the unlabeled fraction exhibiting an exponential-type decay. Flux through a metabolite is the product of the rate of this decay and the total pool size of the metabolite [21]. To reliably estimate this decay rate, it is important to obtain samples at early time points where the fractional labeling is changing rapidly. Because label from glucose gets incorporated very quickly into glycolytic intermediates, measurements at later time points are likely to reflect steady-state labeling fractions, not labeling rates per se. At steady state, the amount of labeled metabolite reflects the total metabolite pool size and the fraction of its production from the labeled substrate, but not the rate of labeling.
To characterize glycolytic flux, we switched HCMV and HSV-1 infected cells, as well as their mock-treated counterparts, to 13C-labeled glucose containing media, and used LC-MS to monitor the labeled forms of downstream metabolites over time. HCMV infection increased the fractional labeling rate of glycolytic intermediates fructose-1,6-bisphosphate and dihydroxyacetone phosphate, while HSV-1 decreased it (Figure 2C). The decrease in the rate of HSV-1 labeling was complemented by a corresponding increase in metabolite concentration. Thus, we can conclude that HCMV significantly increases flux through glycolysis and HSV-1 does not.
Interestingly, in HSV-1-infected cells the metabolites upstream of phosphoenolpyruvate build up, while the ones downstream drop (Figure 2A). This suggests a bottleneck in glycolytic efflux at the step catalyzed by pyruvate kinase, the enzyme that converts phosphoenolpyruvate and ADP to pyruvate and ATP. The buildup of glycolytic metabolites upstream of pyruvate is accompanied by increased levels of pentose phosphate pathway intermediates, thus increasing the availability of ribose-phosphate for the synthesis of nucleotides. During hepatitis C infection the levels of most glycolytic enzymes were shown to be elevated, with the notable exception of pyruvate kinase [8]. Such changes in enzyme levels may lead to a similar metabolic outcome as observed in HSV-1 infected cells. However, as the activity of glycolytic flow is under tight allosteric control [22], direct metabolic analysis of hepatitis C is warranted to confirm this.
TCA cycle influx during HCMV and HSV-1 infection
The metabolites of the TCA cycle showed a particularly interesting difference in labeling patterns when HCMV - and HSV-1-infected fibroblasts were supplied with uniformly labeled 13C - glucose. In the uninfected, growth arrested fibroblasts, citrate was only minimally labeled over a 2 h time period (Figure 3D, top panel). On the other hand, HCMV-infected fibroblasts produced a significant amount of citrate with two labeled carbon atoms (13C2-citrate) (Figure 3D, center panel), while their HSV-1-infected counterparts generated citrate with three labeled carbons (13C3-citrate) (Figure 3D, bottom panel). These two forms of citrate are produced by different pathways, which are selectively up-regulated in a virus-specific manner.

Labeled carbon atoms derived from 13C-glucose can enter the TCA cycle via two routes (Figure 3A). In one, pyruvate dehydrogenase and citrate synthase incorporate two carbons from glucose into citrate via acetyl-CoA (Figure 3B). The labeling pattern of citrate during HCMV infection indicates increased influx of glycolytic carbon to the TCA cycle via this route (Figure 3D). This pathway indicates a catalytic use of the TCA cycle, with the two-carbon units originating from glycolysis either oxidized to produce energy by complete turning of the TCA cycle, or diverted from the mitochondria to the cytosol through the citrate shuttle, where the acetyl group is freed for fatty acid synthesis and/or elongation. Global flux analysis on HCMV infection showed that both of these uses of glycolytic carbon are up-regulated by HCMV in MRC5 cells [10]. Our results indicate that HCMV infection of HFFs leads to the same up-regulation.
Carbon from glycolysis can also enter the TCA cycle via pyruvate carboxylase, which converts pyruvate to oxaloacetate (Figure 3C). All three labeled carbons in pyruvate are retained in oxaloacetate, which is converted to 13C3-citrate, malate, or aspartate. The labeled forms of TCA cycle intermediates observed in HSV-1-infected cells indicate an up-regulation of carbon influx via pyruvate carboxylase as reflected by the labeling of citrate (Figure 3D, right panel) and malate (Figure S5) when cells are supplied with 13C6-glucose. Furthermore, no citrate is detected with two or five labeled carbons in these cells. Thus, unlike in HCMV-infected cells, the use of glucose to drive the citrate shuttle and ensuing fatty acid synthesis is minimal during HSV-1 infection. The previous metabolic analysis of HCMV infection led to the recognition of a potential new drug target by showing that de novo fatty acid biosynthesis is essential for HCMV replication [10]. Pharmacological inhibitors of enzymes in fatty acid biosynthesis were shown to inhibit not only HCMV replication, but also the replication of influenza, an evolutionarily divergent virus [10]. De novo fatty acid biosynthesis does not appear to bear the same importance for the replication of HSV-1 as for HCMV (Figure 3D). This is reflected in the lower sensitivity of HSV-1 replication to 5-tetradecyloxy-2-furoic acid (TOFA) (Figure S6) [10], an inhibitor of acetyl-CoA carboxylase, the first committed enzyme of fatty acid biosynthesis.
Pyrimidine biosynthesis during HSV-1 infection
The reaction catalyzed by pyruvate carboxylase is an anaplerotic reaction that serves to replenish the intermediates of the TCA cycle as they are removed for biosynthetic purposes. However, in spite of its up-regulation during HSV-1 infection, after an initial elevation, the levels of TCA cycle intermediates drop (Figure 4). This indicates that HSV-1 triggers an even greater increase in TCA cycle efflux. Notably, the concentration of aspartate, which is produced from oxaloacetate, decreases significantly after infection with HSV-1. In addition to being used for protein synthesis, aspartate is a substrate for pyrimidine nucleotide biosynthesis.

Unlike in HCMV infection, in response to HSV-1 infection the rates of total RNA and total protein syntheses drop [23], [24]. At the same time, viral DNA synthesis increases the demand for deoxyribonucleotides. The nucleotide precursors essential for DNA synthesis can be acquired through salvage reactions or de novo synthesis [25], [26]. When replicating in quiescent cells as opposed to actively dividing ones, viruses face a greater challenge in acquiring nucleotides for viral DNA replication, because the de novo nucleotide biosynthesis pathways are less active [27]. HSV-1 encodes a set of enzymes addressing this problem and their impact is reflected in increased concentrations of the intermediates of the pyrimidine nucleotide biosynthesis pathway (Figure 5). HCMV employs an alternative mechanism whereby the host cell is driven from quiescence to the G1/S boundary of the cell cycle [28], stimulating host cell nucleotide biosynthesis but preventing host DNA replication. Interestingly, in HSV-1 infected serum-starved fibroblasts dTTP levels are not observed to peak and drop after 6 hpi as reported in Vero cells (Figure 1) [26], and BHK cells [29]. In growth arrested fibroblasts the dTTP pool continues to rise throughout the infection (Figure 5). Such a trend was previously observed in mutant BHK cells that lack thymidine kinase and deoxycytidine kinase activities [29]. Confluent, serum-starved fibroblasts may present a similar cellular environment, with very low basal activity of DNA-biosynthetic enzymes.

Uracil can occur in DNA as a result of cytosine deamination or misincorporation of dUTP [30]. The UL50 and UL2 genes of HSV-1 encode enzymes that address these problems. The viral dUTPase (UL50) serves to reduce incorporation of uracil into viral DNA by decreasing dUTP levels and producing dUMP. Uracil-DNA glycosylase (UL2) participates in base excision repair of the HSV-1 genome, removing uracil from viral DNA [31], [32]. These two viral enzymes are likely responsible for the increased dUMP and uracil levels during HSV-1 infection (Figure 5).
While there is no known HSV-1 gene that causes the increased production of carbamoyl-aspartate, evidence for the regulation of aspartate transcarbamoylase during adenovirus infections has been presented in the past [33], [34]. Furthermore, carbamoyl-aspartate levels are observed to rise dramatically in both HCMV and HSV-1 infections (Figure 1) [10]. Carbamoyl-aspartate is produced by the multifunctional CAD protein, which catalyzes the first three steps of de novo pyrimidine biosynthesis in mammalian cells. CAD is highly regulated by growth state-related signaling molecules, such as the epidermal growth factor [35], [36]. Epidermal growth factor receptor has been shown to play a role in the entry of several different viruses, and it or related signaling pathways might contribute to virally-induced increases in carbamoyl-aspartate levels [37], [38], [39].
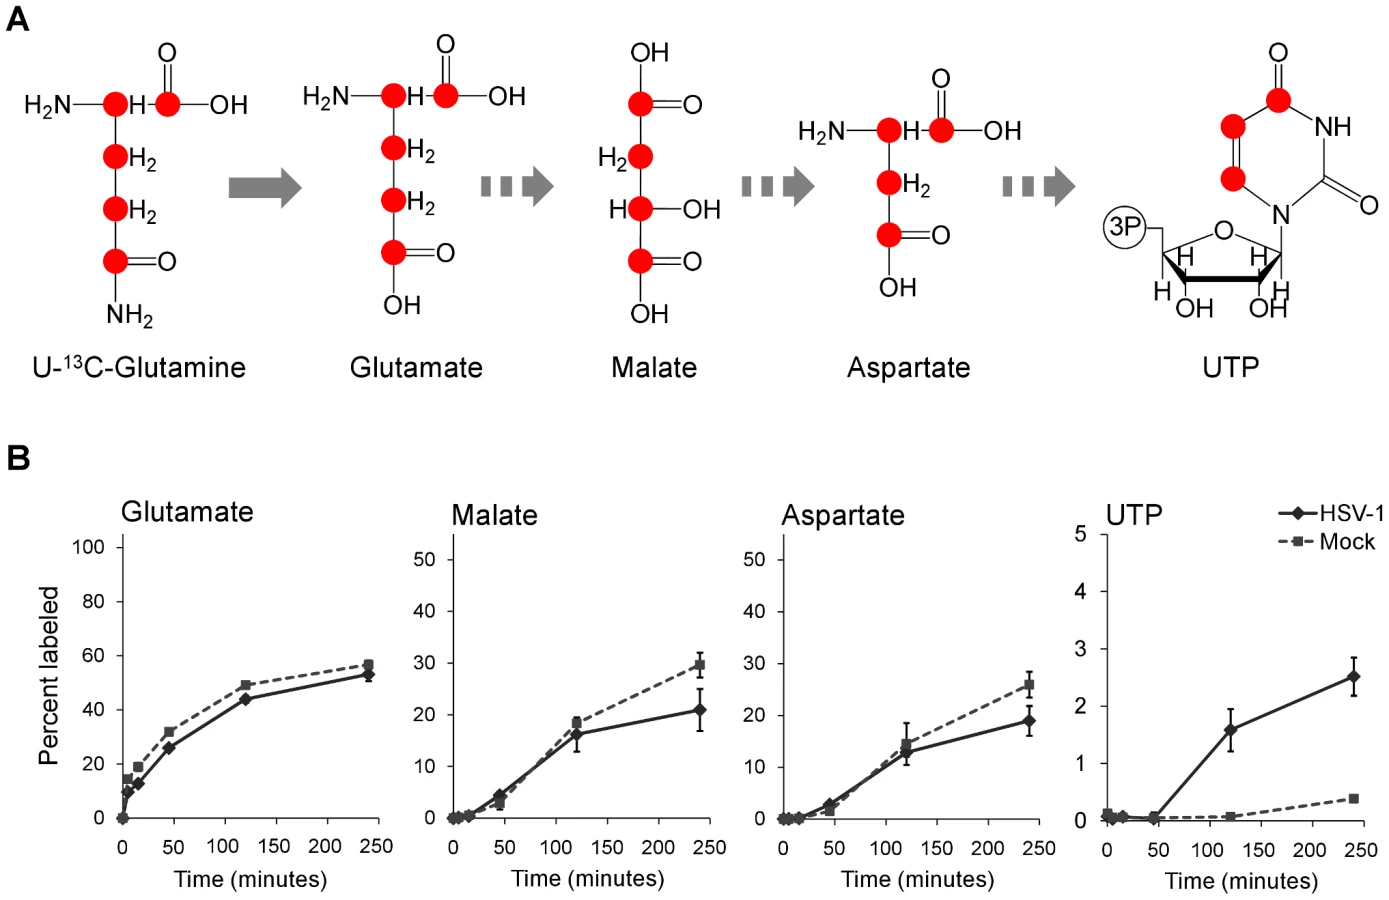
To confirm that flux from aspartate to pyrimidine nucleotides is up-regulated in HSV-1 infection, we analyzed the labeling pattern of the pathway intermediates after switching cells to medium containing uniformly labeled 13C-glutamine (Figure 6A). As glutamine contributes to anapleurosis in both mock and infected cells, this resulted in labeling of aspartate in both cases, and thus enabled direct comparison of pyrimidine synthesis between these two conditions. Significantly faster labeling of the pyrimidine end-product UTP was observed in infected cells (Figure 6B). As the concentration of UTP is also elevated in HSV-1 infected cells, flux from aspartate to nucleotide synthesis is markedly increased.
Taken together, the above observations indicate an upregulation of flux in HSV-1 infected cells from glucose to de novo pyrimidine nucleotide biosynthesis via the pyruvate carboxylase-catalyzed anaplerotic and the aspartate transaminase 2 catalyzed cataplerotic reactions of the TCA cycle (Figure 7A). In agreement with this, small interfering RNA (siRNA) mediated knockdown of pyruvate carboxylase and aspartate transaminase 2 inhibit HSV-1 replication, but not HCMV (Figure 7B–D).

Discussion
Viral replication depends on the energy and biosynthetic precursors supplied by host cell metabolism. Using a mass spectrometry-based metabolomic approach we demonstrate that two closely related viruses, HCMV and HSV-1, implement divergent metabolic programs (Figure 1 and Table S1). These programs are robust to host cell type and virus strain. While HCMV enhances glycolytic flux and the delivery of carbon from glucose to the TCA cycle to fuel fatty acid biosynthesis, HSV-1 gears central carbon metabolism toward the production of pyrimidine nucleotide components (Figure 8). The focus of HSV-1, but not HCMV, on nucleotide metabolism is interesting in light of nucleoside analogues (acyclovir and ganciclovir, respectively) being more effective treatments for HSV-1 than for HCMV [40]. Both compounds depend on phosphorylation by viral kinases for their activation, and the metabolic profile of HSV-1 infected cells reflects the activity of the virally encoded thymidine kinase. On the other hand, the only functional HCMV kinase (UL97) is a protein kinase and has little to no nucleotide kinase activity [41]. This difference is reflected in the metabolome and in the lower efficacy of the nucleoside analogues for HCMV. In contrast, we show that TOFA, an inhibitor of the committed step of fatty acid synthesis and elongation, preferentially targets HCMV over HSV-1 (Figure S6).

The viruses also induce robust changes outside of core metabolism. For example, HCMV, but not HSV-1, induces a striking increase in acetylated amino acids (Figure 1). After HSV-1 infection, NAD+ levels dropped by a factor of about 10, but little decline was evident after HCMV infection. We have recently discovered that this NAD+ depletion is due to elevated poly-ADP-ribose polymerase activity (L. Vastag, unpublished work). The activation of poly-ADP-ribose polymerase has also been observed in HIV-1 and Sindbis Virus infected cells [42], [43], [44]. Understanding the significance of such observations requires further study.
Why do these two related viruses induce markedly different changes in host cell metabolism? Both must synthesize viral proteins and nucleic acids and both produce enveloped virions. Perhaps the difference results in part from the markedly different speeds at which the two viruses progress through their replication cycles. HSV-1 produced maximal yields in fibroblasts or epithelial cells within about 24 h, whereas HCMV did not achieve maximal yields until about 96 hpi (Figure S2). One might speculate, then, that HSV-1, which accumulates its DNA fairly rapidly, must elevate nucleotide biosynthesis; in contrast, HCMV, which accumulates its DNA over a much longer time frame, does not require such a strong induction (Figure 1). It is more difficult to suggest why HCMV depends on de novo fatty acid biosynthesis more strongly than HSV-1 (Figure S6). It is conceivable that HCMV induces the production of new membranes to serve as a source for the virion envelope, while HSV-1 virions are built from pre-existing membranes. Consistent with this view, HCMV-infected cells develop a well-defined, membranous assembly compartment during the late phase of infection [45], [46], [47], but no equivalent structure has been described within HSV-1-infected cells.
The metabolic program induced by herpes viruses could be implemented in several ways. One potential strategy involves perturbation of general host biochemical milieu. For example, the HCMV UL37x1 protein elevates free intracellular calcium levels [48], which could potentially activate glycolysis through the action of calcium-sensitive kinases [19]. Alternatively, virus-coded gene products could modify or interact with pivotal regulators of host cell metabolism, e.g., the HCMV UL38 protein [49], or with metabolic enzymes themselves to alter their activity. Yet other strategies could involve modulation of host cell enzyme concentrations through mechanisms involving transcription, translation, or protein stability. A comprehensive systems level analysis, incorporating transcriptomic [50], [51], [52], [53], proteomic [8], and metabolic data should help clarify the relative significance of these latter mechanisms.
In addition to elucidating the mechanisms underlying host cell metabolic hijacking, an important priority is defining the metabolic programs of other viruses. Among herpes viruses, it will be interesting to see whether most fit either the HSV-1 or HCMV prototype, or whether alternative programs exist. For smaller viruses, it will be interesting to see whether their yet more precious genome space includes instructions for extensive host cell metabolic reprogramming. Such work holds substantial practical value, given overarching importance of enzyme inhibitors as antivirals and the utility of metabolomics for identifying new antiviral targets.
Materials and Methods
Cells and viruses
Primary human foreskin fibroblasts (HFFs) were collected previously [54] and stored in liquid nitrogen. We used them at passages 8–13. ARPE19 human retinal pigment epithelial cells, Vero green monkey kidney epithelial cells and MRC5 human embryonic lung fibroblasts were purchased from the American Type Culture Collection. Cells were grown in Dulbecco's modified Eagle Medium (DMEM) with 10% fetal bovine serum, 100 µg/mL penicillin and streptomycin (Invitrogen), and 4.5 g/L glucose. HSV-1 strain F [55] was kindly provided by B. Roizman (University of Chicago), the HSV-1 KOS 1.1 strain [56] was a gift from D. Hargett (Princeton University), and both viruses were grown in Vero cells [57]. BADwt-GFP is a phenotypically wild-type HCMV laboratory strain that was generated from a bacterial artificial chromosome (BAC) clone of strain AD169 [58] engineered to express green fluorescent protein [59]. TB40/E-eGFP is a phenotypically wild-type HCMV clinical isolate that was derived from a bacterial artificial chromosome termed TB40-BAC4 [60] containing a green fluorescent protein marker gene under control of the SV40 promoter between US34 and TRS1. HCMV strains were grown in MRC-5 cells. To prepare virus stocks for both HSV-1 and HCMV, the media of infected cells was layered over a sorbitol cushion (20% sorbitol, 50 mM Tris-HCl, pH 7.2, 1 mM MgCl2) and virus was pelleted by centrifugation (20,000 rpm, 1 h, 4°C, Beckman SW28 rotor). Virus stocks were prepared in DMEM with 0.5% bovine serum albumin and without fetal bovine serum, to avoid serum stimulation of the growth arrested fibroblasts during inoculation.
For analysis of metabolites, fibroblasts (HFFs or MRC5) were grown to confluence and maintained in the presence of serum for 5 d. Cells were then washed with serum-free DMEM and maintained in serum-free DMEM for 24 h before infection or mock treatment. Epithelial cells (ARPE19 or Vero) were grown to 80–90% confluence in DMEM with 10% dialyzed serum (Gemini Bio-Products) before infection. At the time of infection cells were inoculated with virus resuspended in DMEM with or without serum. Mock treated cells were inoculated with equivalent, virus-free DMEM. After a 1 h inoculation fresh DMEM was added to the cells, following two washes with the appropriate medium. For each time point in every experiment an additional mock treated and infected plate was processed for packed cell volume measurement. Approximately 5×10⁵ cells were added to packed cell volume tubes (Techno Plastic Products), which were centrifuged at 2000×g for 5 min before reading [61]. Packed cell volume measurements were used to normalize the metabolite levels between samples.
Metabolite extraction
At various times post infection or addition of 13C-labeled glucose - or glutamine-containing DMEM, the media of infected and mock cells was aspirated and −80°C, 80∶20 methanol∶water (v/v) was immediately added to quench metabolism. There were no washing steps prior to metabolism quenching, as such steps risk metabolic alterations. Metabolites were then extracted as described previously [21]. The extract was dried under nitrogen and metabolites were resuspended in HPLC-grade water and centrifuged at 15000×g speed for 5 min to remove particulate matter before analysis. To minimize complications due to excessive sample concentration and associated ion suppression during LC-MS analysis, samples were diluted substantially prior to analysis: metabolites collected from 106 cells (a confluent 60 mm plate of fibroblasts) were resuspended in 500 µL water.
Liquid chromatography – mass spectrometry
To quantitatively measure the levels of metabolites in extracts prepared from infected or mock treated cultured mammalian cells, two different mass spectrometry methods were employed. Liquid chromatography-tandem mass spectrometry (LC-MS/MS) in selective reaction monitoring (SRM) mode was used to assay for ∼200 metabolites of confirmed identity from a wide range of metabolic pathways [62]. A Finnigan TWQ Quantum Ultra mass spectrometer was used in the positive ionization mode, and a TSQ Quantum Discovery MAX mass spectrometer in the negative mode, each equipped with an electrospray ionization source (Thermo Fisher Scientific). The SRMs were constructed with parameters acquired through optimizing the collision induced fragmentation of purified standards of the given metabolites. The LC method in positive mode employed an aminopropyl column for separation [62], while in negative mode the metabolite extracts were passed through a C18 column using tributylamine as an ion pairing agent to achieve longer retention of polar compounds [63], [64]. In addition, the LC-MS/MS method was complemented with untargeted analysis using liquid chromatography coupled to a stand-alone orbitrap mass spectrometer (Thermo Fisher Scientific Exactive instrument) which performs full scans from 85 to 1000 m/z at 100,000 mass resolution [65]. In this system, identification of compounds is based on two parameters: the retention time on the LC column and the compound mass measured with less than 2 ppm mass accuracy. Peaks were identified and peak heights exported with the Metabolomic Analysis and Visualization Engine (MAVEN) [66].
Glucose uptake and lactate excretion
For glucose uptake and lactate excretion measurements, media samples were collected every 3 h between 45 and 57 hpi for HCMV, and every 2 h between 6 and 18 hpi for HSV-1. The concentrations of lactate and glucose were measured using a YSI 7100 Select Biochemistry Analyzer (YSI Incorporated). Uptake and excretion rates were determined as the rate of concentration change of these compounds in the media. The values were corrected using the packed cell volume of the infected and mock cells.
Metabolic flux analysis
For experiments involving monitoring the rate of incorporation of 13C-labeled nutrient into downstream metabolites, cells were switched to fresh media 1 h before addition of the labeled nutrient. This minimized the perturbation to the cells when their medium was replaced with isotope containing medium. Cells were then maintained in medium containing the labeled nutrient for different lengths of time. Metabolites were extracted and various isotopically labeled forms quantified by mass spectrometry. The values were corrected for the natural abundance of 13C as described previously [10]. Labeled DMEM was prepared from glucose and glutamine-free DMEM with the addition of U-13C-glucose or U-13C-glutamine (Cambridge Isotope Laboratories). All media were equilibrated to the incubator temperature and gas composition before use.
siRNA transfection
Double stranded siRNA molecules directed against pyruvate carboxylase (5′-GACUGUACGCGGCCUUCGATT), aspartate transaminase 2 (5′-CUAUUGAGAGCUUCACACATT), and a Universal Negative Control (SIC001) were purchased from Sigma. Subconfluent MRC5 cells seeded into 96-well plates were transfected with 10 pmol of siRNA using Oligofectamine transfection reagent (Invitrogen) according to the manufacturer's instructions. For HCMV experiments, the siRNA transfected cells were incubated for 24 hours and then infected with HCMV strain BADwt-GFP at a multiplicity of 0.1 pfu/cell. The cells were further incubated for 96 hours and media containing the infectious virus were harvested. Since HSV-1 replicates with a faster kinetics than HCMV, the transfected cells were incubated for 3 days to allow efficient knockdown of target gene. The cells were then infected with HSV-1 strain F at a multiplicity of 0.02 pfu/cell and media were harvested 24 hours after infection. The yield of HCMV and HSV in the media was determined by infectious focus assay. Briefly, fresh MRC5 cells were infected with different dilutions of viruses and fixed 24 hours after HCMV or 4 hours after HSV-1 infection with methanol at −20°C. Foci were identified using mouse monoclonal primary antibodies to HCMV immediate early IE1 protein (1B12) [54] or HSV-1 immediate early ICP4 protein [67] and a goat anti-mouse Alexa Fluor 488-conjugated secondary antibody (Invitrogen).
Western blot analysis
MRC5 cells were seeded into 6-well dishes and transfected at 70% confluence as described above. HFF cells were grown to confluence, serum starved for 24 hours and infected at 3 pfu/cell with HSV-1 (F strain). At selected times post transfection of MRC5 cells and infection of HFFs, cells were washed with phosphate-buffered saline (PBS), harvested and stored at −80°C. Cells were lysed in RIPA-light buffer (50 mM Tris-HCl, pH 8.0, 1% NP-40, 0.1% SDS, 150 mM NaCl, 0.1% Triton X-100, 5 mM EDTA) with protease inhibitors (Roche Applied Science), and protein concentrations were determined by Bradford assay. Proteins were separated by 10% SDS-containing polyacrylamide gel electrophoresis and transferred to nitrocellulose membranes. Membranes were probed with a primary rabbit polyclonal antibody directed against pyruvate carboxylase (NBP1-49536, Novus) at a dilution of 1∶1000 in PBS-T and 1% nonfat milk. After washing with PBS-T, membranes were probed with goat anti-rabbit HRP-coupled secondary antibodies diluted 1∶5000 in PBS-T containing 1% milk. Proteins were visualized by chemiluminescence using the ECL detection system (Amersham).
Tests of statistical significance
All p-values were calculated by two-tailed, non-paired T-test.
Accession numbers
Pyruvate carboxylase (PC): P11498, aspartate transaminase 2 (GOT2): P00505, carbamoyl-phosphate synthetase 2, aspartate transcarbamylase, and dihydroorotase (CAD): P27708, HSV-1 dUTPase (UL50): P10234, HSV-1 uracil-DNA glycosylase (UL2): P10186, HSV-1 thymidine kinase (UL23): P03176.
Supporting Information
Zdroje
1. RoizmanBCarmichaelLEDeinhardtFde-TheGNahmiasAJ 1981 Herpesviridae. Definition, provisional nomenclature, and taxonomy. The Herpesvirus Study Group, the International Committee on Taxonomy of Viruses. Intervirology 16 201 217
2. Ranneberg-NilsenTDaleHALunaLSlettebakkRSundheimO 2008 Characterization of human cytomegalovirus uracil DNA glycosylase (UL114) and its interaction with polymerase processivity factor (UL44). J Mol Biol 381 276 288
3. FiehnO 2002 Metabolomics–the link between genotypes and phenotypes. Plant Mol Biol 48 155 171
4. WantEJCravattBFSiuzdakG 2005 The expanding role of mass spectrometry in metabolite profiling and characterization. Chembiochem 6 1941 1951
5. RitterJBWahlASFreundSGenzelYReichlU 2010 Metabolic effects of influenza virus infection in cultured animal cells: Intra - and extracellular metabolite profiling. BMC Syst Biol 4 61
6. MungerJBajadSUCollerHAShenkTRabinowitzJD 2006 Dynamics of the cellular metabolome during human cytomegalovirus infection. PLoS Pathog 2 e132
7. BirungiGChenSMLoyBPNgMLLiSF 2010 Metabolomics approach for investigation of effects of dengue virus infection using the EA.hy926 cell line. J Proteome Res 9 6523 6534
8. DiamondDLSyderAJJacobsJMSorensenCMWaltersKA 2010 Temporal proteome and lipidome profiles reveal hepatitis C virus-associated reprogramming of hepatocellular metabolism and bioenergetics. PLoS Pathog 6 e1000719
9. RodgersMASaghatelianAYangPL 2009 Identification of an overabundant cholesterol precursor in hepatitis B virus replicating cells by untargeted lipid metabolite profiling. J Am Chem Soc 131 5030 5031
10. MungerJBennettBDParikhAFengXJMcArdleJ 2008 Systems-level metabolic flux profiling identifies fatty acid synthesis as a target for antiviral therapy. Nat Biotechnol 26 1179 1186
11. ChambersJWMaguireTGAlwineJC 2010 Glutamine metabolism is essential for human cytomegalovirus infection. J Virol 84 1867 1873
12. WangDShenkT 2005 Human cytomegalovirus UL131 open reading frame is required for epithelial cell tropism. J Virol 79 10330 10338
13. MitchellBMStevensJG 1996 Neuroinvasive properties of herpes simplex virus type 1 glycoprotein variants are controlled by the immune response. J Immunol 156 246 255
14. SedaratiFStevensJG 1987 Biological basis for virulence of three strains of herpes simplex virus type 1. J Gen Virol 68 2389 2395
15. ScholzMDoerrHWCinatlJ 2003 Human cytomegalovirus retinitis: pathogenicity, immune evasion and persistence. Trends Microbiol 11 171 178
16. DavisPKHoADowdySF 2001 Biological methods for cell-cycle synchronization of mammalian cells. Biotechniques 30 1322 1326 13281330–1321
17. AlterOBrownPOBotsteinD 2000 Singular value decomposition for genome-wide expression data processing and modeling. Proc Natl Acad Sci U S A 97 10101 10106
18. HoffmannEKLambertIHPedersenSF 2009 Physiology of cell volume regulation in vertebrates. Physiol Rev 89 193 277
19. McArdleJSchaferXLMungerJ 2011 Inhibition of calmodulin-dependent kinase kinase blocks human cytomegalovirus-induced glycolytic activation and severely attenuates production of viral progeny. J Virol 85 705 714
20. YuYMaguireTGAlwineJC 2011 Human cytomegalovirus activates glucose transporter 4 expression to increase glucose uptake during infection. J Virol 85 1573 1580
21. YuanJBennettBDRabinowitzJD 2008 Kinetic flux profiling for quantitation of cellular metabolic fluxes. Nat Protoc 3 1328 1340
22. KempRGFoeLG 1983 Allosteric regulatory properties of muscle phosphofructokinase. Mol Cell Biochem 57 147 154
23. RoizmanBBormanGSRoustaMK 1965 Macromolecular synthesis in cells infected with herpes simplex virus. Nature 206 1374 1375
24. GarnettHM 1979 The early effects of human cytomegalovirus infection on macromolecular synthesis in human embryonic fibroblasts. Brief report. Arch Virol 60 147 151
25. NutterLMGrillSPChengYC 1985 The sources of thymidine nucleotides for virus DNA synthesis in herpes simplex virus type 2-infected cells. J Biol Chem 260 13272 13275
26. DaikokuTYamamotoNMaenoKNishiyamaY 1991 Role of viral ribonucleotide reductase in the increase of dTTP pool size in herpes simplex virus-infected Vero cells. J Gen Virol 72 1441 1444
27. RampazzoCFabrisSFranzolinECrovattoKFranginiM 2007 Mitochondrial thymidine kinase and the enzymatic network regulating thymidine triphosphate pools in cultured human cells. J Biol Chem 282 34758 34769
28. WiebuschLUeckerRHagemeierC 2003 Human cytomegalovirus prevents replication licensing by inhibiting MCM loading onto chromatin. EMBO Rep 4 42 46
29. JamiesonATBjursellG 1976 Deoxyribonucleoside triphosphate pools in herpes simplex type 1 infected cells. J Gen Virol 31 101 113
30. ChenRWangHManskyLM 2002 Roles of uracil-DNA glycosylase and dUTPase in virus replication. J Gen Virol 83 2339 2345
31. BoganiFChuaCNBoehmerPE 2009 Reconstitution of uracil DNA glycosylase-initiated base excision repair in herpes simplex virus-1. J Biol Chem 284 16784 16790
32. BoganiFCorredeiraIFernandezVSattlerURutvisuttinuntW 2010 Association between the herpes simplex virus-1 DNA polymerase and uracil DNA glycosylase. J Biol Chem 285 27664 27672
33. ConsigliRAGinsbergHS 1964 Control of aspartate transcarbamylase activity in type 5 adenovirus-infected HeLa cells. J Bacteriol 87 1027 1033
34. ConsigliRAGinsbergHS 1964 Activity of aspartate transcarbamylase in uninfected and type 5 adenovirus-infected HeLa cells. J Bacteriol 87 1034 1043
35. GravesLMGuyHIKozlowskiPHuangMLazarowskiE 2000 Regulation of carbamoyl phosphate synthetase by MAP kinase. Nature 403 328 332
36. SigoillotFDEvansDRGuyHI 2002 Growth-dependent regulation of mammalian pyrimidine biosynthesis by the protein kinase A and MAPK signaling cascades. J Biol Chem 277 15745 15751
37. EierhoffTHrinciusERRescherULudwigSEhrhardtC 2010 The epidermal growth factor receptor (EGFR) promotes uptake of influenza A viruses (IAV) into host cells. PLoS Pathog 6 e1001099
38. WangXHuongSMChiuMLRaab-TraubNHuangES 2003 Epidermal growth factor receptor is a cellular receptor for human cytomegalovirus. Nature 424 456 461
39. IsaacsonMKFeireALComptonT 2007 Epidermal growth factor receptor is not required for human cytomegalovirus entry or signaling. J Virol 81 6241 6247
40. TalaricoCLBurnetteTCMillerWHSmithSLDavisMG 1999 Acyclovir is phosphorylated by the human cytomegalovirus UL97 protein. Antimicrob Agents Chemother 43 1941 1946
41. CrumpackerCS 1996 Ganciclovir. N Engl J Med 335 721 729
42. MurrayMFNghiemMSrinivasanA 1995 HIV infection decreases intracellular nicotinamide adenine dinucleotide [NAD]. Biochem Biophys Res Commun 212 126 131
43. HaHCJuluriKZhouYLeungSHermankovaM 2001 Poly(ADP-ribose) polymerase-1 is required for efficient HIV-1 integration. Proc Natl Acad Sci U S A 98 3364 3368
44. Nargi-AizenmanJLSimbulan-RosenthalCMKellyTASmulsonMEGriffinDE 2002 Rapid activation of poly(ADP-ribose) polymerase contributes to Sindbis virus and staurosporine-induced apoptotic cell death. Virology 293 164 171
45. SanchezVGreisKDSztulEBrittWJ 2000 Accumulation of virion tegument and envelope proteins in a stable cytoplasmic compartment during human cytomegalovirus replication: characterization of a potential site of virus assembly. J Virol 74 975 986
46. DasSVasanjiAPellettPE 2007 Three-dimensional structure of the human cytomegalovirus cytoplasmic virion assembly complex includes a reoriented secretory apparatus. J Virol 81 11861 11869
47. WomackAShenkT 2010 Human Cytomegalovirus Tegument Protein pUL71 Is Required for Efficient Virion Egress. MBio 1 e00282 10
48. Sharon-FrilingRGoodhouseJColberg-PoleyAMShenkT 2006 Human cytomegalovirus pUL37x1 induces the release of endoplasmic reticulum calcium stores. Proc Natl Acad Sci U S A 103 19117 19122
49. MoormanNJCristeaIMTerhuneSSRoutMPChaitBT 2008 Human cytomegalovirus protein UL38 inhibits host cell stress responses by antagonizing the tuberous sclerosis protein complex. Cell Host Microbe 3 253 262
50. TaddeoBEsclatineARoizmanB 2002 The patterns of accumulation of cellular RNAs in cells infected with a wild-type and a mutant herpes simplex virus 1 lacking the virion host shutoff gene. Proc Natl Acad Sci U S A 99 17031 17036
51. AguilarJSDevi-RaoGVRiceMKSunabeJGhazalP 2006 Quantitative comparison of the HSV-1 and HSV-2 transcriptomes using DNA microarray analysis. Virology 348 233 241
52. ZhuHCongJPMamtoraGGingerasTShenkT 1998 Cellular gene expression altered by human cytomegalovirus: global monitoring with oligonucleotide arrays. Proc Natl Acad Sci U S A 95 14470 14475
53. BrowneEPWingBColemanDShenkT 2001 Altered cellular mRNA levels in human cytomegalovirus-infected fibroblasts: viral block to the accumulation of antiviral mRNAs. J Virol 75 12319 12330
54. ZhuHShenYShenkT 1995 Human cytomegalovirus IE1 and IE2 proteins block apoptosis. J Virol 69 7960 7970
55. EjercitoPMKieffEDRoizmanB 1968 Characterization of herpes simplex virus strains differing in their effects on social behaviour of infected cells. J Gen Virol 2 357 364
56. SmithKO 1964 Relationship between the Envelope and the Infectivity of Herpes Simplex Virus. Proc Soc Exp Biol Med 115 814 816
57. Sandri-GoldinRMLevineMGloriosoJC 1981 Method for induction of mutations in physically defined regions of the herpes simplex virus genome. J Virol 38 41 49
58. YuDSmithGAEnquistLWShenkT 2002 Construction of a self-excisable bacterial artificial chromosome containing the human cytomegalovirus genome and mutagenesis of the diploid TRL/IRL13 gene. J Virol 76 2316 2328
59. WangDBresnahanWShenkT 2004 Human cytomegalovirus encodes a highly specific RANTES decoy receptor. Proc Natl Acad Sci U S A 101 16642 16647
60. SinzgerCHahnGDigelMKatonaRSampaioKL 2008 Cloning and sequencing of a highly productive, endotheliotropic virus strain derived from human cytomegalovirus TB40/E. J Gen Virol 89 359 368
61. StettlerMJaccardNHackerDDe JesusMWurmFM 2006 New disposable tubes for rapid and precise biomass assessment for suspension cultures of mammalian cells. Biotechnol Bioeng 95 1228 1233
62. LuWKimballERabinowitzJD 2006 A high-performance liquid chromatography-tandem mass spectrometry method for quantitation of nitrogen-containing intracellular metabolites. J Am Soc Mass Spectrom 17 37 50
63. LuoBGroenkeKTakorsRWandreyCOldigesM 2007 Simultaneous determination of multiple intracellular metabolites in glycolysis, pentose phosphate pathway and tricarboxylic acid cycle by liquid chromatography-mass spectrometry. J Chromatogr A 1147 153 164
64. LuWBennettBDRabinowitzJD 2008 Analytical strategies for LC-MS-based targeted metabolomics. J Chromatogr B Analyt Technol Biomed Life Sci 871 236 242
65. LuWClasquinMFMelamudEAmador-NoguezDCaudyAA 2010 Metabolomic analysis via reversed-phase ion-pairing liquid chromatography coupled to a stand alone orbitrap mass spectrometer. Anal Chem 82 3212 3221
66. MelamudEVastagLRabinowitzJD 2010 Metabolomic analysis and visualization engine for LC-MS data. Anal Chem 82 9818 9826
67. ShowalterSDZweigMHamparB 1981 Monoclonal antibodies to herpes simplex virus type 1 proteins, including the immediate-early protein ICP 4. Infect Immun 34 684 692
Štítky
Hygiena a epidemiologie Infekční lékařství LaboratořČlánek vyšel v časopise
PLOS Pathogens
2011 Číslo 7
- Farmakovigilanční studie perorálních antivirotik indikovaných v léčbě COVID-19
- Jak souvisí postcovidový syndrom s poškozením mozku?
- Měli bychom postcovidový syndrom léčit antidepresivy?
- 10 bodů k očkování proti COVID-19: stanovisko České společnosti alergologie a klinické imunologie ČLS JEP
Nejčtenější v tomto čísle
- Requires Glycerol for Maximum Fitness During The Tick Phase of the Enzootic Cycle
- Comparative Genomics Yields Insights into Niche Adaptation of Plant Vascular Wilt Pathogens
- The Role of IL-15 Deficiency in the Pathogenesis of Virus-Induced Asthma Exacerbations
- “Persisters”: Survival at the Cellular Level