
Electron Tomography of HIV-1 Infection in Gut-Associated Lymphoid Tissue
Critical aspects of HIV-1 infection occur in mucosal tissues, particularly in the gut, which contains large numbers of HIV-1 target cells that are depleted early in infection. We used electron tomography (ET) to image HIV-1 in gut-associated lymphoid tissue (GALT) of HIV-1–infected humanized mice, the first three-dimensional ultrastructural examination of HIV-1 infection in vivo. Human immune cells were successfully engrafted in the mice, and following infection with HIV-1, human T cells were reduced in GALT. Virions were found by ET at all stages of egress, including budding immature virions and free mature and immature viruses. Immuno-electron microscopy verified the virions were HIV-1 and showed CD4 sequestration in the endoplasmic reticulum of infected cells. Observation of HIV-1 in infected GALT tissue revealed that most HIV-1–infected cells, identified by immunolabeling and/or the presence of budding virions, were localized to intestinal crypts with pools of free virions concentrated in spaces between cells. Fewer infected cells were found in mucosal regions and the lamina propria. The preservation quality of reconstructed tissue volumes allowed details of budding virions, including structures interpreted as host-encoded scission machinery, to be resolved. Although HIV-1 virions released from infected cultured cells have been described as exclusively mature, we found pools of both immature and mature free virions within infected tissue. The pools could be classified as containing either mostly mature or mostly immature particles, and analyses of their proximities to the cell of origin supported a model of semi-synchronous waves of virion release. In addition to HIV-1 transmission by pools of free virus, we found evidence of transmission via virological synapses. Three-dimensional EM imaging of an active infection within tissue revealed important differences between cultured cell and tissue infection models and furthered the ultrastructural understanding of HIV-1 transmission within lymphoid tissue.
Published in the journal:
. PLoS Pathog 10(1): e32767. doi:10.1371/journal.ppat.1003899
Category:
Research Article
doi:
https://doi.org/10.1371/journal.ppat.1003899
Summary
Critical aspects of HIV-1 infection occur in mucosal tissues, particularly in the gut, which contains large numbers of HIV-1 target cells that are depleted early in infection. We used electron tomography (ET) to image HIV-1 in gut-associated lymphoid tissue (GALT) of HIV-1–infected humanized mice, the first three-dimensional ultrastructural examination of HIV-1 infection in vivo. Human immune cells were successfully engrafted in the mice, and following infection with HIV-1, human T cells were reduced in GALT. Virions were found by ET at all stages of egress, including budding immature virions and free mature and immature viruses. Immuno-electron microscopy verified the virions were HIV-1 and showed CD4 sequestration in the endoplasmic reticulum of infected cells. Observation of HIV-1 in infected GALT tissue revealed that most HIV-1–infected cells, identified by immunolabeling and/or the presence of budding virions, were localized to intestinal crypts with pools of free virions concentrated in spaces between cells. Fewer infected cells were found in mucosal regions and the lamina propria. The preservation quality of reconstructed tissue volumes allowed details of budding virions, including structures interpreted as host-encoded scission machinery, to be resolved. Although HIV-1 virions released from infected cultured cells have been described as exclusively mature, we found pools of both immature and mature free virions within infected tissue. The pools could be classified as containing either mostly mature or mostly immature particles, and analyses of their proximities to the cell of origin supported a model of semi-synchronous waves of virion release. In addition to HIV-1 transmission by pools of free virus, we found evidence of transmission via virological synapses. Three-dimensional EM imaging of an active infection within tissue revealed important differences between cultured cell and tissue infection models and furthered the ultrastructural understanding of HIV-1 transmission within lymphoid tissue.
Introduction
HIV-1 remains a significant public health concern with over 33 million people infected world-wide [1]. Most HIV-1 transmissions occur across an epithelial barrier, resulting in generation of a founder population within the mucosa, viral dissemination to lymphatic tissue, and exponential viral replication throughout the lymphatic system [2]. These events result in depletion of most CD4-positive T cells in mucosal compartments, and establishment of a reservoir of resting cells with integrated provirus that is not susceptible to antiretroviral therapy. In the absence of therapy, progressive immune system collapse and progression towards AIDS ensue in most infected persons.
Accumulating evidence indicates that both acute and chronic HIV-1 infection profoundly affect the gastrointestinal (GI) tract [3], [4]. Studies of SIV infection in non-human primates demonstrated that intestinal CD4 T cell depletion occurs within days, even before T cell depletion can be detected in the peripheral blood or lymph nodes [5]; similar events occur in HIV-1–infected humans [2], [6]. Several features of the GI tract facilitate its susceptibility to HIV-1 infection: (i) the GI mucosa includes high levels of pro-inflammatory, HIV-1–stimulatory cytokines produced by exposure to antigens in the external environment, (ii) a dense clustering of cells that facilitates cell-to-cell transmission, and (iii) a majority of the activated memory T cells expressing CD4 and CCR5 that serve as the preferred target cells for HIV-1 infection [7], [8]. Indeed, the gut-associated lymphoid tissue (GALT) harbors the greatest concentration of potential HIV-1 target cells in the human body [9]; >50% of CD4 T cells from the lamina propria in the lower GI tract are destroyed during acute HIV-1 infection, and early infection of the GALT is believed to be central to chronic HIV-1 infection and disease progression [10], [11]. Furthermore, the presence of CD4 and CD8 T cells, dendritic cells, and macrophages in the GALT make this tissue an integral site for HIV-mediated immune depletion.
Mouse models with humanized immune systems are emerging as a tractable, cost-effective means by which to study HIV-1 infection in mucosal lymphoid tissue [12]. One such model, humanized bone marrow/liver/thymus (BLT) mice, are individually created by transferring human fetal thymic and liver organoid tissues, along with CD34-positive human stem cells, into immunocompromised mice. BLT mice reconstitute significant levels of human lymphoid immune cells; e.g., T and B cells, monocytes, dendritic cells and macrophages in peripheral blood and organs including the GI tract [13], [14]. Important aspects of human HIV-1 infection are recapitulated in this system, including T cell depletion in the gut and peripheral blood, and both systemic and mucosal virus transmission during the course of the disease [15], [16]. Furthermore, BLT mice exhibit high levels of human immune cell engraftment at mucosal sites and significant antigen specific immune responses by multiple cell types [17], [18].
Electron microscopy (EM) was instrumental in the original identification of HIV-1 [19], [20]. Subsequently, diagnostic EM analyses of biopsies from infected patients revealed important aspects of HIV-1 transmission in humans at varying stages of infection, from early acute disease to AIDS progression [21]. More recently, 3-D EM, specifically electron tomography (ET), cryoelectron tomography (cryoET) and ion-abrasion scanning electron microscopy, have been applied at increasingly higher resolutions, facilitating improved understanding of HIV-1 virion structure [22]–[24], virus budding [25], [26], and virus transmission between immune cells [27], [28]. 3-D EM of isolated virions and infected cells can provide a detailed understanding of HIV-1 ultrastructure and transmission between cultured cells, but does not address the complex cellular environment found in mucosal tissues within an organism experiencing an active infection.
Here we used ET to analyze GALT from humanized HIV-1–infected BLT mice in order to visualize HIV-1 infection in mucosal tissues in 3-D at ultrastructural resolution. These analyses allowed us to localize infected substructures within intestinal tissue, classify virions as mature or immature, identify infected cells, visualize structures we interpreted as components of the host cell machinery involved in viral budding, and assess the propensity for viral spread by cell-to-cell versus free virus routes of infection. In parallel studies, we used immunofluorescence (IF) and immuno-electron microscopy (immunoEM) to verify the identities of viral particles, locations of infected tissue, and to distinguish human from murine and infected from uninfected cells.
Results
Immunofluorescence (IF) Characterization of HIV-1 Infection in BLT GALT
Human hematopoietic cells derived from transplanted human stem cells have been shown to repopulate the GALT of BLT mice, and HIV-1 infection of these mice results in CD4 T cell depletion, initially in GALT and then systemically [13], [16]. Following established protocols [13], BLT mice were infected with HIV-1 approximately 20 weeks after transfer of human immune tissues and cells, using only mice that met the following criteria for adequate human immune reconstitution: >25% of peripheral blood cells were within a lymphocyte gate on forward-versus-side scatter plots; >50% of cells in the lymphocyte gate were human (human CD45+/mouse CD45−); and >40% of human cells in the lymphocyte gate were T cells (human CD3+). Ten to twenty weeks post infection, mice were sacrificed and segments of small intestine and colon were excised. IF was used to survey locations of HIV-1–infected cells in GALT (Figure 1A,B). Following infection with HIV-1, human CD4 T cells were depleted from the lamina propria (Figure 1B), as previously reported [13], [16]. Staining for the p24 capsid protein of HIV-1 localized primarily in CD4+ cells in regions near the crypts (Figure 1B, inset), which harbor significant populations of immune cells and multipotent stem cells [29]. No evidence of human cells or HIV-1 infection was found in non-humanized infected controls (data not shown).

Ultrastructural Characterization of HIV-1–Infected BLT GALT
We next analyzed GALT samples in parallel by ET and immunoEM/ET. Tomography of frozen hydrated tissue samples by cryoET was not possible because the samples were too thick for imaging without sectioning and were infectious biohazards. We therefore imaged fixed and sectioned samples, either positively-stained plastic-embedded or negatively-stained methylcellulose-embedded sections. For ET alone, preservation quality was improved by lightly fixing HIV-1–infected tissue with aldehydes and then further processing them by high-pressure freezing and freeze substitution fixation [30]. This “hybrid” fixation method allowed for safe handling of infectious material and obviated the most structurally damaging steps of traditional chemical fixation [31], yielding well-preserved positively-stained samples. Tomograms were reconstructed from 200 nm or 300 nm sections, often in montaged serial sections of volumes up to 6.1 µm×6.1 µm×1.2 µm. Although these samples could not be used for immunoEM because antibody epitopes are rarely accessible in epoxy-embedded, positively-stained samples [32], analogous GALT samples generated from the same animal were prepared for immunoEM/ET as negatively-stained methylcellulose-embedded sections [33]. Measurements of virions and other structures reflected proportional thinning typical of plastic-embedded and negatively-stained samples [34]. Consequently most structures were ∼30% smaller than counterparts from cryoEM studies or virions in solution or in cultured cells [22]–[24], [35], [36].
ET surveys of HIV-1–infected BLT mouse GALT revealed budding virions (Figure 2A,B; Figure S1A) and free mature and immature particles (Figure 1C, Figure 2C–D, Figure S1B). Virions were detected in all HIV-1–infected mice, while none were found in mock-infected controls (data not shown). The virions were verified as HIV-1 using antibodies against HIV-1 p24 and the envelope spike (Figure 2E,F). Virions were imaged in tissue at all stages of egress, from early plasma membrane Gag assembly to nearly completed buds and fully mature, free HIV-1 (Figure S2). Budding profiles and immature free virions were distinguished by core structures that exhibited radial layers and often appeared as an incomplete internal sphere (a “C” shape in projection) [24], [26]. Mature HIV-1 particles were distinguished from immature particles by the collapse of their cores into a variety of conical shapes, typically “bullet-shaped” cones but often cylinders or ellipsoids [23], [37] (Figure S2). Although envelope spikes on HIV-1 and SIV can be distinguished in positively-stained samples [38], we observed few projections emanating from virion surfaces, consistent with biochemical and cryoET studies of purified HIV-1 virions that demonstrated a low number of envelope spikes: an average of ∼14 (ranging from 4–35) per virus particle [39], [40].

After establishing that HIV-1 could be identified in infected BLT GALT by ET and immunoEM, we surveyed GALT samples to determine locations of infection. Plastic-embedded sections of small intestine (jejunum and ileum) and large intestine (colon) were examined to find HIV-1 and infected cells, which were identified by budding profiles at their surfaces. Within a given animal, the extent of infection and the distribution of virions were similar between the small and large intestine. However, virions were found in differing amounts amongst sub-structures in the intestinal mucosa. The largest populations of HIV-1 virions and infected cells identified by EM were located in crypts (Figure 1A,C), consistent with IF (Figure 1B). Approximately one in ten crypts showed evidence of HIV-1 infection. The mucosal region surrounding the villus base and the crypts contained few free virions or infected cells (∼1 in >100); when present, infected cells were often near a capillary or venule (Figure S1A). The numbers of free virions and infected cells in the lamina propria were less than in the crypts (Figure S1B). Typically, infected lamina propria were in villi continuous with infected crypts. Few infected cells or virions were found in the smooth muscle layer surrounding the intestine. In addition, free virions were rarely found in blood vessels because even the high viral loads of the HIV-1–infected BLT mice from which the samples were derived (up to 126,000/mL in peripheral blood) translated to only ∼1×10⁻⁷ virions/µm3. Thus at the scale of individual EM images or even large-format tomograms, HIV-1 virions would be rarely seen, and our imaging of >50 blood vessels contained within tomograms yielded only two examples of free virions (data not shown).
To identify potential human target cells of HIV-1 infection, we conducted immunoEM (Figure S3A–D) using antibodies specific for human proteins. Human CD4 localized primarily to the plasma membrane in uninfected cells (Figure S3A), but we found extensive CD4 labeling in the endoplasmic reticulum (ER) of CD4-positive cells with budding virions or nearby free virions (Figure S3B), correlating with the finding that HIV-1 Vpu induces cell surface CD4 to redistribute to the ER to avoid surface retention of newly-forming virions [41]. Double labeling with antibodies against HIV-1 Nef and human CD4 (Figure S3C) or class I human leukocyte antigen (HLA) and human CD4 (Figure S3D) confirmed that cells exhibiting a predominantly ER localization of CD4 were human cells infected with HIV-1. No instances of Nef expression were found in uninfected or non-human cells (data not shown), which served as an internal control for the specific of the antibodies and further validated the BLT model of HIV-1 infection.
Structural Details of Immature HIV-1 Virions in GALT
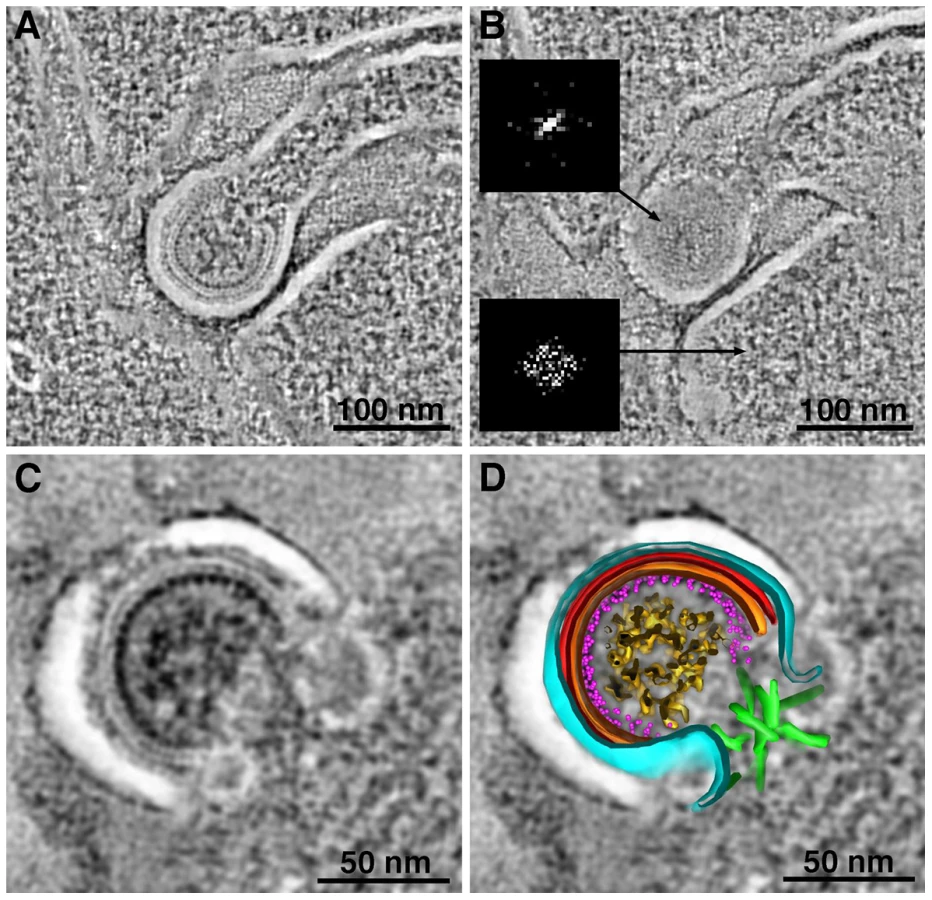
Tomograms of immature virions derived from negatively-stained infected tissue revealed detailed structural information. With the exception of the widening of lipid bilayer membranes, presumably caused by obligatory light fixation associated with this method, the overall architecture of the Gag shell in immature virions conformed to known properties of HIV-1 determined from studies of viruses isolated from cultured cells [22], [24], [35], [36], [42] (Figure 3; Figure S4). Indeed, the immature virions in our tissue samples (Figure 3, S4A,B) exhibited features observed in cryoET analyses of purified frozen hydrated HIV-1 [22], [24] (Figure S4C); e.g., individual layers of the Gag shell, including the hexagonal lattice of the capsid (CA) portion (Figure 3). The symmetry of the CA layer was confirmed by hexagonal features in the Fourier transforms of immature virions, but not in transforms of adjacent cytoplasm (Figure 3B; Figure S4A).
Identification and Quantification of Intercellular Pools of HIV-1 Virions
More than 50 crypts of Lieberkühn were imaged in the course of this study. In the ∼10% of crypts that were infected, HIV-1 virions were found primarily in pools within dilated regions of intercellular spaces (Figure 1C; Figure 4; Figure S5; Movie S1). Pools were defined as a population of virions within an intercellular space that was continuous within a given 3-D volume. Multiple intercellular spaces could be present within the volume, but unless the spaces were visually continuous, virions within them were regarded as separate pools (Figure 4B,C). The numbers of free virions in intercellular pools ranged from 5 to >200. In single-frame tomograms (3.2 µm×3.2 µm×200 nm), most pools contained 10–40 particles. Larger pools were observed in serial-section reconstructions encompassing greater tissue volumes. In longitudinal sections of crypts, most pools were found between the base and middle. Infected human immune cells, identified by the presence of budding virions, were often found near virion pools.

Virions within a given pool were distinguished as mature or immature based on the presence of a cone-shaped core in mature particles and radial Gag layers in immature particles (Figure S2). The numbers of mature and immature particles in intercellular pools were quantified within reconstructed volumes of infected crypts. Pools could be classified as either “mostly mature” or “mostly immature” (Figure S5A). Of >100 pools containing many hundreds of virions, approximately 90% of pools were classified as mostly mature and 10% were mostly immature.
Potential HIV-1 target cells and pools of virions were plentiful in GALT, particularly in crypts, thus it was not always possible to determine from which cell a particular virion population originated. In order to quantify virions from a particular cell and infer temporal data with respect to virion pools, we imaged regions of the intestinal smooth muscle layer (Figure 1A), which contains few HIV-1 target cells. Figure S5B shows an HIV-1-infected cell in the smooth muscle. The surface of this cell exhibited several HIV-1 budding profiles, and groups of free virions were located both in close proximity to and at varying distances from it. There were no other infected cells within several microns, thus we could be confident that nearby free virions had originated from that cell. We found that 62% of virions (n = 16) in immediate proximity (≤0.5 µm) to the cell were immature, while 73–75% of virions in groups located 0.8 µm (n = 15) and 1.3 µm (n = 32) away were mature.
Of >100 virion pools that were imaged, most were in obvious extracellular spaces. Some pools (∼5%) appeared to be intracellular, but were revealed by ET to be connected to the extracellular space by narrow channels that averaged ∼27 nm in width (range = 23–32 nm; n = 6) (Figure 4D–E) and contained 2–20 mature virions. A few of the budding regions were large enough that potential continuities with the plasma membrane were outside of the reconstructed volume. The presence of seemingly intracellular virion pools connected to microchannels could identify the cell as an infected macrophage, a cell type in which internal virus-containing compartments were proposed to represent specialized domains of the plasma membrane that were sequestered intracellularly [43], [44] and/or endosomal compartments [45], [46].
Pools of Free Virions Versus Cell-to-Cell Transmission of HIV-1
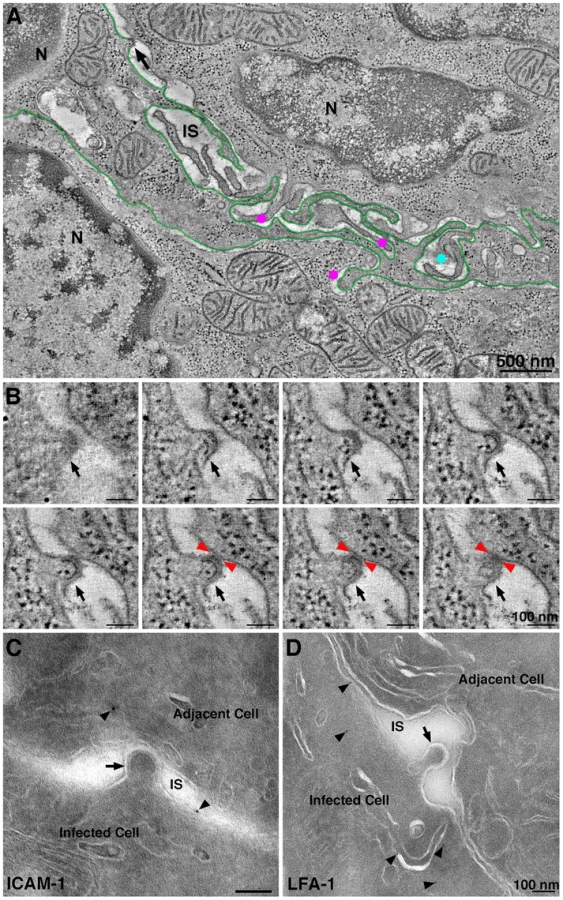
ET surveys of HIV-1 infected GALT showed evidence of virological synapses for direct cell-to-cell virus transmission, a route of HIV-1 transmission within tissues whereby a virus buds from an infected cell and directly contacts and infects an adjacent uninfected cell [47]. Formation of a virological synapse results from interaction of gp120 on an infected cell with its receptors on a target and also involves other host proteins such as LFA-1 and ICAM proteins on the surfaces of both the donor and target cells [48], [49]. A large format reconstruction (2×3-frame montage) of GALT revealed an HIV-1–infected cell, likely a dendritic cell or macrophage based on the convoluted processes intercalating between neighboring cells (Figure 5A; Movie S2). A presumptive virological synapse was visualized as a region of contact between a budding virion and an adjacent cell (Figure 5B; Movie S2). Although this positively-stained sample could not be examined by immunoEM, we found similar features in negatively-stained samples that labeled with antibodies against LFA-1 and ICAM-1 (Figure 5C,D), supporting the identification of these regions as virological synapses. In another example, an infected cell that showed numerous budding profiles included one that closely approached the surface of an adjacent cell although still attached to its host cell via a ∼50 nm neck (Figure S6A). The surface region of the cell proximal to the approaching bud was denser than surrounding surface regions and extended toward the bud. In a third example, a budding profile from an infected cell appeared to project into an invagination in the plasma membrane of an adjacent cell (Figure S6B,C). Tomographic views through the volume containing this region showed the boundaries of the invagination followed the contours of the budding profile (Figure S6C), suggesting a dynamic response to the approaching nascent virion.
By reconstructing a large 3-D volume of infected tissue, we could address whether direct cell-to-cell transmission was an obligatory means of virion transfer between two adjacent cells. Movie S1 shows a 1.4 µm×2.9 µm×1.2 µm tomogram in which the outlines of two adjacent cells were distinguished. Both cells were identified as infected by the presence of budding virions and were therefore HIV-1 targets. A region resembling a virological synapse was not observed in the reconstructed volume, however a large accumulation of free mature virions were present in the space between the cells, suggesting that direct cell transfer is not a required mechanism of HIV-1 transmission between closely apposed infected cells. The lack of an observed virological synapse in such cases could be the consequence of CD4 down-regulation in the infected cells. However the existence of natural recombinant HIV-1 strains, which could result from infection by one HIV-1 strain of a cell already infected with a different viral strain [50], suggests that residual CD4 remaining at an infected cell surface can allow for infection via free virus or direct cell-to-cell transfer.
Characteristics of Budding Virions
The large number of budding virions within BLT GALT tomograms offered the opportunity to characterize structural aspects of HIV-1 budding in infected tissue (Figure S7). Actin filaments were often found near forming buds (Figure S7A) similar to those previously observed at HIV-1 budding sites in cultured cells [25]. Budding profiles exhibited varying lengths of necks, including some with no neck (Figure 3C,D; Figure S7B). In the colon, early budding virions without necks were often observed forming from surfaces that were not obviously plasma membrane. However, serial-section tomography revealed that these domains were usually continuous with the plasma membrane proper, indicating that they were convoluted regions of the cell surface and not distinct cytoplasmic compartments. Some budding virions exhibited necks with 50–80 nm lengths and varying widths (Figure S7C), with narrower necks likely representing those approaching scission. Virions were also observed budding at the ends of extremely long cellular projections (Figure 2A,B) that were likely filopodia extending from dendritic cells, as observed in culture [27], [51].
ET analyses of HIV-1 budding in cultured cells revealed a subset of RNA-free immature virions with a novel “thinner” Gag lattice lacking the nucleocapsid-RNA layer, which were suggested to represent aberrant, noninfectious virions resulting from premature activation of HIV-1 protease [25]. Using our measuring convention, the previously-described thin Gag lattice [25] measured 9–10 nm. Analysis of 100 free or budding immature virions from tissue samples yielded no examples with a thin (9–10 nm) Gag lattice that lacked discernable RNA densities. Instead, we found that the Gag lattice widths in all of the immature virions we surveyed (n = 100) within infected tissue was 14.6±0.8 nm (Figure S4B, Figure S7D,E); significantly different than the thin 9–10 nm Gag lattices previously described [25]. In addition, there were no systematic structural differences in Gag lattices correlating with the type of budding profile: the Gag shell thicknesses measured in 30 long-necked and 30 neck-free buds were similar and presumptive RNA densities were present in all cases (Figure S7D).
Localization of ESCRT Pathway Components at Sites of HIV-1 Budding
Release of HIV-1 virions from infected cells involves recruitment of the host endosomal sorting complexes required for transport (ESCRT) machinery to sites of virus assembly by the Gag polyprotein [52]. These interactions culminate with the polymerization of ESCRT-III proteins, recruitment of vacuolar protein sorting-associated protein 4 (VPS4) ATPase oligomers, fission of the cellular membrane attaching the virion to the host cell, and disassembly of the ESCRT machinery.
We used antibodies against ESCRT-III proteins, human charged multivesicular body proteins (hCHMPs) 1B and 2A, and ALG2-interacting protein X (ALIX), an ESCRT adaptor protein that facilitates the transport of Gag to the cell membrane [53] and can mediate interactions between ESCRT-I and ESCRT-III complexes [54], to detect components of the ESCRT pathway in infected tissue by immunoEM. We found that hCHMP1B, hCHMP2A and hALIX localized predominantly to the neck regions of budding HIV-1 virions (Figure 6A-C). The labeling was specific, but sparse due to the small number of epitopes and their availability only at section surfaces.

At scission regions of budding virions in which the neck of the bud was greater than half the diameter of the bud, clusters of 4–6 spoke-like projections nearly 20 nm in length radiating from a centralized origin at the base of the budding virion were sometimes observed (Figure 3C,D; Figure 6D; Figure S8A; Movie S3). As the larger neck diameter may define these buds as being at an initial stage of egress, these radial projections could represent components of the early portions of the ESCRT pathway such ESCRT-I or ALIX recruited by assembling HIV-1 Gag molecules. Indeed, the size and shape of the structures approximate models for the ESCRT-I-II supercomplex determined by a combination of spectral techniques [55]. By contrast, in tomograms of budding virions with narrower necks (less than half the diameter of the bud itself), we observed parallel electron dense striations circumscribing the neck of the bud in both positively - and negatively-stained sections (Figure 7A–E; Figure S8B,C; Movie S4) suggestive of ESCRT-III components polymerizing at membranes [56], [57]. Similar electron dense striations were detected at the necks of budding virions arrested at a late stage by expression of dominant-negative ESCRT-III or VPS4 proteins [58]. In addition, budding profiles in positively-stained samples often showed 1–5 electron-dense “spots” in the neck or base of a bud (Figure 7F,G; Movie S5). The spots were observed in over half of ∼50 budding profiles in which the diameter of the neck was half or less of the diameter of the budding virion; presumably a late stage of budding. Available antibodies against VPS4 did not stain efficiently by immunoEM, however their interpretation as VPS4 oligomers was consistent with fluorescence imaging showing recruitment of 2–5 VPS4 dodecamers to the sites of viral budding just prior to virion abscission [59], [60]. In addition, the size and relative shape of the putative VPS4 densities (Figure 7G) correlated with cryoEM reconstructions of VPS4 [61].

Discussion
Many aspects of the pathologies related to HIV-1 infection, including immune cell death and tissue destruction, occur in GALT. However, 3-D ultrastructural details of a natural GALT infection were unknown because ET had not been applied to in vivo infection in GALT or other lymphatic tissues. BLT humanized mice are an emerging model for studying HIV-1 infection, and BLT GALT maintains cellular architecture, cell-cell interactions, immune cell populations and signaling more accurately than cell culture infection models [12]. As such, the BLT mouse system is a reliable model for structural studies of HIV-1 infection in a tissue environment. In addition, the inclusion of human thymic tissue in BLT mice allows for T cell maturation in the context of human, rather than murine, MHC proteins; an aspect that is not present in humanized mouse model systems produced with human hematopoietic stem cells but without thymic tissue.
Dense areas of HIV-1–infected cells, including CD4 T cells, macrophages and dendritic cells, and free HIV-1 virions were found in crypts within BLT GALT by IF, ET and immunoEM (Figure 1B,C). Blood vessels were imaged in mice with a wide range of viral loads; however, we were unable to correlate the relative abundance of virions detected in GALT with the viral load measured in the blood. In fact, only two examples of virions within blood vessels of BLT mice were detected as compared with hundreds of virions within mucosal tissue. This finding is consistent with reports highlighting a discrepancy between blood viral load and HIV-1 levels in tissues [62], [63]. Thus analysis of HIV-1–infected tissues by methods such as ET may provide valuable information in addition to blood viral load measurements when evaluating treatment regimens.
Potentially relevant to infection and immune cell recognition mechanisms, large pools of free HIV-1 were found within infected GALT (Figures 1C, Figure 4, Figure S5). Although most pools contained mainly mature virions, some pools contained a majority of immature virions (Figure S5A), a phenomenon not observed in EM studies of HIV-1 infection of cultured cells. Pools of virions were usually found between cells, but also in compartments that appeared to reside within cells. These compartments were often connected to the cell surface by microchannels 20–30 µm in width (Figure 4D). These narrow channels likely undergo dynamic changes in morphology, as their width would be too narrow to accommodate passage of HIV-1 to the extracellular space. We interpreted such channels as invaginations of the plasma membrane, consistent with reports that macrophages can assemble HIV-1 in intracellular virus-containing compartments created by internally sequestered plasma membrane [43], [44], [64]. In infected tissue, we found that pools of HIV-1 virions located between two cells could contain mature or immature virions (Figure S5A), whereas the intracellular pools connected by microchannels contained only mature virions (Figure 4D). One possibility for the difference in maturation states of inter - versus intracellular pools of HIV-1 is that intracellular virions connected to the extracellular space by microchannels are not subject to movement by interstitial fluid through intestinal tissue and could remain in a single location long enough to complete maturation, perhaps representing viral reservoirs that allow low levels of de novo infection to proceed in the presence of anti-retroviral therapy and/or antibodies [65].
Although the discovery of virion pools suggested that infection by free virus could occur within infected tissue, we also found evidence of direct cell-to-cell transmission of HIV-1 in infected GALT (Figure 5; Movie S2). The virological synapse is a mechanism of cell-to-cell transmission in which juxtaposition of an infected and uninfected cell promotes infection by directing viral assembly, budding, maturation, and fusion machinery to discrete locations of cellular contact between cells [47]. In a large 3-D reconstruction of two adjacent HIV-1–infectable target cells (Movie S1), we found a large pool of mature virions but no evidence for a virological synapse, suggesting that formation of virion pools and infection by free virus can occur even when adjacent cells are both infectable by HIV-1, or had been infectable prior to down-regulation of CD4. In addition, this result validated our frequent finding of large pools of free virions in HIV-1–infected tissue, demonstrating that this phenomenon was not necessarily the consequence of the juxtaposition of a human infected cell and a murine cell, as may occur in BLT GALT.
EM studies of HIV-1 virions produced in cultured cells suggested that maturation is a rapid process, because intermediate maturation states were not detected and because virions found near cells were predominantly mature [66]. However, our finding of pools containing immature virions in proximity to infected cells in tissue suggested maturation dynamics and/or virion diffusion properties differ between cells organized within tissue versus those cultured in vitro. In addition, we never found examples of RNA-negative budding virions with a thin Gag lattice in tissue samples, as had been observed in ∼18% of immature particles in cryoET analyses of HIV-1 produced in cultured cells [25]. Thus, higher numbers of aberrant particles and of exclusively mature virions in close proximity to producer cells could be artifacts of producing virions in cultured cells, suggesting that the BLT model of in vivo infection more accurately recapitulates the HIV-1 lifecycle than cell culture models.
Although ET relies on fixed tissue and cannot directly recapitulate virion dynamics in live cells, our studies provided a glimpse into temporal aspects of HIV-1 maturation. We determined that an isolated infected cell within a large tissue volume was the sole producer of several populations of imaged virions located at varying distances from the cell. This allowed us to determine that a single infected cell can produce at least 63 viruses (the number of virions in the three pools in Figure S5B). The total number of virions produced per cell is likely far larger, as regions above and below the cell were not represented in the reconstruction. Using a predicted rate of interstitial fluid movement in intestinal tissue of 0.1–2 µm/sec [67], a virion would travel 2 µm in 1–20 sec, indicating that maturation could occur just seconds after release from an infected cell. This argues that, in tissue, virions found ∼2 µm away from a producer cell budded only seconds earlier, supporting an assumption of rapid virus maturation. Furthermore, our finding of mostly immature virion pools in close proximity to the infected cell and mostly mature virion pools further away from the cell (Figure S5B) is consistent with synchronous release and subsequent maturation of HIV-1. The trigger(s) for and/or block(s) to maturation that could promote synchronized virus maturation in tissue could include proximity to an infected producer cell, lack of an adjacent target cell to form a virus synapse, and/or contact with a non-infectable cell.
Late events in HIV-1 budding had been visualized by fluorescence microscopy [59], [60] and ET of cultured cells [25], [26], [66], [68] but not yet in infected tissue. In our infected tissue samples, we detected distinct electron dense structures near virions at various stages of budding that may represent aspects of the host cell ESCRT machinery at sites of HIV-1 egress (Figures 6,7,S8). Although we could not identify the structures conclusively, our assignments of their possible identities are consistent with what is known temporally about the involvement of host cell machinery in HIV-1 budding and release from infected cells. Tomograms revealed that virions in the initial stages of budding contained 4–6 spoke-like projections emanating from the center of the forming neck of the budding virion (Figure 3C–D, Figure 6D, Figure S8A), potentially representing components of host ESCRT-I or ALIX recruited by assembled HIV-1 Gag. The shape, size, and temporal occurrence of these structures agree with a proposed model for vesicle budding and fission based on biophysical analyses of the ESCRT-I-II supercomplex in solution [55]. Virions at later stages of budding that were connected to the host cell membrane by thinner (<50 nm) elongated necks showed parallel, electron dense striations along the membrane surface of the neck (Figure 7A–E, Figure S8B) that we interpreted as features of polymerized ESCRT-III proteins [56], [57]. These late budding profiles often displayed dense spots along the center of the neck (Figure 7F,G) that we suggest were VPS4 oligomers recruited immediately prior to fission of the new virion from the cell membrane, consistent with fluorescence microscopy studies [59], [60]. ET of budding virions within tissue allowed a spatial and temporal interpretation of HIV-1 budding. First, the Gag lattice reached a sufficient point of closure, which allowed formation of a spoke-like structure at the base of the early budding virion. Next, the virion formed an elongated neck; concomitant with polymerization of host cell factors in a spiral around the inside of the membrane [56], [57]. In tomographic slices of budding profiles, these presumptive spirals appeared as two or more parallel lines bisecting the neck region (Figure 7A–E). Finally, the recruitment of large oligomers, possibly VPS4, coincided with the separation of the virion from the infected cell [59], [60], completing the budding process (Figure 7F,G).
In summary, our 3-D ultrastructural characterization of HIV-1–infected GALT identified dense regions of virus transmission, provided insights into the temporal nature of virus maturation, revealed HIV-1 transmission occurring by both free virus and direct cell-to-cell mechanisms, and demonstrated important differences between cultured cell and tissue HIV-1 infection models. Differences included the identification of free immature virions and the scarcity of aberrantly formed viral particles during an active infection. The high resolution of our positively - and negatively-stained tissue samples allowed 3-D visualization of HIV-1 transmission within lymphoid tissue, providing a new approach for understanding HIV-1 infection in vivo.
Materials and Methods
HIV-1 Infection of BLT Mice
Humanized mice were prepared and cared for in an AAALAC-certified animal care facility at the Massachusetts General Hospital (OLAW Assurance #A3596-01), in accordance with a protocol approved by the MGH IACUC (Protocol #2009N000136/25). The protocol as submitted and reviewed conforms to the USDA Animal Welfare Act, PHS Policy on Humane Care and Use of Laboratory Animals, the “ILAR Guide for the Care and Use of Laboratory Animals” and other applicable laws and regulations. Every effort was made to minimize animal suffering throughout all experiments. Human tissue for preparing the humanized mice was procured and used in accordance with a protocol approved by the local Institutional Review Board (Partners Human Research Committee, Protocol #2012-P-000409/5).
NOD/SCID/IL2Rγ−/ − mice (The Jackson Laboratory) were reconstituted with human tissue as described [13]. Approximately 20 weeks after transfer of human immune tissues and cells, mice were infected intraperitoneally with 1×10⁵ TCID50 of JR-CSF HIV-1. Every 2 weeks after infection, ∼200 µl of blood was obtained through puncture of the retro-orbital sinus or submandibular vein for determination of HIV-1 plasma viral load. Viral RNA was isolated using the QIAamp Viral RNA Mini Kit (Qiagen) and viral loads were determined by quantitative RT-PCR using primers for HIV-1 Gag [69]. Immunofluorescence experiments were conducted using tissues from a mouse with a blood viral load of 940,000 copies/mL. ImmunoEM experiments were conducted using tissues from a mouse with a viral load of 100,000/mL. The remaining mice had blood viral loads as follows: 0 (control) 9,800, 8,400, 18,500 and 126,000 copies/mL. As previously shown, the range of blood viral loads did not correlate with virus populations found in tissue samples [62], [63]. Infected mice were sacrificed 10–20 weeks post infection, and then necropsied with segments of small intestine and colon excised and fixed. Immunofluorescence (IF) studies were conducted as described in the Supplementary Methods (Text S1).
Electron Tomography
For positively-stained samples, HIV-1–infected tissue was prepared by a hybrid method that employed primary chemical fixation followed by high-pressure freezing/freeze substitution fixation (see Text S1). Negatively-stained samples were prepared as described [33] and in the Supplementary Methods (Text S1).
200 nm positively-stained sections and 90 nm negatively-stained sections were imaged in a Tecnai-12 G2 transmission electron microscope at 120 KeV, and 300 nm sections were imaged in a Tecnai G2 TF30-FEG microscope at 300 KeV (FEI Company, Holland) in a dual-axis tomography holder (2040; Fischione Instruments, Export, PA). Dual axis tilt series (+/−60°; 1° intervals), including multi-frame montaged datasets, were acquired automatically using the SerialEM software package [70]. Tomographic data were aligned, backprojected, analyzed and segmented using IMOD [71].
Gag Lattice Analyses
The Gag lattice in the tomographic slice closest to the equator of each virion or budding profile slice was measured in five randomly selected areas as a line from the base of the innermost layer to the outside of the outermost layer (green lines in Figures S3B and S6D) using IMOD [71]. The values were combined to give an average Gag thickness for each virion. The symmetry of the Gag lattice was evaluated by Fourier transformation of Gag regions in negatively-stained tomograms. Budding profiles were viewed in tomographic slices taken near the surfaces of their Gag layers (Figure 3B) and images were displayed using the Slicer tool in IMOD, which allowed for 3-D rotation. When the Gag structure was optimally oriented, the image was transformed to Fourier space using an FFT algorithm within IMOD.
On-line Availability of Tomographic Datasets
Selected tomographic datasets are available at http://www.br.caltech.edu/bjorker/ladinsky, on the Electron Microscopy Databank (http://www.emdatabank.org) under submission number 28207, or will be provided upon request.
Supporting Information
Zdroje
1. UNAIDS (2012) http://www.unaids.org/en/media/unaids/contentassets/documents/epidemiology/2012/gr2012/20121120_UNAIDS_Global_Report_2012_with_annexes_en.pdf.
2. HaaseAT (2011) Early events in sexual transmission of HIV and SIV and opportunities for interventions. Annu Rev Med 62 : 127–139.
3. BrenchleyJM, DouekDC (2008) HIV infection and the gastrointestinal immune system. Mucosal Immunol 1 : 23–30.
4. DouekDC, RoedererM, KoupRA (2009) Emerging concepts in the immunopathogenesis of AIDS. Annu Rev Med 60 : 471–484.
5. VeazeyRS, DeMariaM, ChalifouxLV, ShvetzDE, PauleyDR, et al. (1998) Gastrointestinal tract as a major site of CD4+ T cell depletion and viral replication in SIV infection. Science 280 : 427–431.
6. BrenchleyJM, SchackerTW, RuffLE, PriceDA, TaylorJH, et al. (2004) CD4+ T cell depletion during all stages of HIV disease occurs predominantly in the gastrointestinal tract. J Exp Med 200 : 749–759.
7. LacknerAA, LedermanMM, RodriguezB (2012) HIV Pathogenesis: The Host. Cold Spring Harb Perspect Med 2: a007005.
8. HaaseAT (2005) Perils at mucosal front lines for HIV and SIV and their hosts. Nat Rev Immunol 5 : 783–792.
9. Guy-GrandD, VassalliP (1993) Gut intraepithelial T lymphocytes. Curr Opin Immunol 5 : 247–252.
10. DouekD (2007) HIV disease progression: immune activation, microbes, and a leaky gut. Top HIV Med 15 : 114–117.
11. BrenchleyJM, PriceDA, SchackerTW, AsherTE, SilvestriG, et al. (2006) Microbial translocation is a cause of systemic immune activation in chronic HIV infection. Nat Med 12 : 1365–1371.
12. DentonPW, GarciaJV (2012) Mucosal HIV-1 transmission and prevention strategies in BLT humanized mice. Trends in microbiology 20 : 268–274.
13. BrainardDM, SeungE, FrahmN, CariappaA, BaileyCC, et al. (2009) Induction of robust cellular and humoral virus-specific adaptive immune responses in human immunodeficiency virus-infected humanized BLT mice. J Virol 83 : 7305–7321.
14. DentonPW, GarciaJV (2011) Humanized mouse models of HIV infection. AIDS Rev 13 : 135–148.
15. DentonPW, EstesJD, SunZ, OthienoFA, WeiBL, et al. (2008) Antiretroviral pre-exposure prophylaxis prevents vaginal transmission of HIV-1 in humanized BLT mice. PLoS Med 5: e16.
16. SunZ, DentonPW, EstesJD, OthienoFA, WeiBL, et al. (2007) Intrarectal transmission, systemic infection, and CD4+ T cell depletion in humanized mice infected with HIV-1. J Exp Med 204 : 705–714.
17. LanP, TonomuraN, ShimizuA, WangS, YangYG (2006) Reconstitution of a functional human immune system in immunodeficient mice through combined human fetal thymus/liver and CD34+ cell transplantation. Blood 108 : 487–492.
18. RajeshD, ZhouY, Jankowska-GanE, RoenneburgDA, DartML, et al. (2010) Th1 and Th17 immunocompetence in humanized NOD/SCID/IL2rgammanull mice. Human immunology 71 : 551–559.
19. Barre-SinoussiF, ChermannJC, ReyF, NugeyreMT, ChamaretS, et al. (1983) Isolation of a T-lymphotropic retrovirus from a patient at risk for acquired immune deficiency syndrome (AIDS). Science 220 : 868–871.
20. GalloRC, SarinPS, GelmannEP, Robert-GuroffM, RichardsonE, et al. (1983) Isolation of human T-cell leukemia virus in acquired immune deficiency syndrome (AIDS). Science 220 : 865–867.
21. OrensteinJM (2007) Replication of HIV-1 in vivo and in vitro. Ultrastruct Pathol 31 : 151–167.
22. BriggsJA, RichesJD, GlassB, BartonovaV, ZanettiG, et al. (2009) Structure and assembly of immature HIV. Proc Natl Acad Sci U S A 106 : 11090–11095.
23. BenjaminJ, Ganser-PornillosBK, TivolWF, SundquistWI, JensenGJ (2005) Three-dimensional structure of HIV-1 virus-like particles by electron cryotomography. J Mol Biol 346 : 577–588.
24. WrightER, SchoolerJB, DingHJ, KiefferC, FillmoreC, et al. (2007) Electron cryotomography of immature HIV-1 virions reveals the structure of the CA and SP1 Gag shells. EMBO J 26 : 2218–2226.
25. CarlsonLA, de MarcoA, OberwinklerH, HabermannA, BriggsJA, et al. (2010) Cryo electron tomography of native HIV-1 budding sites. PLoS Pathog 6: e1001173.
26. CarlsonLA, BriggsJA, GlassB, RichesJD, SimonMN, et al. (2008) Three-dimensional analysis of budding sites and released virus suggests a revised model for HIV-1 morphogenesis. Cell Host Microbe 4 : 592–599.
27. FeltsRL, NarayanK, EstesJD, ShiD, TrubeyCM, et al. (2010) 3D visualization of HIV transfer at the virological synapse between dendritic cells and T cells. Proc Natl Acad Sci U S A 107 : 13336–13341.
28. SougratR, BartesaghiA, LifsonJD, BennettAE, BessJW, et al. (2007) Electron tomography of the contact between T cells and SIV/HIV-1: implications for viral entry. PLoS Pathog 3: e63.
29. WalkerMR, PatelKK, StappenbeckTS (2009) The stem cell niche. J Pathol 217 : 169–180.
30. McIntoshJR, NicastroD, MastronardeDN (2005) New views of cells in 3D: an introduction to electron tomography. Trends Cell Biol 15 : 43–51.
31. GilkeyJC, StaehelinLA (1986) Advances in Ultrarapid Freezing for the Preservation of Cellular Ultrastructure. J Elect Microsc Tech 3 : 177–210.
32. MorphewM, HeW, BjorkmanPJ, McIntoshJR (2008) Silver enhancement of Nanogold particles during freeze substitution for electron microscopy. J Microsc 230 : 263–267.
33. LadinskyMS, HowellKE (2007) Electron tomography of immunolabeled cryosections. Methods Cell Biol 79 : 543–558.
34. LutherPK, LawrenceMC, CrowtherRA (1988) A method for monitoring the collapse of plastic sections as a function of electron dose. Ultramicroscopy 24 : 7–18.
35. FullerSD, WilkT, GowenBE, KrausslichHG, VogtVM (1997) Cryo-electron microscopy reveals ordered domains in the immature HIV-1 particle. Curr Biol 7 : 729–738.
36. WilkT, GrossI, GowenBE, RuttenT, de HaasF, et al. (2001) Organization of immature human immunodeficiency virus type 1. J Virol 75 : 759–771.
37. GanserBK, LiS, KlishkoVY, FinchJT, SundquistWI (1999) Assembly and analysis of conical models for the HIV-1 core. Science 283 : 80–83.
38. HockleyDJ, WoodRD, JacobsJP, GarrettAJ (1988) Electron microscopy of human immunodeficiency virus. J Gen Virol 69 : 2455–2469.
39. ZhuP, LiuJ, BessJJr, ChertovaE, LifsonJD, et al. (2006) Distribution and three-dimensional structure of AIDS virus envelope spikes. Nature 441 : 847–852.
40. ChertovaE, Bess JrJWJr, CriseBJ, SowderIR, SchadenTM, et al. (2002) Envelope glycoprotein incorporation, not shedding of surface envelope glycoprotein (gp120/SU), Is the primary determinant of SU content of purified human immunodeficiency virus type 1 and simian immunodeficiency virus. J Virol 76 : 5315–5325.
41. MagadanJG, Perez-VictoriaFJ, SougratR, YeY, StrebelK, et al. (2010) Multilayered mechanism of CD4 downregulation by HIV-1 Vpu involving distinct ER retention and ERAD targeting steps. PLoS Pathog 6: e1000869.
42. BriggsJA, SimonMN, GrossI, KrausslichHG, FullerSD, et al. (2004) The stoichiometry of Gag protein in HIV-1. Nat Struct Mol Biol 11 : 672–675.
43. DenekaM, Pelchen-MatthewsA, BylandR, Ruiz-MateosE, MarshM (2007) In macrophages, HIV-1 assembles into an intracellular plasma membrane domain containing the tetraspanins CD81, CD9, and CD53. J Cell Biol 177 : 329–341.
44. BennettAE, NarayanK, ShiD, HartnellLM, GoussetK, et al. (2009) Ion-abrasion scanning electron microscopy reveals surface-connected tubular conduits in HIV-infected macrophages. PLoS Pathog 5: e1000591.
45. Pelchen-MatthewsA, KramerB, MarshM (2003) Infectious HIV-1 assembles in late endosomes in primary macrophages. J Cell Biol 162 : 443–455.
46. RaposoG, MooreM, InnesD, LeijendekkerR, Leigh-BrownA, et al. (2002) Human macrophages accumulate HIV-1 particles in MHC II compartments. Traffic 3 : 718–729.
47. JollyC, KashefiK, HollinsheadM, SattentauQJ (2004) HIV-1 cell to cell transfer across an Env-induced, actin-dependent synapse. J Exp Med 199 : 283–293.
48. HioeCE, ChienPCJr, LuC, SpringerTA, WangXH, et al. (2001) LFA-1 expression on target cells promotes human immunodeficiency virus type 1 infection and transmission. J Virol 75 : 1077–1082.
49. RizzutoCD, SodroskiJG (1997) Contribution of virion ICAM-1 to human immunodeficiency virus infectivity and sensitivity to neutralization. J Virol 71 : 4847–4851.
50. RobertsonDL, AndersonJP, BradacJA, CarrJK, FoleyB, et al. (2000) HIV-1 nomenclature proposal. Science 288 : 55–56.
51. AggarwalA, IemmaTL, ShihI, NewsomeTP, McAlleryS, et al. (2012) Mobilization of HIV spread by diaphanous 2 dependent filopodia in infected dendritic cells. PLoS Pathog 8: e1002762.
52. SundquistWI, KrausslichHG (2012) HIV-1 Assembly, Budding, and Maturation. Cold Spring Harb Perspect Med 2: a006924.
53. VottelerJ, IavnilovitchE, FingrutO, ShemeshV, TaglichtD, et al. (2009) Exploring the functional interaction between POSH and ALIX and the relevance to HIV-1 release. BMC Biochem 10 : 12.
54. CarlsonLA, HurleyJH (2012) In vitro reconstitution of the ordered assembly of the endosomal sorting complex required for transport at membrane-bound HIV-1 Gag clusters. Proc Natl Acad Sci U S A 109 : 16928–16933.
55. BouraE, RozyckiB, ChungHS, HerrickDZ, CanagarajahB, et al. (2012) Solution structure of the ESCRT-I and -II supercomplex: implications for membrane budding and scission. Structure 20 : 874–886.
56. LataS, SchoehnG, JainA, PiresR, PiehlerJ, et al. (2008) Helical structures of ESCRT-III are disassembled by VPS4. Science 321 : 1354–1357.
57. HansonPI, RothR, LinY, HeuserJE (2008) Plasma membrane deformation by circular arrays of ESCRT-III protein filaments. J Cell Biol 180 : 389–402.
58. von SchwedlerUK, StuchellM, MullerB, WardDM, ChungHY, et al. (2003) The protein network of HIV budding. Cell 114 : 701–713.
59. BaumgartelV, IvanchenkoS, DupontA, SergeevM, WisemanPW, et al. (2011) Live-cell visualization of dynamics of HIV budding site interactions with an ESCRT component. Nat Cell Biol 13 : 469–474.
60. JouvenetN, ZhadinaM, BieniaszPD, SimonSM (2011) Dynamics of ESCRT protein recruitment during retroviral assembly. Nat Cell Biol 13 : 394–401.
61. YuZ, GonciarzMD, SundquistWI, HillCP, JensenGJ (2008) Cryo-EM structure of dodecameric Vps4p and its 2∶1 complex with Vta1p. J Mol Biol 377 : 364–377.
62. AntonPA, MitsuyasuRT, DeeksSG, ScaddenDT, WagnerB, et al. (2003) Multiple measures of HIV burden in blood and tissue are correlated with each other but not with clinical parameters in aviremic subjects. AIDS 17 : 53–63.
63. ChunTW, CarruthL, FinziD, ShenX, DiGiuseppeJA, et al. (1997) Quantification of latent tissue reservoirs and total body viral load in HIV-1 infection. Nature 387 : 183–188.
64. WelschS, KepplerOT, HabermannA, AllespachI, Krijnse-LockerJ, et al. (2007) HIV-1 buds predominantly at the plasma membrane of primary human macrophages. PLoS Pathog 3: e36.
65. ChuH, WangJJ, QiM, YoonJJ, WenX, et al. (2012) The intracellular virus-containing compartments in primary human macrophages are largely inaccessible to antibodies and small molecules. PLoS One 7: e35297.
66. de MarcoA, MullerB, GlassB, RichesJD, KrausslichHG, et al. (2010) Structural analysis of HIV-1 maturation using cryo-electron tomography. PLoS Pathog 6: e1001215.
67. SwartzMA, FleuryME (2007) Interstitial flow and its effects in soft tissues. Annu Rev Biomed Eng 9 : 229–256.
68. WelschS, HabermannA, JagerS, MullerB, Krijnse-LockerJ, et al. (2006) Ultrastructural analysis of ESCRT proteins suggests a role for endosome-associated tubular-vesicular membranes in ESCRT function. Traffic 7 : 1551–1566.
69. BoutwellCL, RowleyCF, EssexM (2009) Reduced viral replication capacity of human immunodeficiency virus type 1 subtype C caused by cytotoxic-T-lymphocyte escape mutations in HLA-B57 epitopes of capsid protein. J Virol 83 : 2460–2468.
70. MastronardeDN (2005) Automated electron microscope tomography using robust prediction of specimen movements. J Struct Biol 152 : 36–51.
71. MastronardeDN (2008) Correction for non-perpendicularity of beam and tilt axis in tomographic reconstructions with the IMOD package. J Microsc 230 : 212–217.
72. LadinskyMS, WuCC, McIntoshS, McIntoshJR, HowellKE (2002) Structure of the Golgi and distribution of reporter molecules at 20 degrees C reveals the complexity of the exit compartments. Mol Biol Cell 13 : 2810–2825.
Štítky
Hygiena a epidemiologie Infekční lékařství LaboratořČlánek vyšel v časopise
PLOS Pathogens
2014 Číslo 1
- Farmakovigilanční studie perorálních antivirotik indikovaných v léčbě COVID-19
- Jak souvisí postcovidový syndrom s poškozením mozku?
- Měli bychom postcovidový syndrom léčit antidepresivy?
- 10 bodů k očkování proti COVID-19: stanovisko České společnosti alergologie a klinické imunologie ČLS JEP
Nejčtenější v tomto čísle
- Lyme Disease: Call for a “Manhattan Project” to Combat the Epidemic
- Origin, Migration Routes and Worldwide Population Genetic Structure of the Wheat Yellow Rust Pathogen f.sp.
- IFNγ/IL-10 Co-producing Cells Dominate the CD4 Response to Malaria in Highly Exposed Children
- Human and Plant Fungal Pathogens: The Role of Secondary Metabolites