
Plasmacytoid Dendritic Cell Dynamics Tune Interferon-Alfa Production in SIV-Infected Cynomolgus Macaques
IFN-I production is a characteristic of HIV/SIV primary infections. However, acute IFN-I plasma concentrations rapidly decline thereafter. Plasmacytoid dendritic cells (pDC) are key players in this production but primary infection is associated with decreased responsiveness of pDC to TLR 7 and 9 triggering. IFNα production during primary SIV infection contrasts with increased pDC death, renewal and dysfunction. We investigated the contribution of pDC dynamics to both acute IFNα production and the rapid return of IFNα concentrations to pre-infection levels during acute-to-chronic transition. Nine cynomolgus macaques were infected with SIVmac251 and IFNα-producing cells were quantified and characterized. The plasma IFN-I peak was temporally associated with the presence of IFNα+ pDC in tissues but IFN-I production was not detectable during the acute-to-chronic transition despite persistent immune activation. No IFNα+ cells other than pDC were detected by intracellular staining. Blood-pDC and peripheral lymph node-pDC both lost IFNα− production ability in parallel. In blood, this phenomenon correlated with an increase in the counts of Ki67+-pDC precursors with no IFNα production ability. In tissues, it was associated with increase of both activated pDC and KI67+-pDC precursors, none of these being IFNα+ in vivo. Our findings also indicate that activation/death-driven pDC renewal rapidly blunts acute IFNα production in vivo: pDC sub-populations with no IFNα-production ability rapidly increase and shrinkage of IFNα production thus involves both early pDC exhaustion, and increase of pDC precursors.
Published in the journal:
. PLoS Pathog 10(1): e32767. doi:10.1371/journal.ppat.1003915
Category:
Research Article
doi:
https://doi.org/10.1371/journal.ppat.1003915
Summary
IFN-I production is a characteristic of HIV/SIV primary infections. However, acute IFN-I plasma concentrations rapidly decline thereafter. Plasmacytoid dendritic cells (pDC) are key players in this production but primary infection is associated with decreased responsiveness of pDC to TLR 7 and 9 triggering. IFNα production during primary SIV infection contrasts with increased pDC death, renewal and dysfunction. We investigated the contribution of pDC dynamics to both acute IFNα production and the rapid return of IFNα concentrations to pre-infection levels during acute-to-chronic transition. Nine cynomolgus macaques were infected with SIVmac251 and IFNα-producing cells were quantified and characterized. The plasma IFN-I peak was temporally associated with the presence of IFNα+ pDC in tissues but IFN-I production was not detectable during the acute-to-chronic transition despite persistent immune activation. No IFNα+ cells other than pDC were detected by intracellular staining. Blood-pDC and peripheral lymph node-pDC both lost IFNα− production ability in parallel. In blood, this phenomenon correlated with an increase in the counts of Ki67+-pDC precursors with no IFNα production ability. In tissues, it was associated with increase of both activated pDC and KI67+-pDC precursors, none of these being IFNα+ in vivo. Our findings also indicate that activation/death-driven pDC renewal rapidly blunts acute IFNα production in vivo: pDC sub-populations with no IFNα-production ability rapidly increase and shrinkage of IFNα production thus involves both early pDC exhaustion, and increase of pDC precursors.
Introduction
HIV-1 infection is characterized by chronic immune activation, a major cause of CD4 T-cell depletion and HIV/SIV-specific immunity dysfunction, and facilitating viral replication and progression to AIDS [1]. Simian immunodeficiency virus (SIV) infection in non human primates (NHP) leads to chronic immune activation and AIDS in macaques, but not in the natural African NHP hosts despite persistently high viremia [2]. Strong expression of interferon-stimulated genes (ISGs) in chronic infection distinguishes pathogenic from non-pathogenic models; this suggests that control of IFN-I responses is critical for HIV/SIV pathogenesis [2], [3], [4], [5]. Unraveling the underlying mechanisms of IFN-I induction and control may therefore reveal novel possibilities for new therapeutic strategies.
Acute interferon-alpha (IFNα) production is observed in both lymphoid and non-lymphoid tissues during primary Simian Immunodeficiency Virus (SIV) infection (PSI) [6], [7], but is barely detectable during the chronic stage of pathogenic HIV/SIV infection until the late symptomatic stage [4], [8], [9], [10]. The cellular source of IFN-I and site of its activity during the early chronic phase remain elusive, and the mechanism leading to the reduction of IFNα production during the acute-to-chronic transition phase of HIV/SIV infections have not been rigorously described [11].
Plasmacytoid dendritic cells (pDC) are bone marrow (BM)-derived antigen-presenting cells that are central to innate and adaptive immunity [12], [13]. They selectively express Toll-like receptors (TLR) 7 and 9 and their constitutive expression of interferon response factor 7 (IRF-7) makes them major IFN-I producing cells in response to viruses.
In vitro, pDC are activated by HIV/SIV particles [14], [15] and produce IFNα following sensing by TLR-7 [16], [17]. A small number of studies show that IFNα is produced in vivo by pDC: in the vaginal mucosa early after exposure [18] and in LN during acute infection [19] in SIV macaque models; and advanced chronic infection in HIV-1 infected patients [20], [21], [22]. During the chronic phase, other cell types in the spleen may also produce IFNα [23].
In contrast, pDC are quantitatively and functionally affected by HIV/SIV infection. During HIV infection pDC counts correlate negatively with viremia [24] and are predictive of progression [25], [26]. In Non Human Primates (NHP), pDC counts in blood decline, and this is inversely correlated with their recruitment in LN as early as during acute infection [5], [27]. In these tissues, pDC may play an important role in viral control and immune regulation, but there is a massive pDC death by apoptosis [27]. More recently, it was reported that HIV/SIV infection induces a rapid and long-lasting accumulation of pDC in the gut [28], [29] where they may contribute to inflammation and chronic immune activation. Conversely, the peripheral blood pDC pool becomes less able to produce IFNα in response to de novo re-stimulation with SIV and HSV [5], although this dysfunction partly recovers during the acute-to-chronic transition. A transient unresponsive state has also been observed during primary HIV-1 infection [30] and in late stage HIV-1 infection [31], and was suggested to be a consequence of a refractory stage acquired following pDC activation in vivo [32]. These observations contrast with in vitro data showing that stimulation of human pDC by HIV leads to persistent IFNα production and the acquisition of a partial activation phenotype, but not a refractory stage, as a result of HIV trafficking through a specific intra-cellular pathway in these cells [33].
Plasmacytoid DC turnover is increased during acute infection [27], [34] and this may contribute to the apparent dysfunction as a result of homeostatic processes. The human BM-pDC pool includes at least three sub-populations that produce no or little IFNα upon CpG stimulation [35]; these pools probably correspond to different stages of pDC precursors. The peripheral pDC pool seems to be mainly reconstituted by Ki67+ BM-derived pDC precursors during acute infection [27]. Therefore, we hypothesized that this homeostatic process may directly affect pDC activation and IFNα production in the periphery during SIV infection and may play a role in the observed rapid shrinkage of acute IFNα production.
In this study, we investigated the involvement of pDC in IFNα production in blood and tissues during the early stages of SIV infection in cynomolgus macaques (CyM) and studied the role of pDC sub-population dynamics in IFNα production. We report that pDC are major cell type responsible for the massive IFNα production during acute infection in both lymphoid tissues and gut in this species, and show that pDC dynamics, including both activation-driven exhaustion and increased renewal by bone marrow derived pDC precursors with no IFNα production capacity, accounts for the rapid decline of pDC responsiveness and consequent shut-down of acute IFNα production.
Results
Primary infection of CyM with SIVmac251 is characterized by a transient increase in the plasma IFNα concentration and by dynamic changes in pDC blood counts with no signs of activation
Nine CyM were infected with SIVmac251 and followed longitudinally (Table S1 and Figure S1). The viral RNA (vRNA) load peaked on day 9 or 10 p.i. at a mean 7.33±0.452 Log copies/mL (Figure 1A). Mean setpoint viremia was 4.21±0.815 Log copies/mL and one of the nine animals (Macaque #30742) displayed low setpoint viremia (2.34 Log copies/mL). CD4+ T-cell counts on day 28 were significantly below baseline levels (mean: 72.23%±12.57% of baseline) (Figure 1B) with CD4+ central memory T-cell counts particularly affected (mean: 52.14%±12.53% of baseline on day 28). Significant CD4+ T-cell count decline was observed in all animals, except #30742 (Figure 1B), and chronic CD8 T-cell immune activation (Figure 1C) was also evidenced at setpoint. Macaque #21362R was euthanized because of AIDS one year after infection (wasting syndrome, CD4 T-cells: 70 cells/µL, PVL: 5.14 Log copies/mL). The other animals remained clinically asymptomatic during this period.

There was a transient increase in the plasma IFN-I activity (Figure 1D), coinciding with the exponential increase of plasma viremia. IFN-I activities on days 7, 8 and 9 were positively correlated with plasma viral load (R = 0.631, p = 0.004) and peak values ranged from 356 to 7,942 IU/mL (mean: 3,504 IU/mL). Blood pDC counts were monitored in six macaques revealing a transient increase (mean 214±70% of baseline; p = 0.0313) on day 3 p.i. (Figure 1E, Figure S2), followed by a transient decrease on day 14 in five macaques. Plasmacytoid DC counts returned to baseline levels by day 35, and then progressively decreased in five of the six macaques, consistent with previous reports [5], [27]. Despite of these changes in the dynamics of circulating pDC, longitudinal analysis of HLA-DR and CCR7 expression levels (MFI) did not reveal any activation of circulating pDC (Figure 1F), IFNα remained undetectable by intracellular staining (Figure 1G), and IFNα mRNA expression measured be RT-qPCR in PBMC did not change at any time (data not shown).
These data show that despite dynamic changes in pDC numbers in primary infection these cells do not show any activation in the blood.
Plasmacytoid DC strongly contribute to IFNα production in peripheral lymph nodes (PLN) during acute infection
PLN were studied in the nine SIV-infected macaques of the longitudinal study. All were sampled at baseline, three on days 7, 8 and 9 p.i., and six on days 8, 9, 35 and month 3 (M3).
As pDC are the best candidates for the IFNα production observed, we analyzed pDC dynamics in PLN. Plasmacytoid DC counts were significantly higher in PLN of infected animals on days 9 and 35 p.i., than in uninfected macaques (Figure 2A), and a trend for higher pDC frequencies was still observed 3 months p.i.. IFNα+ pDC could hardly be detected in PLN at baseline by direct ex vivo intracellular staining, but were significantly increased in PLN on days 7, 8 (range 0% to 3.71%; p = 0.0078) and 9 (range 0.2310% to 4.754%; p = 0.0039) p.i. (Figure 2B and 2C). On and after day 35, IFNα+ cells could no longer be detected. This approach allowed, for the first time, quantification of IFNα-producing pDC in tissues during acute infection. To assess the contribution of viral components to induction of IFNα production by pDC, vRNA in PLN was assayed by qRT-PCR. Viral RNA peaked on day 8–9 p.i. and was significantly lower by day 35 than on day 9 (p = 0.031) (Figure S3 A). IFNα mRNA levels in LN correlated with viral RNA in PLN (R = 0.88, p = 0.003) (Figure S3 B). These results are consistent with the IFNα response being driven by viral components, and suggest that pDC in PLN are directly triggered by SIV vRNA. Indeed, the percentage of IFNα+ pDC correlated with both viral RNA load (Figure 2D) and IFNα mRNA level in whole tissue biopsies on day 9 (Figure 2E) (R = 0.783, p = 0.0172), suggesting that pDC-derived IFNα is produced in response to SIV and account for an important part of total IFNα production in PLN. Indeed, CD123− leukocytes did not show any significant increase of IFNα+ compared to baseline levels (Figure 2C and data not shown). A careful analysis of DC and macrophage subpopulations (gating described in Figure S2 C) did not reveal any increase of spontaneous IFNα production by these cells in lymph nodes (data not shown).
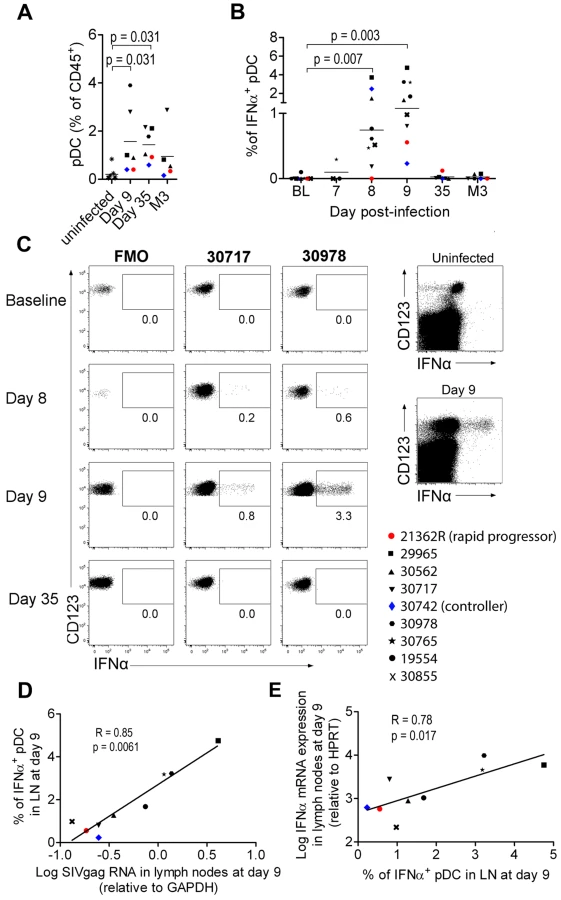
These various findings confirm that PLN pDC are involved in IFNα production during acute SIV infection in CyM, although production at low level in this or in other cell types below the threshold of our methods cannot be excluded.
Molecular and cellular analysis of various tissues reveals that pDC produce IFNα in both lymphoid and mucosal compartments during acute infection in CyM
The contribution of other tissues to IFNα production during acute infection was also explored in two macaques (#21175R, #31047) euthanized on day 10 p.i., and one non-infected control (cross-sectional analysis). Intracellular staining was used to track IFNα-producing cells. IFNα-producing pDC were detected in spleen, mesenteric LN, and some colon and ileum biopsies from these animals (Figure 3). The percentages of pDC that were IFNα-producers were similar to that observed in peripheral LN (0.8 to 3.7%).

Additional colon samples from 4 naïve macaques, 4 SIV-infected macaques at day 9 p.i., and 4 SIV-infected macaques in chronic infection, revealed increased pDC numbers in the colon on day 9 p.i., which persisted in chronic infection (data not shown). Remarkably, although the numbers of pDC were significantly increased in colon, numbers of pDC remained about ten fold lower than in lymph nodes. Intracellular IFNα was evidenced in colon pDC in day 9 samples, within the same range (1.5 to 4%), but were not detectable in chronic infection (data not shown).
Interestingly, in BM, which mostly contains pDC precursors that do not produce IFNα upon stimulation in vitro [35], intracellular IFNα was not detected in pDC. No other cell type was found to be positive for IFNα by intracellular staining in any of these tissues (data not shown).
These findings show that pDC are also major producers of systemic IFNα in various lymphoid and mucosal tissues during acute infection in CyM, and show persistent homing of pDC to the gut in the chronic phase.
Plasmacytoid DCs display a complex activation phenotype in tissues associated with massively increased CD95 expression and death during acute infection
The increase of CCR7high pDC in LN led us to analyze pDC activation further. The expression of CD40, CD86 and CD95 was studied by flow cytometry (Figure 4). In non-infected macaques, 77.1±18.4% of pDC expressed none of these three markers, activated pDC (expressing either CD40 and/or CD86) made up 8.6±6% of total pDC in PLN, and CD95 was expressed by 18.3±20.1%. On day 9 p.i., 29.1±22.5% of LN pDC (range: 13.8 to 67.5%) expressed CD40 or CD86, or both, evidence of a significant increase of activation (Figure 4A). Activated pDC also showed HLA-DRhigh expression (data not shown). An increase of CD95 expression was also observed and exceeded that of activated cells (Figure 4A). Indeed, on day 9 p.i., more than 95.0±2.9% of pDC expressed high CD95 levels. Activation of pDC and CD95 expression were both significantly reduced at setpoint but remained significantly higher than at baseline. Remarkably, dual-expression of CD40 and CD86, characteristic of the full activation phenotype, occurred in vivo. At setpoint, pDC showed much lower CD40/CD86 co-expression and higher monovalent CD86+ expression than during acute infection, suggesting that partial activation may occur in the absence of detectable IFNα. Interestingly, macaque #30742, which efficiently controlled viremia, displayed the lowest CD95 expression at setpoint suggesting that viral load may directly or indirectly sensitize pDC to apoptosis. The two macaques sacrificed on day 10 p.i. were used to explore pDC activation in other tissues and to analyze the phenotype of IFNα-producing pDC with antibodies against CD95, CD40, CD86 and IFNα. Plasmacytoid DC in all tissues in which IFNα production was observed displayed a similar activated phenotype (Figure 4B). Remarkably, no IFNα+ pDC were CD86+ (Figure 4B) or CD40+ (data not shown), suggesting that expression of these activation markers are later events than IFNα production, reminiscent of the kinetics we observed following TLR7/8 stimulation in vitro (data not shown). The large increase of CD95 expression on pDC was confirmed in all tissues explored including BM, spleen, LN and gut, and was associated with increased pDC death (Figure 4C) although the proportion of dead pDC (Blue-Vid+) was much lower than that of CD95+pDC.

Overall, the complexity of pDC phenotype in tissues suggests successive stages in pDC activation leading to immediate but transient IFNα production followed by a slower increase of the expression of activation markers, which is associated with a massive increase of both CD95 expression and cell death.
Impaired responsiveness of circulating blood pDC during acute infection correlates with increased non-functional pDC precursor frequencies
IFNα production by pDC was associated with increased numbers of these cells in tissues and increased death rate, suggesting high turnover. Consistent with reported increased numbers of BM-derived Ki67+ pDC in both peripheral blood and PLN of Rhesus Macaques (RhM) during acute infection as a consequence of LN homing [27], [34], we detected higher absolute counts and percentages of Ki67+pDC in the blood during acute infection than in baseline (Figure 5A). We then studied the potential contribution of the Ki67+ pDC increase to the altered responsiveness of circulating pDC as bone marrow pDC are weak IFNα producers upon stimulation [35], [36]. IFN-I production by blood pDC in response to SIV in vitro was significantly altered as early as 14 days p.i. (p = 0.031) (Figure 5B), and this defect was temporally associated with the increase in Ki67+ pDC counts. Moreover, the IFNα production ability of pDC was negatively correlated with the increase in Ki67+pDC counts in blood (R = 0.48, p = 0.006) (Figure 5C). This suggests that total pDC numbers decrease in the blood during acute infection, and are renewed by Ki67+ pDC egressing from the bone marrow, accounting for the decreased responsiveness of circulating pDC.

Macaque bone marrow pDC are poor IFN-I producers
As human BM contains several pDC precursor subpopulations with differential IFNα-production ability, we looked at the phenotype and the ability of CyM BM-pDC to produce IFNα. In non-infected CyM, the frequencies of Ki67+ and CD34+pDC among total pDC were higher in BM than in peripheral blood (Figure 6A), consistent with a recent report in humans [35]. The expression levels of HLA-DR and CD123 were also lower on BM pDC than on peripheral blood pDC (Figure 6A). Ki67+pDC did not produce IFNα in response to TLR7/8 ligands leading to a much lower IFNα production by BM than blood pDC (Figure 6B).

Thus, the BM-pDC pool includes several sub-populations of pDC, likely precursors as previously suggested for their human counterparts [35], which are mostly unable to produce IFNα in response to SIV stimulation. Consequently, the progressive increase of these subpopulations in blood during acute infection accounts for the observed decrease of IFNα production capacity by circulating pDC in primary infection.
Neither pDC expressing activation markers nor late pDC precursors produce IFNα in vivo and the counts of both increase in lymph nodes during acute infection
In RhM, the recruitment of pDC to LN during SIV infection is associated with increased pDC death and renewal [27], and with inflammation [9]. In our study, the increased proportion of Ki67+pDC in the blood was positively correlated with vRNA loads in both LN (R = 0.72, p = 0.0082) and rectum (R = 0.63, p = 0.026) (Figure 7A); this suggests that tissue vRNA drives the egress of precursors from the BM to the blood to reconstitute the pDC pool in tissues. Statistically significant increases of Ki67+ pDC were already observed in LN on day 9 p.i. (Figure 7B), and in other tissues in the two sacrificed animals, on day 10 p.i. (data not shown). We also observed a significant reduction of CD123 expression on pDC in LN on day 9 p.i. (Figure 7C): this may reflect either pDC activation, as we observed decreased CD123 expression after TLR-7/8 stimulation in vitro (data not shown), or increased proportions of late-stage pDC precursors [35] that have lost Ki67 expression before homing to LN. To better study the complexity of pDC dynamics in LN, we performed a principal component analysis (APS: Automated Population Separator, using Infinicyt software) of merged files from baseline and day 9 p.i. APS allowed a 2D-plot of pDC events based on the expression levels (MFI) of three markers: CCR7, CD123 and HLA-DR. Three distinct sub-populations in LN were individualized, and named pDC-a, pDC-b and pDC-c (Figure 7D). These populations had distinct phenotypes (Figure 7E): pDC-a displayed a steady-state immature pDC phenotype at baseline (CCR7lowHLA-DRintCD123high), pDC-b was CCR7lowHLA-DRlowCD123low resembling BM pDC, and pDC-c was CCR7highHLA-DRhighCD123low/high, and was most likely activated/matured pDC. The frequency of PDC-a/immature pDC significantly decreased after infection as the pDC-b/HLA-DRlow late precursors and pDC–c/activated-matured populations increased (Figure 7F). Although the percentage of pDC-a within total CD45+ LN cells increased significantly (Figure S4), remarkably, the expression of CD123 was significantly decreased on pDC-a at day 9 compared to baseline (p = 0.031). This change in pDCa phenotype indicates that their increase is mainly due to influx of pDC precursors.

IFNα-producing pDC were consistently HLA-DRint/high (Figure 7G and 7H). Very few HLA-DRlow pDC, corresponding to BM-pDC precursors (pDC-b), were IFNα+, consistent with their pDC precursor profile. Similar patterns were observed in all tissues in which IFNα+ pDC were detected (Figure 7H) in samples from the two animals sacrificed on day 10. Biopsies from these macaques at baseline contained sufficient cells for longitudinal monitoring of IFNα production by pDC after SIV stimulation. This production capacity was lower than baseline on day 9 (Figure 7I). These data were then confirmed by a cross-sectional study comparing biopsies from five uninfected macaques to those from five SIV-infected macaques on day 9 (Figure 7I).
These data show that pDC in PLN also loose responsiveness during acute infection concomitant with the increase of pDC sub-populations with no IFNα production ability i.e. pDC precursors and mature pDC. This dynamics likely contributes to the observed rapid decrease of IFNα production in tissues after acute phase, and the rapid disappearance of IFNα from plasma.
Discussion
This study in CyM revealed several new features of the dynamics of pDC and IFNα production during primary and early chronic infection with pathogenic SIVmac. Our analysis of pDC dynamics confirms that pDC are major contributors to the acute IFNα surge. IFNα production by pDC appeared transient during acute infection and correlates with viral loads in LN and in a wide array of other lymphoid and colorectal tissues. Following a peak of production of IFNα by pDC in tissues and IFNα concentration in the plasma, IFNα production rapidly decreases towards undetectable levels, coinciding with decreased pDC responsiveness ex vivo. We show for the first time that the transient impairment of IFNα production by pDC in response to SIV stimulation ex vivo is temporally associated and inversely correlated with an increase in the counts of non-functional Ki67+ BM-derived pDC in the blood. PDC responsiveness is also impaired in lymph nodes and this is associated with more complex dynamics including increased numbers of both pDC precursors expressing Ki67+ and/or low CD123/low HLA-DR, and activated/mature pDC. In addition we show that pDC are strongly activated during the acute infection and this activation persists during chronic infection, although to a lower level than during acute infection.
The major finding of this study is the contribution of the dynamics of pDC sub-populations to the regulation of IFNα production during acute infection. We show that transient impairment of pDC function during acute infection is a consequence of the increase of pDC precursors as a proportion of the circulating pDC pool. Previous studies showed that engagement of TLR-9 [37] or TLR-7 in vitro [32] drives pDC to a refractory stage resistant to de novo stimulation, and proposed that this could be responsible for pDC unresponsiveness during chronic viral infections [32]. In our model, the ability of circulating pDC to produce IFNα upon de novo SIV or HSV stimulation fell sharply (this study and [5]) but this phenomenon was not associated with any sign of pDC activation in this compartment in vivo. We showed that the relative increase in the numbers of Ki67+ pDC, probably recently egressed from the BM, is most likely to be responsible for this decreased responsiveness. Although BM is also a site of viral replication during SIV infection [38], we did not find any IFNα+ pDC in BM. This is consistent with the fact that the pDC pool in both human and RhM BM is mostly constituted of precursor cells which are not yet functional and have only a limited ability to secrete IFNα [35], [36]; here, we confirm that the pDC pool in CyM BM is similar. The peripheral pDC pool becomes exhausted through activation and apoptosis; pDC renewal replenishes this pool, but also regulates the numbers of functional cells, contributing to blunt acute IFNα production rapidly. Although we found a limited increase of early Ki67+ pDC precursors in tissues, the numbers of CD123low pDC also increased suggesting recruitment of BM-derived late precursor pDC, which also have limited IFNα production capacities [35]. These precursors were indeed not IFNα+ in vivo. In parallel, pDC in LN were activated (CCR7high and CD86+CD40+), but matured cells remained consistently IFNα−. The simultaneous increase of these sub-populations in lymphoid tissues coincided with a decrease of IFNα+ pDC in LN, which most likely contributes to the observed rapid decline of the IFNα concentration in plasma, at a time when virus replication is still high. The rapid blunting of acute IFNα production at around the time of peak viral load may reduce pDC antiviral efficacy, favor the spread of the virus and facilitate the formation of viral reservoirs. Increased pDC renewal during acute infection in our model is associated with massive CD95/Fas death receptor up-regulation on pDC and increased pDC death in all tissues studied, mostly observed during acute infection. Increased apoptosis of pDC has also been reported in HIV-1 infection [21] and is likely a driving force of pDC turnover. In mice, IFNα directly regulates pDC counts in vivo by inducing apoptosis [39], and may also regulate conventional DC turnover in vivo [40]. Therefore, IFNα may directly regulate both pDC count and pDC function (IFNα production) in our model. However, further investigations are required to determine the details of the mechanisms leading to pDC death in vivo in light of a recent report that mDCs are more prone to undergo apoptosis in response to death ligands during acute SIV infection [41].
Another finding in our study is that pDC are strongly activated in PLN during acute infection, displaying CD86 and CD40 co-expression as well as HLA-DR and CCR7 up-regulation. This further implicates pDC in the immune response to HIV/SIV infection. Only partial pDC activation during the chronic stage of HIV-1 infection has been described [21], [42]. The temporal association of this activation pattern with the detection of IFNα-producing pDC suggests that, during acute infection, pDC transiently produce IFNα upon sensing SIV or SIV infected cells, and then acquire other markers of activation and maturation. This complete activation may allow pDC to play a role in priming T-cell responses [43], [44] and contrasts with their partial activation reported after stimulation with inactivated HIV-1 particles in vitro [33]. Indeed, another report suggests that stimulation with HIV-infected activated T cells induces a more complete activation phenotype than stimulation with HIV particles in vitro [45]. The extent of pDC activation during primary infection suggests that these cells may display other immune functions and orchestrate immune responses in HIV/SIV primary infections, contributing to the cytokine/inflammatory environment, T-cell recruitment and activation in lymph nodes as previously shown in vaginal mucosa [18]. Further work is needed to unravel the complexity of pDC functions during acute and chronic infection.
To conclude, we show for the first time that the dynamics of pDC renewal, which is associated with recruitment, activation and death in lymphoid tissues, reflects the transient decrease of their capacity to produce IFNα in response to SIV during acute infection. Our results shows that this mechanism contributes to pDC unresponsiveness and likely blunt acute IFNα production during primary SIV infection, a mechanism probably transposable to human HIV-1 primary infection in which similar transient pDC deficiency was reported [30]. This transient exhaustion of the anti-viral capacity of the peripheral pDC pool may therefore favor the transition from acute to chronic infection. This new mechanism, which involves pDC renewal in the regulation of IFNα production in vivo, may also be relevant to other chronic viral infections when strong pDC activation and death occurs. Further exploration of pDC functions are needed to unravel their complex involvement in early anti-viral immunity and understand their contribution to HIV/SIV induced inflammation and pathogenesis.
Methods
Ethics statement
Adult CyM (Macaca fascicularis) were imported from Mauritius and housed in the facilities of the “Commissariat à l'Energie Atomique et aux Energies Alternatives” (CEA, Fontenay-aux-Roses, France). Non-human primates (NHP, which includes M. fascicularis) are used at the CEA in accordance with French national regulations and under the supervision of national veterinary inspectors (CEA Permit Number A 92-032-02). The CEA complies with the Standards for Human Care and Use of Laboratory Animals, of the Office for Laboratory Animal Welfare (OLAW, USA) under OLAW Assurance number #A5826-01. All experimental procedures were conducted according to European guidelines for animal care (European directive 86/609, “Journal Officiel des Communautés Européennes”, L358, December 18, 1986). The use of NHP at the CEA is also in conformity with the recommendations of the newly published European Directive (2010/63, recommendation N°9). The animals were used under the supervision of the veterinarians in charge of the animal facility. This study was scientifically reviewed and granted by the “Agence Nationale de Recherches sur le SIDA et les hépatites virales” and was accredited under statement numbers 12-007, 12-048 and 12–103, by the ethical committee “Comité d'Ethique en Expérimentation Animale du CEA” registered under number 44 by the French Ministry of Research.
Animals, infection, and sample collection
Male CyM weighing 5 to 10 kg were used. Fourteen animals were intravenously administered 5,000 animal infectious dose 50% (5,000AID50) of the isolate SIVmac251. Virus stock was kindly provided by Dr. A.M Aubertin (Université Louis Pasteur, Strasbourg, France). The experimental design and schedule of sampling are described in Table S1 and Figure S1. Nine of the macaques were subjected to longitudinal follow up: blood, LN and rectal samples were collected from six; and only LN samples were collected from three. Five SIV infected macaques were used for cross sectional sampling: two were sacrificed on day 10 post infection to allow analysis of diverse tissues, and three were sampled on day 9 for cross sectional analysis of pDC responsiveness. Twenty-two naive macaques were used as non-infected controls for cross sectional studies. Blood samples, BM aspirates, and LN and rectal biopsies were collected under general anesthesia by intra-muscular injection of 10 mg/kg ketamine (Rhone-Mérieux, Lyon, France). Blood samples were collected into BD Vacutainer Plus Plastic K3EDTA tubes (BD Biosciences, Le Pont de Claix, France). BM aspirates were taken at the iliac crest by punction. Tissue samples were collected in PBS containing 10 µg/mL Brefeldin A (Sigma-Aldritch, St-Louis, MO) or snap frozen in liquid nitrogen for storage at −80°C. Two macaques were sacrificed 10 days after infection by intravenous injection of 180 mg/kg sodium pentobarbital (CEVA santé animale S.A., La ballastiere, France) after general anesthesia with ketamine, and samples of spleen, ascending and descending colon, and mesenteric lymph nodes were harvested.
Cell preparation
Plasma was isolated from EDTA blood samples by centrifugation for 10 min at 950 g, and cryopreserved at −80°C. Experiments were performed on PBLs or suspensions of single cells extracted from tissue. PBLs were isolated from blood samples after red blood cell lysis by hypotonic shock and washing in PBS. Peripheral and mesenteric lymph node cells, and spleen cells, were obtained by mechanical dissociation using GentleMACS dissociator (Miltenyi Biotech, Paris, France). Suspensions were passed through a 70 µm-pore size cell-strainer, washed with PBS and red blood cells were lysed. Additional density gradient isolation was used for spleen cells before red blood cell lysis. Cell counts were determined with a Vi-CELL (Beckman-coulter, Paris, France). Suspensions of colorectal tissue cells were obtained from sacrificed animals by a protocol used for humans [46] adapted in-house to macaques. Briefly, 1 mm2 punches of mucosa were obtained from total ileum, and ascending and descending colon. These samples were treated for 45 min with collagenase II (Sigma-Aldricht) and mechanically disrupted with a 30-mL syringe equipped with an 18-gauge blunt-end needle and passage through a 70-µm-pore cell strainer. Cells were then isolated on a 44%/67.5% Percoll gradient [28].
Phenotypic characterization and intracellular IFNα staining
PBL isolated from 500 µl of blood or 2–4×10⁶ isolated LN cells were stained for dendritic cells. Aliquots of 50 µl of whole blood were stained for lymphocytes. All stainings, other than of whole blood, were performed after saturation of Fc receptors with healthy macaque serum (in-house production) for 20 min at 4°C. To evaluate cell viability and exclude dead cells from analysis, samples were incubated for 15 min with the amine-reactive dye Live/dead Fixable blue using a commercial dead-cell staining kit (Life technologies). Cells were then labeled with monoclonal antibodies (Table S2) for 15 min at room temperature, washed in PBS and fixed in CellFIX (BD biosciences). Plasmacytoid DCs were gated on CD123+HLA-DR+ in lineage− cells as previously described [47].
For intra-cellular IFNα labeling, cells isolated from 500 µl of blood or 2–4×10⁶ LN cells were incubated at 37°C for 30 min with 10 µg/mL of Brefeldin A (Sigma-Aldrich). Fc receptor saturation and dead cell staining were performed as described above before intracellular labeling of IFNα. All steps were as previously described [47].
A BD LSRII apparatus equipped with four lasers (355, 405, 488 and 633 nm) was used to acquire data, and data was analyzed with FlowJo v7.6 (Tree Star, Ashland, OR) or Infinicyt v1.6 (Cytognos, Salamanca, Spain) software.
For longitudinal follow-up, acquisition was performed after calibrations with fluorochrome-tagged beads (BD cytometer setup and tracking beads) and using automated application settings. Additionally, fluorescence minus one controls were performed at each time point as intra assay control. For some experiments, flow data were formatted with Pestle v1.6.2 software (Mario Roederer, Vaccine Research Center, National Institute of Allergy and Infectious Diseases, National Institutes of Health) to facilitate the use of SPICE v5.2 [48].
T-cell and pDC quantification
Absolute counts were calculated from lymphocyte counts obtained by automated cell counting (Coulter MDII; Coultronics, Villepinte, France) combined with flow cytometry data: for lymphocyte counts, the CD4 and CD8 cells as a percentage of the CD45+CD3+ gate was multiplied by the lymphocyte count. Absolute pDC counts were determined as the product of total leukocyte counts and the percentage of pDC in the CD45+ gate.
In vitro stimulation
PBL prepared from 300 µl of blood were cultured for 24 h in RPMI-1640 medium with AT-2-inactivated SIVmac239 (equivalent to 560 ng/mL p27) in a final volume of 200 µl. Supernatants were collected and stored at −80°C until use for IFN-I titration. Negative controls included using the same concentration of AT-2-treated SupT1 micro vesicles. AT-2-inactivated SIVmac239 (ARP1018.1) and its negative control (ARP1018.2) were obtained from Dr Jeff Lifson (National Cancer Institute, Frederick, MD), through the EU Program EVA Centralized Facility for AIDS reagents (National Institute for Biological Standards and Control, Potters Bar, United Kingdom).
RNA extraction and cDNA synthesis
Tissue lysates were obtained by mechanical disruption of tissue samples in RLT buffer (Qiagen, Courtaboeuf, France) with a Precellys system, using 18 CK tubes and ceramic beads (Bertin Technologies, Montigny-le-Bretonneux, France). Tissue lysates were diluted to 30 mg/mL in RLT buffer, aliquoted and stored at −80°C. Tissue lysates were passed through a QiaShredder (Qiagen) for homogenization, and total RNA was extracted using RNeasy MiniKits (Qiagen) according to the manufacturer's recommendations. To avoid genomic DNA contamination, an additional DNAse step was included after the RNAse-free DNAse Set (Qiagen) used according to the kit instructions. The QuantiTect Rev-Transcription kit (Qiagen) was used to produce cDNA.
Quantification of type I IFN mRNAs
Quantitative RT-PCR was used to assay IFNα. Briefly, the Quantitect Rev-transcriptase Kit (Qiagen) was used to synthesize cDNA, and pre-PCRs were run in triplicate for each sample using FastStart Taq DNA polymerase (Roche Diagnostics, Meylan, France). A preparation of a plasmid containing macaque IFNα or IFNβ gene of known concentration was amplified during pre-PCR runs as a standard for subsequent qPCR amplification. Quantative PCR was performed with each sample on a Lightcycler using SYBRgreen (Roche) and 0.2 µl of FastStart Taq (Roche) in a final volume of 25 µl. Primers (Table S3) consensus primers for all IFNα subtypes (pan-IFNα in Table S3) were used: pre-PCR (OUT primers) (10 min at 95°C and 21 times (30 s,94°; 30 s,60°C; 4 min,72°C) and qPCR (internal primers) and qPCR (IN primers)(5 min at 95°C and 40 times (10 s,95°; 6 s,60°C; 15 min,72°C) followed by a melting curve). Direct qPCR on extracted RNA with no RT step was used as a negative control for all samples to test for and discard any RNA sample containing genomic DNA. IFN-I activity in plasma was determined with a bioassay measuring the reduction of the cytopathic effect of vesicular stomatitis virus in Madin-Darby bovine kidney cells [49]. The number of surviving cells was determined by MTT dye assay. Antiviral activity is expressed as IC50. The IC50 was defined as the concentration that was required for 50% protection against VSV-induced cytopathic effects.
Viral RNA quantification in tissues and plasma
Plasma and tissue vRNA was assayed as previously described [50] and [51] using the primers and probes listed in Tables S3 and S4.
Data visualization and statistical analysis
Some sets of data were visualized with Tableau Desktop 7.0 software (Tableau Software, Seattle, WA) before statistical analysis. The nonparametric Spearman rank correlation test was used to investigate the relationship between variables. The nonparametric Mann-Whitney test was used to compare groups of macaques after validation with the Kruskall-Wallis test, and the nonparametric Wilcoxon rank sum test was used to compare dependent data (same macaques at different time points) before and after SIV infection. GraphPad Prism 5.03 software (GraphPad software, La Jolla, USA) was used for all statistical analyses. In 2-tailed tests, p values of 0.05 or lower were considered significant.
Supporting Information
Zdroje
1. DouekDC, RoedererM, KoupRA (2009) Emerging concepts in the immunopathogenesis of AIDS. Annu Rev Med 60 : 471–484.
2. ChahroudiA, BosingerSE, VanderfordTH, PaiardiniM, SilvestriG (2012) Natural SIV hosts: showing AIDS the door. Science 335 : 1188–1193.
3. BosingerSE, LiQ, GordonSN, KlattNR, DuanL, et al. (2009) Global genomic analysis reveals rapid control of a robust innate response in SIV-infected sooty mangabeys. J Clin Invest 119 : 3556–3572.
4. JacquelinB, MayauV, TargatB, LiovatAS, KunkelD, et al. (2009) Nonpathogenic SIV infection of African green monkeys induces a strong but rapidly controlled type I IFN response. J Clin Invest 119 : 3544–3555.
5. MalleretB, ManeglierB, KarlssonI, LebonP, NascimbeniM, et al. (2008) Primary infection with simian immunodeficiency virus: plasmacytoid dendritic cell homing to lymph nodes, type I interferon, and immune suppression. Blood 112 : 4598–4608.
6. AbelK, RockeDM, ChohanB, FrittsL, MillerCJ (2005) Temporal and anatomic relationship between virus replication and cytokine gene expression after vaginal simian immunodeficiency virus infection. J Virol 79 : 12164–12172.
7. EaslickJ, SzubinR, LantzS, BaumgarthN, AbelK (2010) The early interferon alpha subtype response in infant macaques infected orally with SIV. J Acquir Immune Defic Syndr 55 : 14–28.
8. AbbJ (1987) Interferon-Alpha in Sera of Hiv-Infected Patients. Lancet 2 : 1092–1093.
9. Campillo-GimenezL, LaforgeM, FayM, BrusselA, CumontMC, et al. (2010) Nonpathogenesis of simian immunodeficiency virus infection is associated with reduced inflammation and recruitment of plasmacytoid dendritic cells to lymph nodes, not to lack of an interferon type I response, during the acute phase. J Virol 84 : 1838–1846.
10. ChehimiJ, PapasavvasE, TomescuC, GekongeB, AbdulhaqqS, et al. (2010) Inability of plasmacytoid dendritic cells to directly lyse HIV-infected autologous CD4+ T cells despite induction of tumor necrosis factor-related apoptosis-inducing ligand. J Virol 84 : 2762–2773.
11. HughesR, TowersG, NoursadeghiM (2012) Innate immune interferon responses to human immunodeficiency virus-1 infection. Rev Med Virol 22 : 257–266.
12. GillietM, CaoW, LiuYJ (2008) Plasmacytoid dendritic cells: sensing nucleic acids in viral infection and autoimmune diseases. Nat Rev Immunol 8 : 594–606.
13. ColonnaM, TrinchieriG, LiuYJ (2004) Plasmacytoid dendritic cells in immunity. Nat Immunol 5 : 1219–1226.
14. FonteneauJF, LarssonM, BeignonAS, McKennaK, DasilvaI, et al. (2004) Human immunodeficiency virus type 1 activates plasmacytoid dendritic cells and concomitantly induces the bystander maturation of myeloid dendritic cells. J Virol 78 : 5223–5232.
15. TeleshovaN, KenneyJ, JonesJ, MarshallJ, Van NestG, et al. (2004) CpG-C immunostimulatory oligodeoxyribonucleotide activation of plasmacytoid dendritic cells in rhesus macaques to augment the activation of IFN-gamma-secreting simian immunodeficiency virus-specific T cells. J Immunol 173 : 1647–1657.
16. BeignonAS, McKennaK, SkoberneM, ManchesO, DaSilvaI, et al. (2005) Endocytosis of HIV-1 activates plasmacytoid dendritic cells via Toll-like receptor-viral RNA interactions. J Clin Invest 115 : 3265–3275.
17. MandlJN, BarryAP, VanderfordTH, KozyrN, ChavanR, et al. (2008) Divergent TLR7 and TLR9 signaling and type I interferon production distinguish pathogenic and nonpathogenic AIDS virus infections. Nat Med 14 : 1077–1087.
18. LiQ, EstesJD, SchlievertPM, DuanL, BrosnahanAJ, et al. (2009) Glycerol monolaurate prevents mucosal SIV transmission. Nature 458 : 1034–1038.
19. HarrisLD, TabbB, SodoraDL, PaiardiniM, KlattNR, et al. (2010) Downregulation of robust acute type I interferon responses distinguishes nonpathogenic simian immunodeficiency virus (SIV) infection of natural hosts from pathogenic SIV infection of rhesus macaques. J Virol 84 : 7886–7891.
20. LehmannC, HarperJM, TaubertD, HartmannP, FatkenheuerG, et al. (2008) Increased interferon alpha expression in circulating plasmacytoid dendritic cells of HIV-1-infected patients. J Acquir Immune Defic Syndr 48 : 522–530.
21. LehmannC, LaffertyM, Garzino-DemoA, JungN, HartmannP, et al. (2010) Plasmacytoid dendritic cells accumulate and secrete interferon alpha in lymph nodes of HIV-1 patients. PLoS One 5: e11110.
22. LehmannC, TaubertD, JungN, FatkenheuerG, van LunzenJ, et al. (2009) Preferential upregulation of interferon-alpha subtype 2 expression in HIV-1 patients. AIDS Res Hum Retroviruses 25 : 577–581.
23. NascimbeniM, PerieL, ChorroL, DiocouS, KreitmannL, et al. (2009) Plasmacytoid dendritic cells accumulate in spleens from chronically HIV-infected patients but barely participate in interferon-alpha expression. Blood 113 : 6112–6119.
24. SabadoRL, O'BrienM, SubediA, QinL, HuN, et al. (2010) Evidence of dysregulation of dendritic cells in primary HIV infection. Blood 116 : 3839–3852.
25. GengW, FanX, DiaoY, CuiH, SunH, et al. (2011) Rapid disease progression in HIV-1-infected men who have sex with men is negatively correlated with peripheral plasmacytoid dendritic cell counts at the early stage of primary infection. J Clin Immunol 31 : 882–890.
26. CavaleiroR, BaptistaAP, SoaresRS, TendeiroR, FoxallRB, et al. (2009) Major depletion of plasmacytoid dendritic cells in HIV-2 infection, an attenuated form of HIV disease. PLoS Pathog 5: e1000667.
27. BrownKN, WijewardanaV, LiuX, Barratt-BoyesSM (2009) Rapid influx and death of plasmacytoid dendritic cells in lymph nodes mediate depletion in acute simian immunodeficiency virus infection. PLoS Pathog 5: e1000413.
28. KwaS, KannanganatS, NigamP, SiddiquiM, ShettyRD, et al. (2011) Plasmacytoid dendritic cells are recruited to the colorectum and contribute to immune activation during pathogenic SIV infection in rhesus macaques. Blood 118 : 2763–2773.
29. ReevesRK, EvansTI, GillisJ, WongFE, KangG, et al. (2012) SIV infection induces accumulation of plasmacytoid dendritic cells in the gut mucosa. J Infect Dis 206 : 1462–1468.
30. KamgaI, KahiS, DeveliogluL, LichtnerM, MaranonC, et al. (2005) Type I interferon production is profoundly and transiently impaired in primary HIV-1 infection. J Infect Dis 192 : 303–310.
31. Fitzgerald-BocarslyP, JacobsES (2010) Plasmacytoid dendritic cells in HIV infection: striking a delicate balance. J Leukoc Biol 87 : 609–620.
32. TiltonJC, ManionMM, LuskinMR, JohnsonAJ, PatamawenuAA, et al. (2008) Human immunodeficiency virus viremia induces plasmacytoid dendritic cell activation in vivo and diminished alpha interferon production in vitro. J Virol 82 : 3997–4006.
33. O'BrienM, ManchesO, SabadoRL, BarandaSJ, WangY, et al. (2011) Spatiotemporal trafficking of HIV in human plasmacytoid dendritic cells defines a persistently IFN-alpha-producing and partially matured phenotype. J Clin Invest 121 : 1088–1101.
34. KaderM, SmithA, GuiducciC, WonderlichE, NormolleD, et al. (2013) Blocking TLR7 - and TLR9-mediated IFN-alpha production by plasmacytoid dendritic cells does not diminish immune activation in early SIV infection. Plos Pathogens 9 (7) e1003530.
35. Martin-MartinL, AlmeidaJ, Hernandez-CampoPM, SanchezML, LecrevisseQ, et al. (2009) Immunophenotypical, morphologic, and functional characterization of maturation-associated plasmacytoid dendritic cell subsets in normal adult human bone marrow. Transfusion 49 : 1692–1708.
36. ReevesRK, FultzPN (2008) Characterization of plasmacytoid dendritic cells in bone marrow of pig-tailed macaques. Clin Vaccine Immunol 15 : 35–41.
37. ItoT, KanzlerH, DuramadO, CaoW, LiuYJ (2006) Specialization, kinetics, and repertoire of type 1 interferon responses by human plasmacytoid predendritic cells. Blood 107 : 2423–2431.
38. KitagawaM, LacknerAA, MartfeldDJ, GardnerMB, DandekarS (1991) Simian immunodeficiency virus infection of macaque bone marrow macrophages correlates with disease progression in vivo. Am J Pathol 138 : 921–930.
39. SwieckiM, WangY, VermiW, GilfillanS, SchreiberRD, et al. (2011) Type I interferon negatively controls plasmacytoid dendritic cell numbers in vivo. J Exp Med 208 : 2367–2374.
40. MatteiF, BracciL, ToughDF, BelardelliF, SchiavoniG (2009) Type I IFN regulate DC turnover in vivo. Eur J Immunol 39 : 1807–1818.
41. LaforgeM, Campillo-GimenezL, MonceauxV, CumontMC, HurtrelB, et al. (2011) HIV/SIV Infection Primes Monocytes and Dendritic Cells for Apoptosis. Plos Pathogens 7: e1002087.
42. DillonSM, RobertsonKB, PanSC, MawhinneyS, MeditzAL, et al. (2008) Plasmacytoid and myeloid dendritic cells with a partial activation phenotype accumulate in lymphoid tissue during asymptomatic chronic HIV-1 infection. J Acquir Immune Defic Syndr 48 : 1–12.
43. HoeffelG, RipocheAC, MatheoudD, NascimbeniM, EscriouN, et al. (2007) Antigen crosspresentation by human plasmacytoid dendritic cells. Immunity 27 : 481–492.
44. ManchesO, FernandezMV, PlumasJ, ChaperotL, BhardwajN (2012) Activation of the noncanonical NF-kappaB pathway by HIV controls a dendritic cell immunoregulatory phenotype. Proc Natl Acad Sci U S A 109 : 14122–14127.
45. SchmidtB, AshlockBM, FosterH, FujimuraSH, LevyJA (2005) HIV-infected cells are major inducers of plasmacytoid dendritic cell interferon production, maturation, and migration. Virology 343 : 256–266.
46. ShacklettBL, CritchfieldJW, LemongelloD (2009) Isolating mucosal lymphocytes from biopsy tissue for cellular immunology assays. Methods Mol Biol 485 : 347–356.
47. MalleretB, KarlssonI, ManeglierB, BrochardP, DelacheB, et al. (2008) Effect of SIVmac infection on plasmacytoid and CD1c+ myeloid dendritic cells in cynomolgus macaques. Immunology 124 : 223–233.
48. RoedererM, NozziJL, NasonMC (2011) SPICE: exploration and analysis of post-cytometric complex multivariate datasets. Cytometry A 79 : 167–174.
49. AnkelH, WestraDF, Welling-WesterS, LebonP (1998) Induction of interferon-alpha by glycoprotein D of herpes simplex virus: a possible role of chemokine receptors. Virology 251 : 317–326.
50. KarlssonI, MalleretB, BrochardP, DelacheB, CalvoJ, et al. (2007) Dynamics of T-cell responses and memory T cells during primary simian immunodeficiency virus infection in cynomolgus macaques. J Virol 81 : 13456–13468.
51. ManniouiA, BourryO, SellierP, DelacheB, BrochardP, et al. (2009) Dynamics of viral replication in blood and lymphoid tissues during SIVmac251 infection of macaques. Retrovirology 6 : 106.
Štítky
Hygiena a epidemiologie Infekční lékařství LaboratořČlánek vyšel v časopise
PLOS Pathogens
2014 Číslo 1
- Farmakovigilanční studie perorálních antivirotik indikovaných v léčbě COVID-19
- Jak souvisí postcovidový syndrom s poškozením mozku?
- Měli bychom postcovidový syndrom léčit antidepresivy?
- 10 bodů k očkování proti COVID-19: stanovisko České společnosti alergologie a klinické imunologie ČLS JEP
Nejčtenější v tomto čísle
- Lyme Disease: Call for a “Manhattan Project” to Combat the Epidemic
- Origin, Migration Routes and Worldwide Population Genetic Structure of the Wheat Yellow Rust Pathogen f.sp.
- IFNγ/IL-10 Co-producing Cells Dominate the CD4 Response to Malaria in Highly Exposed Children
- Human and Plant Fungal Pathogens: The Role of Secondary Metabolites