
Origin, Migration Routes and Worldwide Population Genetic Structure of the Wheat Yellow Rust Pathogen f.sp.
Analyses of large-scale population structure of pathogens enable the identification of migration patterns, diversity reservoirs or longevity of populations, the understanding of current evolutionary trajectories and the anticipation of future ones. This is particularly important for long-distance migrating fungal pathogens such as Puccinia striiformis f.sp. tritici (PST), capable of rapid spread to new regions and crop varieties. Although a range of recent PST invasions at continental scales are well documented, the worldwide population structure and the center of origin of the pathogen were still unknown. In this study, we used multilocus microsatellite genotyping to infer worldwide population structure of PST and the origin of new invasions based on 409 isolates representative of distribution of the fungus on six continents. Bayesian and multivariate clustering methods partitioned the set of multilocus genotypes into six distinct genetic groups associated with their geographical origin. Analyses of linkage disequilibrium and genotypic diversity indicated a strong regional heterogeneity in levels of recombination, with clear signatures of recombination in the Himalayan (Nepal and Pakistan) and near-Himalayan regions (China) and a predominant clonal population structure in other regions. The higher genotypic diversity, recombinant population structure and high sexual reproduction ability in the Himalayan and neighboring regions suggests this area as the putative center of origin of PST. We used clustering methods and approximate Bayesian computation (ABC) to compare different competing scenarios describing ancestral relationship among ancestral populations and more recently founded populations. Our analyses confirmed the Middle East-East Africa as the most likely source of newly spreading, high-temperature-adapted strains; Europe as the source of South American, North American and Australian populations; and Mediterranean-Central Asian populations as the origin of South African populations. Although most geographic populations are not markedly affected by recent dispersal events, this study emphasizes the influence of human activities on recent long-distance spread of the pathogen.
Published in the journal:
. PLoS Pathog 10(1): e32767. doi:10.1371/journal.ppat.1003903
Category:
Research Article
doi:
https://doi.org/10.1371/journal.ppat.1003903
Summary
Analyses of large-scale population structure of pathogens enable the identification of migration patterns, diversity reservoirs or longevity of populations, the understanding of current evolutionary trajectories and the anticipation of future ones. This is particularly important for long-distance migrating fungal pathogens such as Puccinia striiformis f.sp. tritici (PST), capable of rapid spread to new regions and crop varieties. Although a range of recent PST invasions at continental scales are well documented, the worldwide population structure and the center of origin of the pathogen were still unknown. In this study, we used multilocus microsatellite genotyping to infer worldwide population structure of PST and the origin of new invasions based on 409 isolates representative of distribution of the fungus on six continents. Bayesian and multivariate clustering methods partitioned the set of multilocus genotypes into six distinct genetic groups associated with their geographical origin. Analyses of linkage disequilibrium and genotypic diversity indicated a strong regional heterogeneity in levels of recombination, with clear signatures of recombination in the Himalayan (Nepal and Pakistan) and near-Himalayan regions (China) and a predominant clonal population structure in other regions. The higher genotypic diversity, recombinant population structure and high sexual reproduction ability in the Himalayan and neighboring regions suggests this area as the putative center of origin of PST. We used clustering methods and approximate Bayesian computation (ABC) to compare different competing scenarios describing ancestral relationship among ancestral populations and more recently founded populations. Our analyses confirmed the Middle East-East Africa as the most likely source of newly spreading, high-temperature-adapted strains; Europe as the source of South American, North American and Australian populations; and Mediterranean-Central Asian populations as the origin of South African populations. Although most geographic populations are not markedly affected by recent dispersal events, this study emphasizes the influence of human activities on recent long-distance spread of the pathogen.
Introduction
Domestication of ecosystems, climate change and the expanding global trade have accelerated the pace of pathogen emergence and spread [1], [2]. Widely distributed and genetically homogenous crop genotypes are conducive for rapid pathogen emergence and subsequent propagation across large areas. Even when novel pathogens are initially endemic to restricted geographical areas, they can rapidly emerge in new regions, provided they encounter a farmland with susceptible hosts and favorable environmental conditions. In widely grown food crops, many pathogens were introduced long ago, now being geographically widespread, and therefore they do not come to mind when considering invasive pathogens [3]. Although introductions could have occurred centuries ago, the evolution of such ubiquitous pathogens remains a significant cause of concern due to the risk of re-emergence caused by accidental dissemination of new, multi-virulent races [4], [5] or new, highly aggressive strains [6]. An accurate understanding of the origin, distribution of diversity reservoirs and past and recent migration routes of these pathogens is crucial to understand current epidemics, develop risk-assessment models and alleviate the potential adverse effects of disease emergence [7], [8]. This is particularly true for pathogens capable of long-distance migration, for which any newly advantageous mutant (increased virulence, aggressiveness or resistance to fungicides) has the potential to spread over large geographical area [9].
Yellow (stripe) rust on wheat, which is caused by Puccinia striiformis f.sp. tritici (PST), is present in most wheat-growing regions of the world [5], [10], [11], [12], [13], [14]. The pathogen has major negative impacts on wheat production due to re-emergences and invasions [5], [6], [15]. As for most ubiquitous pathogens of major crops, the origin, introduction pathways and current population structure of wheat yellow rust remains largely unknown. Although an origin in Transcaucasia has been hypothesized based on disease prevalence and geographical barriers [16], [17], it has never been assessed in light of new knowledge on the population structure of PST. Long-distance dispersal by wind is thought to play a key role in the dissemination of the disease. The fungus is capable of long-distance migration, with well-documented cases of recurrent re-establishment of pathogen populations in areas where there are no host plants during summer/winter to allow the pathogen survival, as for the main wheat-growing provinces of north-eastern China [9]. Such spread can be due to successive jumps from field to field by this polycyclic disease throughout the season (as in the USA [18]), as well as direct long-distance migration caused by winds, as documented between England and Denmark [19]. Accidental spore transport via human travel may also contribute to the intercontinental dispersal of the pathogen, as exemplified by the introduction of PST into Australia in 1979 from Europe through contaminated clothing or goods [15].
Despite the capacity for long-distance migration, the worldwide spread of PST is relatively recent, with most emergences reported only within the last decades. The pathogen reached South Africa in 1996 from an unknown source, but the first pathotypes detected were similar to those present in the Middle East and Mediterranean regions [6], [20]. PST was first reported in South America in the early 20th century, with an unknown origin [16], [21]. More recently, an expansion of the geographic range of PST into the warm climate of south-eastern USA [22] was shown to be due to the emergence of an aggressive strain adapted to higher temperatures than usually reported to be optimal for PST [23], [24]. The same genotype was found in Australia two years later, while another closely related one was observed in Europe, Central and West Asia and East Africa [6]. In addition to recently colonized areas, the disease is known to periodically re-emerge through the acquisition of new virulences. These events are well documented for pathotypes carrying virulence against resistance gene Yr9, with a first report in 1986 in Eastern Africa (Ethiopia) and subsequent invasions of the Middle East, Pakistan and India, reaching Bangladesh in only 12 years [5]. The geographical origins of most of the emerging strains are unknown. The population structure of PST is therefore likely to display the hallmarks of a complex mixture of re-emergences over continuous wheat-growing areas and rare founder events due to long-distance migration. Recent spreads of the disease are likely to induce marked changes in patterns of population differentiation among regions, potentially erasing the signature of more ancient colonization events.
Several recent studies, using different genetic markers, investigated the population structure of PST over relatively large geographic scales. Analyses revealed an overall clonal population structure with low genetic diversity worldwide [15], [25], [26], [27], except China and Pakistan [28], [29]. Continental dispersal of the pathogen was well evidenced [30], leading to the conclusion that a newly emerged strain/pathotype can sweep all the worldwide populations [9], [26]. However, despite the importance of this pathogen and increased research efforts, aspects of the worldwide population structure of the pathogen, both in terms of population subdivision and diversity, remain undetermined.
In the present study, we assembled a representative set of isolates from a larger collection of PST populations from the worldwide geographical range of the fungus and analyzed their genetic variability using a single set of highly variable genetic markers. Our objectives were: (i) to identify the main genetic groups in modern PST populations; (ii) to test the Himalayan region as putative centre of diversity; and (iii) to identify the geographical origin of recently emerged populations and investigate the ancestral relationships among geographically spaced populations.
Materials and Methods
Selection of isolates
A set of 409 isolates was selected to represent 11 geographical regions on six continents (Africa, Asia, Australia, Europe, North America and South America) from a collection of more than 4,000 isolates available at Institut National de la Recherche Agronomique (INRA), France and the Global Rust Reference Centre, Aarhus University, Denmark. The selection was made to maximize the representation of each population (partially assessed previously by AFLP, microsatellites and/or virulence profiles [6], [10], [25], [28], [29], [31], [32]), while balancing the number of isolates for each previously described genetic group, and trying to cover the geographic distribution of each. Isolates representative of aggressive strains were selected from the two recently emerged aggressive strains, PstS1 (associated with the post-2000 epidemics in the USA and Australia), and the Euro-Asian strain, PstS2, as well as a set of aggressive isolates frequently reported in Southern Europe, PstS3, which were less aggressive than PstS1 and PstS2 [24]. Isolates from the recently invading populations (e.g. South Africa) were included to infer on their source using non-parametric and Structure analyses, and were therefore not included in population-based analyses. Details regarding the number of isolates are shown in Table 1.

Molecular genotyping
For most isolates, DNA was already available, having been previously extracted through modified CTAB protocols [19], [33]. For isolates from Pakistan (2008), Nepal (2008) and China (2005), DNA was extracted from 5 mg of spores following Ali et al. [34]. All of the isolates were multiplied from single pustule lesions to avoid a mixture of genotypes. Molecular genotyping was carried out using a set of 20 microsatellite loci in three multiplex reactions, with subsequent separation of the PCR products using a Beckman Coulter CEQ-8000 DNA Analyzer. Electrophorograms were processed using the CEQ-8000 Genetic Analysis System Software (Beckman Coulter [34]).
Analyses of population subdivision
We investigated the existence of different genetic pools of PST using both multivariate and model-based Bayesian clustering approaches. These methods avoid the clustering of individuals on a priori knowledge such as geographical locations that may artificially group different genetic lineages introduced in the same area, hindering the detection of admixture events among them [35]. Multivariate analyses were carried out using discriminant analyses of principal components, implemented in the Adegenet package in R environment [36]. The number of clusters was identified based on the Bayesian Information Criterion (BIC), as suggested by Jombart et al. [36].
The model-based Bayesian method implemented in Structure 2.2 [37] was mostly used to confirm results of multivariate analyses, bearing in mind that this method makes the assumption of linkage equilibrium and that violations of this hypothesis for instance due to asexual reproduction can lead to spurious assignments and overestimate the number of clusters [38]. The rationale of this method is to assign multilocus genotypes to different clusters while minimizing the Hardy-Weinberg disequilibrium and the gametic phase disequilibrium between loci within clusters (where the number of clusters may be unknown). The Monte Carlo Markov Chain (MCMC) sampling scheme was run for 200,000 iterations with a 100,000 burn-in period, with K ranging from 1 to 10 and 20 independent replications for each K. The Structure outputs were processed with Clumpp [39]; a G′-statistic greater than 80% was used to assign groups of runs to a common clustering pattern.
The relatedness among geographically spaced populations was plotted using a neighbor-joining population tree based on the genetic distance DA [40], as implemented in the Population program [41]. Significance was assessed using 1,000 bootstraps. The level of population differentiation was assessed using pairwise FST statistics among pairs of populations (GENETIX 4.05.2 [42]).
Analyses of genetic variability and recombination
The quality of the set of markers, with respect to the inference of population structure, was tested by assessing the ability of the set of microsatellite loci to detect multilocus genotypes (MLGs) under panmixia, using Genclone [43]. The redundancy of the set of loci was tested by estimating the linkage disequilibrium among different loci and generating 1,000 random permutations with Genetix 4.05.2 [42]. Within-population variability was assessed using allele richness and gene diversity, calculated with Fstat 2.9.3 [44]. Genotypic diversity was estimated with MultiLocus 1.3 [45]. Private allelic richness was estimated using a rarefaction approach, implemented in Adze [46]. Observed (Ho) and unbiased expected heterozygosity (He) were computed using Genetix 4.05.2 [42]. The null hypothesis of the Hardy-Weinberg equilibrium within each population was tested using the exact test implemented in Genepop 4.0 [47]. Calculations were performed both on the whole dataset and on the clone-corrected data (i.e., a dataset in which only one representative of each repeated MLG is kept). Only the clone-corrected data are reported in cases where the two datasets yielded different results because the sampling during epidemics would result in over-representation of certain clones due to the recent clonal burst at local and seasonal scale, which may bias the population genetic analyses [48].
Ancestral relationship and migration patterns among populations
We used approximate Bayesian computation (ABC) to compare different competing scenarios describing ancestral relationship among populations. The approach bypasses the calculation of exact likelihoods rendering it efficient for complex population genetic models such as those underlying biological invasions [49], [50]. The rationale is to simulate datasets assuming different parameter values under different scenarios to estimate posterior probabilities of competing scenarios and the posterior distributions of the demographic parameters under a given scenario using comparisons between simulated and observed data sets based on summary statistics (e.g. genetic distance between populations). As different scenarios compared were defined based on the results of population structure analyses, they are therefore described in the results section. These scenarios globally contrasted various hypotheses concerning the source and sink relationships among the different genetic groups identified using clustering methods.
Simulations were performed using Diyabc [51], model selection and parameter estimation was carried out using the abc package in R [52]. A total of 5×10⁵ simulated data sets was generated for each scenario under the generalized stepwise mutation model, with two parameters: the mean mutation rate (I) and the mean parameter (P) of the geometric distribution used to model the length of mutation events (in number of repeats). The mean mutation rate was drawn from a uniform distribution of 10−4 to 10−3, while the mutation rate of each locus was drawn from a gamma distribution (mean = μ, shape = 2). The parameter P was kept in the range of 0.1 to 0.3. A range of 40 contiguous allelic states was kept for each locus, characterized by individual value of mutation rate (lL) and the parameter of the geometric distribution (PL), which were obtained from Gamma distribution (with mean = 1, range 5×10⁻⁵ to 5×10⁻² for IL; and mean = P, shape = 2, shape 0.01–0.09 for PL). Mean number of alleles per locus, mean genetic diversity [53], mean variance in allele size, genetic differentiation between pairwise groups, FST [54] , and genetic distance (δμ2 [55] were used as summary statistics.
Relative posterior probabilities of different scenarios were estimated by fitting a multinomial logistic regression between the summary statistics and a polychotomous variable corresponding to the different model indexes [56], using 1% of simulated dataset closest to the observed data. The posterior distributions of parameters were estimated for the most likely scenario using a local linear regression [57], [58] on 1% simulated datasets closest to the observed data. Confidence in model choice was assessed using a leave-one-out method [52] for each model we drew 100 of the 5×10⁵ simulated datasets used for model selection and treated them as observed datasets (i.e., pseudo-observed datasets). Posterior probabilities of competing models were evaluated for each pseudo-observed dataset, using all remaining simulated datasets and the same methodology as described for the observed dataset. Confidence in model choice was then estimated using the number of pseudo-observed dataset that gave higher posterior probability to the model they had been simulated with. In tests of goodness-of-fit (i.e., model checking), we simulated 100 datasets of similar number of markers as observed datasets and calculated for each dataset the average across loci of several test quantities. The set of test quantities included the summary statistics used in analyses of the observed dataset. However, because using the same statistics in parameter inference and model checking can overestimate the quality of the fit [51], we selected additional summary statistics that had not been used in parameter inferences: mean allele size variance across loci, mean index of classification, and for each population pair the mean gene diversity, mean allelic richness, and mean allele size variance across loci. Test statistics computed from observed data were then ranked against the distributions obtained from simulated datasets [58].
Results
Summary of genetic variation
We performed multilocus genotyping of 409 PST isolates, representatives of a worldwide collection, using a set of 20 microsatellite markers. Plotting the multilocus genotypes detected against the number of loci re-sampled showed that the full set of SSRs was sufficient to discriminate clonal lineages (supporting information; Fig. S1). No significant linkage disequilibrium was found among SSR loci (data not shown), suggesting a lack of redundancy among markers. Some of the loci were monomorphic in certain geographical areas, except that China had no such locus and Pakistan had only one (RJN-12; supporting information; Table S1).
Population subdivision
Genotypes clearly clustered according to their geographical origin in the non-parametric discriminant analysis of principal components (DAPC) analysis. The Bayesian information criteria (BIC) curve in the DAPC analyses supported K = 6 with a clear discrimination of genotypes from China, Pakistan, Nepal, Middle East-East Africa, North western (NW) Europe and Central Asia-Mediterranean region (Fig. 1 and Fig. 2).


Analyses using the model-based clustering method implemented in Structure also identified an optimal number of clusters (K) equal to 6, based on the rate of change in the log probability of data across successive K values [59], and patterns of subdivision were largely consistent with the results of non-parametric DAPC (Fig. 2 and Fig. S2). At K = 2, Middle Eastern, Mediterranean and Central Asian populations were assigned to one group; the Chinese population was assigned to the other group; and Nepalese, Pakistani and NW European populations had a mixed assignment of the two groups (Fig. S2). Increasing K to 3 individualized a Pakistan-specific group, while increasing K to 4 split the cluster of Middle East, Central Asia and Mediterranean region into two groups, one specific to the Middle East and East Africa and the other specific to the Central-Asia and Mediterranean region, with substantial admixture from the Middle East. The Middle Eastern and East African populations had no differentiation from each other and are termed as Middle East-East Africa, onward. At K = 5, the NW European populations were separated from the Chinese population, and at K = 6, the Nepalese group individualized (Fig. S2). Increasing K above 6 did not reveal any further subdivisions (Fig. S2).
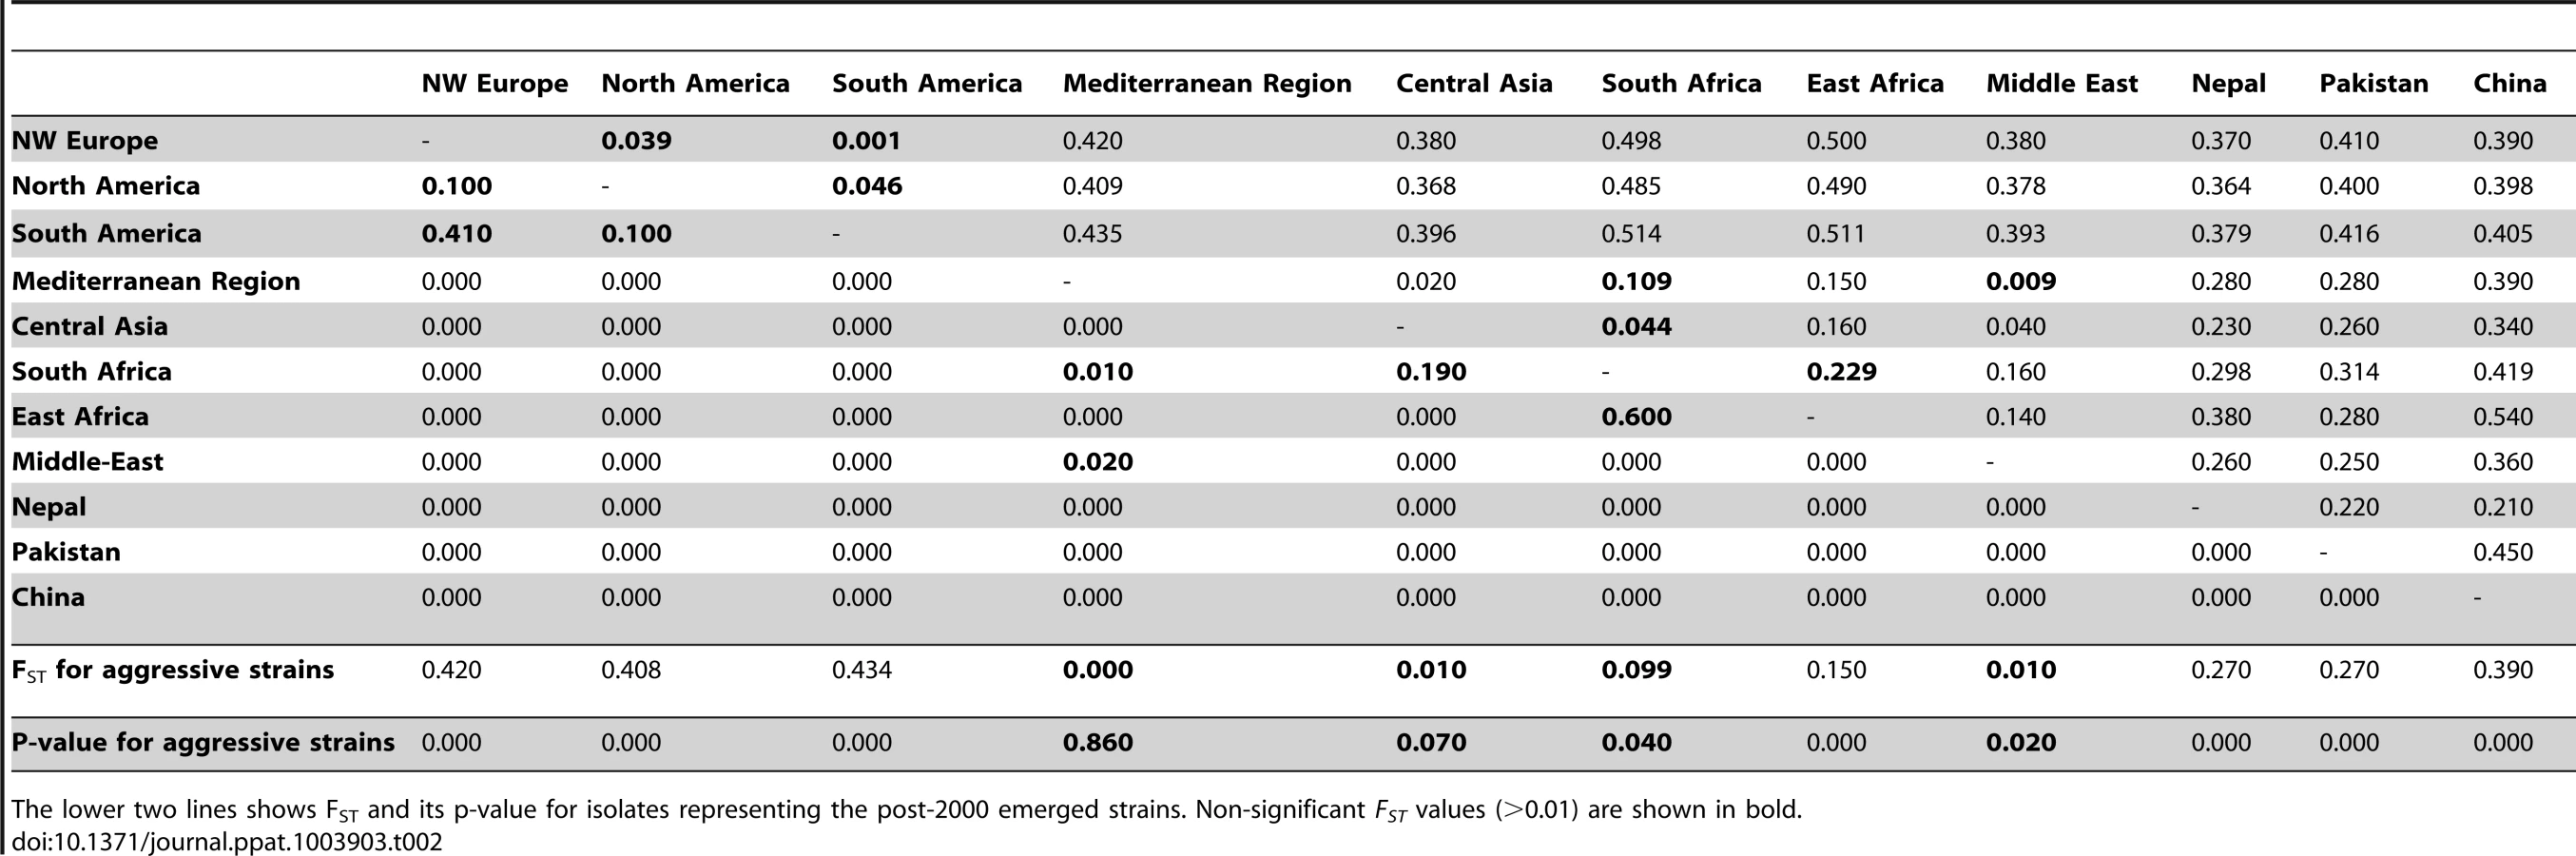
Population differentiation among the different geographically spaced populations was estimated by means of pairwise Fst. Populations showed a strong differentiation, with high and significant Fst values for all pairs except for PST from the Middle Eastern, Central Asian and Mediterranean regions (Table 2), indicative of a relatively recent shared ancestry or significant gene flow among these three latter populations. Chinese, Pakistani and Nepalese populations were differentiated from one another and from the Middle Eastern and Mediterranean populations. These two latter populations were not highly differentiated from one another (Fig. S2; Table 2). The NW European population showed a strong differentiation from Mediterranean and Middle Eastern populations but was closer to the Chinese population (Fig. S2 and Fig. S3).
Geographical patterns of genetic and genotypic variability
Populations from NW Europe, North America, South America, Australia, South Africa, East Africa, the Middle East and the Mediterranean region displayed low genotypic diversity as well as an excess of heterozygosity compared to expectations under HWE, consistent with long-term clonality. Asia appeared as the zone of the highest diversity of the pathogen, with Himalayan (Nepalese and Pakistani) and near Himalayan (Chinese) populations not departing from HWE, suggesting the occurrence of recombination within the populations (Fig. 3), and showing higher variability in terms of genotypic diversity and allele richness (Fig. 4). Populations from Middle East and East Africa were more diverse than the European and Mediterranean populations, where the maximum clonal resampling was observed. Pakistan displayed the highest number of private alleles (Fig. 4). Isolates representing NW Europe also had high private allele richness, probably due to their strict clonality [19], [25] and isolation from other populations.


Source of recently emerged populations
We detected only a few recent migrants, admixed and unassigned isolates in each geographical region in clustering analyses (Fig. 2 and Fig. S2). The existence of such genotypes in the Himalayan and neighboring regions may reflect back migrations or shared ancestral variation, as both phenomena give the same signal with clustering algorithms [60], [61]. Clear migration footprints were only found when focusing on recently colonized areas. Analyses confirmed NW Europe as the source of the North American and Australian populations, and the Mediterranean region and Central Asia appeared to be the source of the South African population (Fig. 2 and Fig. S2). Additionally, the South American isolates were assigned to NW European isolates and displayed very low diversity, revealing another incursion from NW Europe.
Isolates of the recently emerged aggressive strain PstS1, associated with the post-2000 epidemics in the USA and Australia, consisted of only a single multilocus genotype (MLG-99) resampled in other geographical regions as well. PstS1 was closely related to the other recently emerged aggressive strain reported in Asia, Africa and Europe, the PstS2, which consisted of different multilocus genotypes, including this MLG-99. Both PstS1 and PstS2 were assigned to the Middle Eastern-East Africa group, suggesting a source in Middle East-East Africa for these strains (Fig. 2 and Table 2). An older set of aggressive isolates frequently reported in Southern Europe [25], although with lesser number of virulences than PstS1 and PstS2 [24], were assigned to the Central Asian-Mediterranean genetic group (represented as PstS3 in Fig. 2).
Ancestral relationship and migration patterns of populations
We used approximate Bayesian computation (ABC) analyses to infer on the ancestral relationship among populations. To limit the number and complexity of the scenarios to be compared, we used a sequential approach: we defined nested subsets of competing scenarios based on our understanding of the population structure in different regions, and analyzed these subsets sequentially. The origin of recently emerged populations was investigated using clustering and differentiation analyses and it has been presented in the previous section.
We started by analyzing the historical relationships among the three populations displaying recombining population structures and located in the region of highest diversity (i.e., Pakistan, Nepal and China). The four competing scenarios assumed three different population-trees, and admixture in the ancestry of the Nepalese population (Fig. S4) as this population appeared admixed in population subdivision analyses (Fig. S2 and Fig. S3). Leave-one-out cross-validation for model selection [52] confirmed that our methodology was able to distinguish between the four different scenarios (Table S5). The emergence of the Nepalese populations following admixture between Pakistani and Chinese populations appeared the most likely [Scenario 4a, posterior probability (PP): 0.9911; (Table S6)]. This scenario (4a) was then used as a backbone to design scenarios investigating the origin of other populations. Because a relatively recent origin of the Nepalese population was indicated by parameter estimates [Maximum Posterior Probability (MPP) estimate: 103 generations; 95% CI: 14–332; (Table S3)], this population was therefore dismissed as a possible source of other populations and not considered in subsequent analyses.
The origin of Central Asian, Middle Eastern and Mediterranean population was investigated jointly, based on the relatedness of these populations in population structure analyses (Fig. 1, S2 and Table 2), and their geographical proximity from the centre of diversity (the Himalayan and neighboring areas). Central Asian and the Mediterranean populations were pooled, based on their genetic relatedness to limit the number of competing scenarios. Twelve scenarios were compared, assuming two different native populations (China and Pakistan), sequential or independent introductions and admixture (Fig. S5). Leave-one-out analyses indicated a good ability to distinguish between the twelve scenarios (Table S5). Scenario 11b, assuming that the Central Asian, Middle Eastern and Mediterranean populations split following an admixture event between Chinese and Pakistani populations appeared the most likely (PP = 0.717; Table S6; Fig. 5). The Pakistani population had a slightly higher contribution to the admixture event [1-r5 = 0.57, 95% Credibility interval (CI): 0.096–0.954] than the Chinese population, which might account for the assignment of simulated dataset under this scenario to scenario 10b (both populations originated from Pakistan) in leave-one-out analyses. We also considered the possibility that populations not represented in our dataset could have contributed to the genetic makeup of extant worldwide PST populations. All scenarios including a hypothetical un-sampled source population had lower posterior probabilities than the most supported scenario (11b) described above (scenarios set d; Fig. S7; Table S6). Leave-one-out analyses, however, indicated limited power to distinguish among the scenarios (Table S5).

The most likely scenario identified in analyses of Central Asian, Middle Eastern and Mediterranean populations was then used as a backbone to investigate the origin of the NW European population. Six scenarios were compared, assuming three different populations of origin (China, Pakistan and the Central-Asian-Middle-Eastern-Mediterranean lineage identified above) and admixture (Fig. S6). The scenario (2c) assuming that the NW European emerged following an admixture event between Chinese and Pakistani populations appeared the most likely (PP = 0.499; Table S6; Fig. 5). Parameter estimates for scenario 2c suggested a higher contribution of the Chinese population to the admixture event (1-r7 = 0.756, 95% CI: 0.187–0.987), which may account for the relatively high posterior probabilities for scenarios 1c and 4c [PP = 0.173 and PP = 0.270, respectively]. Inclusion of a hypothetical un-sampled source population revealed a slightly higher posterior probability of scenario 2c described above (PP = 0.303) than the posterior probability of scenario 4e (PP = 0.287) assuming that the NW European population resulted from an admixture event between the Chinese and un-sampled population (scenarios set e; Fig.S7; Table S6). Like scenario 2c, parameter estimates for scenario 4e suggested a higher contribution of the Chinese population to the admixture event (r8 = 0.797, 95%CI: 0.069–0.982).
Discussion
We investigated the origin, migration routes and population structure of wheat yellow rust pathogen Puccinia striiformis f.sp. tritici (PST) using a comprehensive set of isolates from six continents and 20 highly informative SSR markers. We showed that despite the long-distance dispersal and the recent global spread of aggressive strains, the worldwide PST population has a clear genetic structure and is separated into six groups corresponding to main epidemic areas. The maintenance of a clear genetic structure despite substantial gene flow results from both strong clonality in many PST populations, and strong founder effects in recently emerged populations.
Strong population subdivision despite long-distance dispersal
We report the existence of a strong population subdivision within PST, with a clustering of isolates according to their geographical origin despite a capacity for long-distance migration [9], [11]. This pattern stands in stark contrast with the previous understanding of the worldwide population structure of PST, which considers the potential replacement of local populations by new invasions [5], [9]. On the basis of pathological survey that monitor the occurrence of strains with newly acquired virulences that defeat recently deployed Yr (resistance) genes, the population structure of PST was considered to be shaped by a continual replacement of pre-existing populations by the newly emerged and spread pathotypes, or aggressive strains. This process is well known as the boom and bust cycle [5], [10]. However, such surveys were designed to track the spread of a new, virulent race and, therefore, were potentially biased due to sampling only from varieties with the defeated resistance gene(s) in question but not from local landraces or other varieties. These observations lead to Asia (except China) being considered as a single epidemiological zone, with rapid and recurrent spread of new virulences over the whole zone, as in the case of virulence matching the Yr9 resistance gene (Fig. 6 [5]) and the recent virulence matching the stem rust resistance gene Sr31 [4]. Indeed, such geographic migrations are also documented in our study, but recently spread genotypes appear to coexist with and are dominated by older populations specific to the main geographic areas, suggesting that migrants do not replace local populations in recombinant Asian populations despite the capacity for recurrent and long-distance dispersal. In contrast, the invasion of new genotypes in clonal populations would result in a population sweep and would replace the original population. This was observed in the USA, where the post-2000 PST population is dominated by the pathotypes characteristic of the aggressive strain, PstS1, or its derivatives, shown above to have originated from the East African-Middle Eastern region. The outcome of new pathotype introductions may depend on the relative competitiveness of local populations in their region of origin, and the selective advantage of migrants (e.g. their virulence towards a new resistance gene widely deployed or an increased tolerance to prevalent abiotic stresses e.g., high temperatures).

Regional differences in levels of recombination
PST has long been considered a strictly asexual pathogen on wheat due to the lack of knowledge about the existence of alternate host to complete sexual reproduction [16], [62]. Population genetic surveys that revealed clonal populations with very low diversity in USA [27], Europe [25] and Australia [15] were consistent with a hypothesis of asexual reproduction. Recently, populations with higher diversity were reported in the Middle East [31] and Pakistan [29], and a recombinant population structure was evidenced in China [28]. Herein, we identified a recombinant population structure and high diversity in Nepal and Pakistan and confirmed previous findings in China, suggesting the existence of possible sexual reproduction in PST populations from a broad area ranging from the Himalayan region to the Mongolian plateau. This possibility also recently gained indirect experimental support, with the demonstration of Berberis spp. as alternate host for PST under laboratory conditions [63] and a high ability for sexual reproduction (in the form of telial production) reported in the Asian populations of PST [32]. Although the role of Berberis spp. for the life cycle of PST under natural conditions remains to be further investigated, the presence of Berberis spp. in Pakistan, Nepal and China [64], [65], [66] is consistent with the existence of a sexual cycle of the pathogen in Asia.
On the source of new incursions and emergences
Clustering and differentiation analyses allowed us to identify the source of new incursions and emergence (Fig. 2 and Fig. 6). The source of the Australian and North American populations was confirmed to be NW Europe, in accordance with previous findings, suggesting the migration of PST from NW Europe to Australia in 1979 [15] and probably earlier to North America [11], [67]. We also identified the NW European source of the South American PST population, which was reported earlier in the 20th century with no inference on its source [16], [21]. This suggests that PST incursions into both North and South America originated from NW Europe, probably through human intervention. We also identified the Mediterranean-Central Asian population as the source of South African populations, first reported in 1996 [20], which might have resulted from wind dispersal or human intervention (Fig. 6).
Two closely related strains of PST, distinct from local populations, were recently reported in North America, Australia and Europe [6]. These strains were shown to be highly aggressive and adapted to high temperature [24]. One of the strains (PstS1) was responsible for PST epidemics in south-central USA, a region previously considered too warm for yellow rust epidemics [in 2000]; [ 22,68], and in Western Australia [in 2002; 69]. Another strain (PstS2), closely related to the first one, was reported in NW Europe with similar aggressiveness and strong differentiation from local PST populations. PstS2 was also shown to be present in the Mediterranean region and the Middle East-East Africa [6]. Our analyses revealed that PstS1 representative isolates had a single multilocus genotype (MLG-99), while PstS2 consisted of different, but closely related, MLGs. Assignment analyses revealed that both strains originated from the Middle East-East Africa, and such global patterns of dispersal would involve accidental spore transport linked with human activities. Thus, the incursion of PST into the Americas and the spread of aggressive strains are most probably the direct consequence of human-associated dispersal, as suggested for the initial introduction of PST in Australia [15]. These results suggests that PST may spread rapidly through winds or human activities, with former playing a greater role at regional scales [26], the latter could be involved in inter-continental spread.
Origin of the worldwide PST populations
Transcaucasia had previously been suggested as the centre of origin for the pathogen, mainly based on its diversity of virulence and distribution of pathotypes [16], [17]. However, the diversity of virulence and the distribution of pathotypes are strongly influenced by the resistance in host populations, and this might lead to biased inferences of the location of the centre of origin of the pathogen. In our analyses, the representative isolates from Transcaucasia were less diverse, appeared to be clonal and did not exhibit strong divergence from the rest of the Middle-Eastern, Central Asian and Mediterranean populations. In contrast, the existence of high levels of diversity, private alleles, a recombinant population structure, the ability to produce sex-related structures [32] and the independent maintenance of PST populations in the Himalaya [66] suggest this latter region as a more plausible centre of origin for PST. The analysis of ancestral relationships among worldwide populations further confirmed the Himalayan populations to be the ancestral populations and the differentiation between Pakistan and China to be the most ancestral split (Fig. 5; Table S2, S3, S4, S5, S6). If one considers that the centre of origin of PST is in the Himalayan region, then PST would have adapted to wheat through host-range expansion or host shift and not followed a host-tracking co-evolution with early wheat domestication in the Fertile Crescent. This would add to the increasingly adopted view that infection of a novel host is a major route of disease emergence in fungal pathogens [70]. Additional sampling campaigns and full-genome re-sequencing of new isolates from wild and domesticated hosts should provide further insight into the history of PST and advance our understanding of the evolutionary response of pathogens to plant domestication and the development of agro-systems.
Proposed scenario for historical migration routes of PST
Once adapted to wheat in its centre of origin in the Himalayas or the nearby regions, PST could have spread to the rest of the world while evolving independently in different parts of the Himalayan region, resulting in population subdivision within the native area [66]. PST could have spread northward from the Himalayas to the Mongolian plateau in China, where it maintained sexual reproduction and a high diversity in some parts, with an acquisition of virulences to the wheat varieties grown in China. Eastbound, ABC analyses indicated that relatively recent admixture event between Pakistani and Chinese populations resulted in the Nepali population. On the westward side of the Himalayan region, the three Middle-Eastern, Mediterranean and Central Asian populations could be the result of an admixture between Pakistan and China (Fig. 5) with relatively higher contribution of the Pakistani population to the admixture event according to ABC inferences. The Mediterranean, Middle Eastern and Central Asian populations were less differentiated, despite their distribution across a large geographical area. The off-season maintenance in some regions, its subsequent spread to other Middle-Eastern, Mediterranean and Central Asian regions and the lack of local off-season survival through volunteers or sexual reproduction in all regions could result in a source and sink relationship at the scale of this whole region, as previously suggested [31]. The most recent incursion from this Middle-Eastern, Mediterranean and Central Asian population was into South Africa, where PST was absent until 1996 [20].
The NW European population was shown in ABC analyses to be the result of admixture between China and Pakistan or between China an un-sampled source population with a higher contribution of the Chinese population to the admixture event. This is consistent with the lower differentiation between the NW European population and the Chinese population (Table 2), compared to the Pakistani or the Middle Eastern, Central Asian and Mediterranean populations. These results suggest that PST has spread from China to NW Europe, and this spread more likely occurred through some human intervention rather than an airborne incursion from the Middle Eastern, Central Asian and/or Mediterranean regions. This NW European population succeeded in terms of off-season survival on volunteers in coastal areas with mild winter and resulted in a reduced ability for sexual reproduction [32]. The clonal evolution within the NW European population resulted in a strong negative FIS value, owing to a clonal divergence of the dikaryotic genomes [25], in line with what is expected according to the Meselson Effect [71]. From NW Europe, PST has subsequently been introduced to North and South America and even more recently to Australia (Fig. 6).
Our study suggests the Himalayan region as the likely centre of origin of PST, it confirms the previous migration hypotheses (invasion of USA and Australia from NW Europe and the source of aggressive strains), and it also provides an integrative scenario for the worldwide spread of PST including new findings regarding the origins of South American and European populations (Fig. 6). More extended surveys, particularly in northern parts of Asia and Eastern part of Himalayan region along with a multigene phylogeny approach based on several gene sequences will provide a more detailed resolution in the analysis of the colonization history of the pathogen and its population structure in Asia, taking advantage of the historical/epidemiological records of PST emergences.
Conclusions
The existence of a high genotypic diversity, a high ability for sexual reproduction as well as the independent maintenance of strongly differentiated populations in the Himalayan region suggests this region as the putative centre of origin of PST. Differences in the levels of diversity and mode of reproduction among geographically distant populations are particularly relevant in the context of risk-assessment for disease emergence: Asian populations (China, Nepal and Pakistan) with a high level of recombination, diversity and ability for sexual reproduction could serve as possible sources for the emergence of new, virulent and aggressive strains. The maintenance of populations specific to geographical regions in Asia suggests a survival of local populations in these regions, potentially through sexual reproduction. For integrated disease management, it would be important to quantify the relative contribution of sexual vs. asexual reproduction to the diversity in different world populations and identify sexual host(s) or clonal over-summering/-wintering pathways. Finally, this study emphasizes the potential role of human travel and commerce as a major driver in the emergence of PST. The intensification of business and tourism activities in regions known as major sources of pathogen diversity should be considered in the context of risks associated with the emergence and worldwide spread of plant disease.
Supporting Information
Zdroje
1. StukenbrockEH, McDonaldBA (2008) The origins of plant pathogens in agro-ecosystems. Annual Review of Phytopathology 46 : 75–100.
2. ParkerIM, GilbertGS (2004) The evolutionary ecology of novel plant-pathogen interactions. Annual Review of Ecology, Evolution, and Systematics 35 : 675–700.
3. PalmM (2001) Systematics and the impact of invasive fungi on agriculture in the United States. BioScience 51 : 141–147.
4. SinghRP, HodsonDP, JinY, Huerta-EspinoJ, KinyuaMG, et al. (2006) Current status, likely migration and strategies to mitigate the threat to wheat production from race Ug99 (TTKS) of stem rust pathogen. CAB Reviews 1 : 054.
5. Singh RP, William HM, Huerta-Espino J, Rosewarne G (2004) Wheat rust in Asia: meeting the challenges with old and new technologies. In proceedings of the 4th International Crop Science Congress; 26 Sep–1 Oct 2004; Brisbane, Australia. Available at: http://www.cropscience.org.au/icsc2004/symposia/3/7/141_singhrp.htm.
6. HovmøllerMS, YahyaouiAH, MilusEA, JustesenAF (2008) Rapid global spread of two aggressive strains of a wheat rust fungus. Molecular Ecology 17 : 3818–3826.
7. PerringsC, WilliamsonM, BarbierE, DelfinoD, DalmazzoneS, et al. (2002) Biological invasion risks and the public good: an economic perspective. Conservation Ecology 6: Article 1.
8. CampbellF (2001) The science of risk assessment for phytosanitary regulation and the impact of changing trade regulations. BioScience 51 : 148–153.
9. BrownJKM, HovmøllerMS (2002) Aerial dispersal of fungi on the global and continental scales and its consequences for plant disease. Science 297 : 537–541.
10. de Vallavieille-PopeC, AliS, LeconteM, EnjalbertJ, DelosM, et al. (2012) Virulence dynamics and regional structuring of Puccinia striiformis f. sp. tritici in France between 1984 and 2009. Plant Disease 96 : 131–140.
11. HovmøllerMS, SørensenCK, WalterS, JustesenAF (2011) Diversity of Puccinia striiformis on cereals and grasses. Annual Review of Phytopathology 49 : 197–217.
12. HovmøllerMS, WalterS, JustesenAF (2010) Escalating threat of wheat rusts. Science 329 : 369.
13. AliS, ShahSJA, RahmanH, SaqibMS, IbrahimM, et al. (2009) Variability in wheat yield under yellow rust pressure in Pakistan. Turkish Journal of Agriculture and Forestry 33 : 537–546.
14. AliS, ShahSJA, KhalilIH, RahmanH, MaqboolK, et al. (2009) Partial resistance to yellow rust in introduced winter wheat germplasm at the north of Pakistan. Australian Journal of Crop Science 3 : 37–43.
15. WellingsCR (2007) Puccinia striiformis in Australia: A review of the incursion, evolution and adaptation of stripe rust in the period 1979–2006. Australian Journal of Agricultural Research 58 : 567–575.
16. Stubbs RW (1985) Stripe rust. In: Roelfs AP, Bushnell WR, editors. The Cereal Rusts, Diseases, Distribution, Epidemiology and Control. London, UK: Academic Press. pp. 61–101.
17. Stubbs RW (1988) Pathogenicity analysis of yellow (stripe) rust of wheat and its significance in a global context. In: Simmonds NW, Rajaram S, editors. Breeding strategies for resistance to the rusts of wheat: CIMMYT D.F. Mexico.
18. KolmerJA (2005) Tracking wheat rust on a continental scale. Current Opinion in Plant Biology 8 : 441–449.
19. JustesenAF, RidoutbCJ, HovmøllerMS (2002) The recent history of Puccinia striiformis f.sp. tritici in Denmark as revealed by disease incidence and AFLP markers. Plant Pathology 51 : 13–23.
20. BoshoffWHP, PretoriusZA, van NiekerkBD (2002) Establishment, distribution, and pathogenicity of Puccinia striiformis f.sp. tritici in South Africa. Plant Disease 86 : 485–492.
21. RudorfW, JobM (1934) Untersuchungen bezüglich des Spezialisierung von Puccinia graminis tritici. Puccinia trilicina und Puccinia glumarum tritici, sowie über Resistenz und ihre Vererbung in verschiedenen Kreuzungen. Pflanzenzüchtung 19 : 333–365.
22. ChenXM (2005) Epidemiology and control of stripe rust [Puccinia striiformis f. sp. tritici] on wheat. Canadian Journal of Plant Pathology 27 : 314–337.
23. MarkellSG, MilusEA (2008) Emergence of a Novel Population of Puccinia striiformis f. sp. tritici in Eastern United States. Phytopathology 98 : 632–639.
24. MilusEA, KristensenK, HovmøllerMS (2009) Evidence for increased aggressiveness in a recent widespread strain of Puccinia striiformis f.sp. tritici causing stripe rust of wheat. Phytopathology 99 : 89–94.
25. EnjalbertJ, DuanX, LeconteM, HovmøllerMS, de Vallavieille-PopeC (2005) Genetic evidence of local adaptation of wheat yellow rust (Puccinia striiformis f. sp. tritici) within France. Molecular Ecology 14 : 2065–2073.
26. HovmøllerMS, JustesenAF, BrownJKM (2002) Clonality and long-distance migration of Puccinia striiformis f.sp. tritici in north-west Europe. Plant Pathology 51 : 24–32.
27. ChenX, LineRF, LeungH (1993) Relationship between virulence variation and DNA polymorphism in Puccinia striiformis. Phytopathology 83 : 1489–1497.
28. MboupM, LeconteM, GautierA, WanAM, ChenW, et al. (2009) Evidence of genetic recombination in wheat yellow rust populations of a Chinese oversummering area. Fungal Genetics and Biology 46 : 299–307.
29. BahriB, ShahSJA, HussainS, LeconteM, EnjalbertJ, et al. (2011) Genetic diversity of wheat yellow rust population in Pakistan and its relationship with host resistance. Plant Pathology 60 : 649–660.
30. HovmøllerMS, JustesenAF (2007) Appearance of atypical Puccinia striiformis f. sp. tritici phenotypes in north-western Europe. Australian Journal of Agricultural Research 58 : 518–524.
31. BahriB, LeconteM, OuffroukhA, de Vallavieille-PopeC, EnjalbertJ (2009) Geographic limits of a clonal population of wheat yellow rust in the Mediterranean region. Molecular Ecology 18 : 4165–4179.
32. AliS, LeconteM, WalkerA-S, EnjalbertJ, de Vallavieille-PopeC (2010) Reduction in the sex ability of worldwide clonal populations of Puccinia striiformis f.sp. tritici. Fungal Genetics and Biology 47 : 828–838.
33. EnjalbertJ, DuanX, GiraudT, VautrinC, de Vallavieille-PopeC, et al. (2002) Isolation of twelve microsatellite loci, using an enrichment protocol, in the phytopathogenic fungus Puccinia striiformis f. sp. tritici. Molecular Ecology Notes 2 : 563–565.
34. AliS, GautierA, LeconteM, EnjalbertJ, De Vallavieille-PopeC (2011) A rapid genotyping method for an obligate fungal pathogen, Puccinia striiformis f.sp. tritici, based on DNA extraction from infected leaf and Multiplex PCR genotyping. BMC Research Notes 4 : 240.
35. DutechC, FabreguettesO, CapdevielleX, RobinC (2010) Multiple introductions of divergent genetic lineages in an invasive fungal pathogen, Cryphonectria parasitica, in France. Heredity 105 : 220–228.
36. JombartT, DevillardS, BallouxF (2010) Discriminant analysis of principal components: a new method for the analysis of genetically structured populations. BMC Genetics 11 : 95 http://www.biomedcentral.com/1471-2156/1411/1494.
37. PritchardJK, StephensM, DonnellyP (2000) Inference of population structure using multilocus genotype data. Genetics 155 : 945–959.
38. GaoH, WilliamsonS, BustamanteCD (2007) A markov chain monte carlo approach for joint inference of population structure and inbreeding rates from multilocus genotype data. Genetics 176 : 1635–1651.
39. JakobssonM, RosenbergNA (2007) CLUMPP: a cluster matching and permutation program for dealing with label switching and multimodality in analysis of population structure. Bioinformatics 23 : 1801–1806.
40. NeiM, TajimaF, TatenoY (1983) Accuracy of estimated phylogenetic trees from molecular data. Journal of Molecular Evolution 19 : 153–170.
41. Langella O (2008) POPULATIONS 1.2.3, Logiciel de génétique des populations. In: Langella O, editor. Gif-sur-Yvette, France: Laboratoire Populations, Génétique et évolution, CNRS.
42. Belkhir KBP, Chikhi L, Raufaste N, Bonhomme F (2004) GENETIX 4.05, logiciel sous Windows TM pour la génétique des populations. Laboratoire Génome, Populations, Interactions, CNRS UMR 5000: Université de Montpellier II, Montpellier (France) http://www.univ-montp2.fr/~genetix/genetix/genetix.htm.
43. Arnaud-HaondS, BelkhirK (2007) GenClone 1.0: A new program to analyse genetics data on clonal organisms. Molecular Ecology Notes 7 : 15–17.
44. Goudet J (2001) FSTAT, a program to estimate and test gene diversities and fixation indices.2.9.3 ed: Available from http://www2.unil.ch/popgen/softwares/fstat.htm.
45. AgapowPM, BurtA (2001) Indices of multilocus linkage disequilibrium. Molecular Ecology Notes 1 : 101–102.
46. SzpiechZA, JakobssonM, RosenbergNA (2008) ADZE: a rarefaction approach for counting alleles private to combinations of populations. Bioinformatics 24 : 2498–2504.
47. RaymondM, RoussetF (1995) GENEPOP Version 1.2: population genetics software for exact tests and ecumenicism. Journal of Heredity 86 : 248–249.
48. Maynard-Smith J, Smith NH, O'rourke M, Spratt BG. How clonal are bacteria?; 1993. pp. 4384–4388.
49. DilmaghaniA, GladieuxP, GoutL, GiraudT, BrunnerPC, et al. (2012) Migration patterns and changes in population biology associated with the worldwide spread of the oilseed rape pathogen Leptosphaeria maculans. Molecular Ecology 21 doi: 10.1111/j.1365-294X.2012.05535.x
50. CornilleA, GladieuxP, SmuldersMJM, Roldan-RuizI, LaurensF, et al. (2012) New Insight into the History of Domesticated Apple: Secondary Contribution of the European Wild Apple to the Genome of Cultivated Varieties. PLoS Genetics 8: e1002703 doi:1002710.1001371/journal.pgen.1002703
51. CornuetJM, RavigneV, EstoupA (2010) Inference on population history and model checking using DNA sequence and microsatellite data with the software DIYABC (v1.0). BMC Bioinformatics 11 : 401.
52. CsilléryK, FrançoisO, BlumM (2012) abc: an R package for approximate Bayesian computation (ABC). Methods in Ecology and Evolution 3 : 475–479.
53. NeiM (1978) Estimation of average heterozygosity and genetic distance from a small number of individuals. Genetics 89 : 583–590.
54. WeirBS, CockerhamCC (1984) Estimating F-statistics for the analysis of population structure. Evolution Psychiatrique 38 : 1358–1370.
55. GoldsteinDB, RuizLA, Cavalli-SforzaLL, FeldmanMW (1995) An evaluation of genetic distances for use with microsatellite loci. Genetics 139 : 463–471.
56. FagundesNJR, RayN, BeaumontMA, NeuenschwanderS, SalzanoFM, et al. (2007) Statistical evaluation of alternative models of human evolution. Proceedings of the National Academy of Science of the United States of America 104 : 17614–17619.
57. CornuetJM, SantosF, BeaumontMA, RobertCP, MarinJM, et al. (2008) Inferring population history with DIY ABC: a user-friendly approach to approximate Bayesian computation. Bioinformatics 24 : 2713–2719.
58. BeaumontMA, ZhangW, BaldingDJ (2002) Approximate Bayesian computation in population genetics. Genetics 162 : 2025–2035.
59. EvannoG, RegnautS, GoudetJ (2005) Detecting the number of clusters of individuals using the software STRUCTURE : a simulation study. Molecular Ecology 14 : 2611–2620.
60. GladieuxP, ZhangX-G, Afoufa-BastienD, SanhuezaR-MV, SbaghiM, et al. (2008) On the origin and spread of the scab disease of apple: out of Central Asia. PLoS ONE 3: e1455.
61. SchoflG, SchlottererC (2006) Microsatellite variation and differentiation in African and non-African populations of Drosophila simulans. Molecular Ecology 15 : 3895–3905.
62. Cummins GB (1971) The rusts fungi of cereals, grasses, and bamboos: Springer-Verlag, New York.
63. JinY, SzaboLJ, CarsonM (2010) Century-old mystery of Puccinia striiformis life history solved with the identification of Berberis as an Alternate Host. Phytopathology 100 : 432–435.
64. RayR, GururajaKV, RamchandraTV (2011) Predictive distribution modeling for rare Himalayan medicinal plant Berberis aristata DC. Journal of Environmental Biology 32 : 725–730.
65. PerveenA, QaiserM (2010) Pollen flora of Pakistan–LXV. berberidaceae. Pakistan Journal of Botany 42 : 1–6.
66. AliS, GladieuxP, RahmanH, SaqibMS, FiazM, et al. (2014) Inferring the contribution of sexual reproduction, migration and off-season survival to the temporal maintenance of microbial populations: a case study on the wheat fungal pathogen Puccinia striiformis f.sp. tritici. Molecular Ecology DOI: 10.1111/mec.12629
67. CarletonMA (1915) A serious new wheat rust in this country. Science 42 : 58–59.
68. MilusEA, SeyranE, McNewR (2006) Aggressiveness of Puccinia striiformis f. sp. tritici isolates in the South-Central United States. Plant Disease 90 : 847–852.
69. WellingsCR, WrightDG, KeiperF, LoughmanR (2003) First detection of wheat stripe rust in Western Australia: evidence for a foreign incursion. Australasian Plant Pathology 32 : 321–322.
70. GiraudT, GladieuxP, GavriletsS (2010) Linking the emergence of fungal plant diseases with ecological speciation. Trends in Ecology & Evolution 25 : 387–395.
71. BultinR (2002) The costs and benefits of sex: new insights from old asexual lineages. Nature Reviews Genetics 3 : 313–317.
Štítky
Hygiena a epidemiologie Infekční lékařství LaboratořČlánek vyšel v časopise
PLOS Pathogens
2014 Číslo 1
- Farmakovigilanční studie perorálních antivirotik indikovaných v léčbě COVID-19
- Jak souvisí postcovidový syndrom s poškozením mozku?
- Měli bychom postcovidový syndrom léčit antidepresivy?
- 10 bodů k očkování proti COVID-19: stanovisko České společnosti alergologie a klinické imunologie ČLS JEP
Nejčtenější v tomto čísle
- Lyme Disease: Call for a “Manhattan Project” to Combat the Epidemic
- Origin, Migration Routes and Worldwide Population Genetic Structure of the Wheat Yellow Rust Pathogen f.sp.
- IFNγ/IL-10 Co-producing Cells Dominate the CD4 Response to Malaria in Highly Exposed Children
- Human and Plant Fungal Pathogens: The Role of Secondary Metabolites