
Activation of Bmp2-Smad1 Signal and Its Regulation by Coordinated Alteration of H3K27 Trimethylation in -Induced Senescence
Cellular senescence involves epigenetic alteration, e.g. loss of H3K27me3 in Ink4a-Arf locus. Using mouse embryonic fibroblast (MEF), we here analyzed transcription and epigenetic alteration during Ras-induced senescence on genome-wide scale by chromatin immunoprecipitation (ChIP)-sequencing and microarray. Bmp2 was the most activated secreted factor with H3K4me3 gain and H3K27me3 loss, whereas H3K4me3 loss and de novo formation of H3K27me3 occurred inversely in repression of nine genes, including two BMP-SMAD inhibitors Smad6 and Noggin. DNA methylation alteration unlikely occurred. Ras-activated cells senesced with nuclear accumulation of phosphorylated SMAD1/5/8. Senescence was bypassed in Ras-activated cells when Bmp2/Smad1 signal was blocked by Bmp2 knockdown, Smad6 induction, or Noggin induction. Senescence was induced when recombinant BMP2 protein was added to Bmp2-knocked-down Ras-activated cells. Downstream Bmp2-Smad1 target genes were then analyzed genome-wide by ChIP-sequencing using anti-Smad1 antibody in MEF that was exposed to BMP2. Smad1 target sites were enriched nearby transcription start sites of genes, which significantly correlated to upregulation by BMP2 stimulation. While Smad6 was one of Smad1 target genes to be upregulated by BMP2 exposure, Smad6 repression in Ras-activated cells with increased enrichment of Ezh2 and gain of H3K27me3 suggested epigenetic disruption of negative feedback by Polycomb. Among Smad1 target genes that were upregulated in Ras-activated cells without increased repressive mark, Parvb was found to contribute to growth inhibition as Parvb knockdown lead to escape from senescence. It was revealed through genome-wide analyses in this study that Bmp2-Smad1 signal and its regulation by harmonized epigenomic alteration play an important role in Ras-induced senescence.
Published in the journal:
. PLoS Genet 7(11): e32767. doi:10.1371/journal.pgen.1002359
Category:
Research Article
doi:
https://doi.org/10.1371/journal.pgen.1002359
Summary
Cellular senescence involves epigenetic alteration, e.g. loss of H3K27me3 in Ink4a-Arf locus. Using mouse embryonic fibroblast (MEF), we here analyzed transcription and epigenetic alteration during Ras-induced senescence on genome-wide scale by chromatin immunoprecipitation (ChIP)-sequencing and microarray. Bmp2 was the most activated secreted factor with H3K4me3 gain and H3K27me3 loss, whereas H3K4me3 loss and de novo formation of H3K27me3 occurred inversely in repression of nine genes, including two BMP-SMAD inhibitors Smad6 and Noggin. DNA methylation alteration unlikely occurred. Ras-activated cells senesced with nuclear accumulation of phosphorylated SMAD1/5/8. Senescence was bypassed in Ras-activated cells when Bmp2/Smad1 signal was blocked by Bmp2 knockdown, Smad6 induction, or Noggin induction. Senescence was induced when recombinant BMP2 protein was added to Bmp2-knocked-down Ras-activated cells. Downstream Bmp2-Smad1 target genes were then analyzed genome-wide by ChIP-sequencing using anti-Smad1 antibody in MEF that was exposed to BMP2. Smad1 target sites were enriched nearby transcription start sites of genes, which significantly correlated to upregulation by BMP2 stimulation. While Smad6 was one of Smad1 target genes to be upregulated by BMP2 exposure, Smad6 repression in Ras-activated cells with increased enrichment of Ezh2 and gain of H3K27me3 suggested epigenetic disruption of negative feedback by Polycomb. Among Smad1 target genes that were upregulated in Ras-activated cells without increased repressive mark, Parvb was found to contribute to growth inhibition as Parvb knockdown lead to escape from senescence. It was revealed through genome-wide analyses in this study that Bmp2-Smad1 signal and its regulation by harmonized epigenomic alteration play an important role in Ras-induced senescence.
Introduction
Cellular senescence was first described as the limited replicative capacity of primary cells in culture [1]. Activated oncogenes can induce premature form of cellular senescence, and cells fall into irreversible arrest to block cellular proliferation [2], [3]. In addition to cell death programs such as apoptosis and autophagy, oncogene-induced senescence is recognized as a potent barrier against oncogenic transformation, suppressing unscheduled proliferation of early neoplastic cells [4]–[7].
Replicative senescence and oncogene-induced senescence are known to comprise activation of tumor suppressor pathways including p16Ink4a-Rb and p19Arf (p14ARF in human)-p53 signaling cascades. Genetic and epigenetic inactivation of these genes in cancer supported their crucial roles in senescence as barriers to tumorigenesis [8], [9]. Although the roles of RB and p53 signaling pathways in senescence are undisputed, it has become clear that other factors are also involved. Expression of secreted factors, or “senescence-messaging secretome”, has been proposed as an example of such mechanisms [10], [11]. The induction of senescence required several secreted factors including members of Wnt, insulin, transforming growth factor-β, plasmin and interleukin signaling cascades [11].
Epigenetic mechanism is also suggested to play important roles in senescence. When human fibroblasts senesced, heterochromatic regions condensed to form senescence-associated heterochromatic foci, where regions with histone H3K9 trimethylation (H3K9me3) gathered [12], and were recently shown to restrain DNA damage response [13]. Expression of Jhdm1b, a demethylase specific for H3K36me2, caused cell immortalization or leukemic transformation depending on its demethylase activity on p15Ink4b, and its knock down resulted in cellular senescence [14], [15]. INK4A and ARF region in young cells was repressed by H3K27me3 imposed by the Polycomb Group proteins, and the repressive mark was lost during oncogene-induced senescence, resulting in expression of p16 and p19; the loss of repressive mark was also detected when mouse embryonic fibroblast (MEF) underwent stress-induced senescence around seven passages [16]–[19]. Jmjd3, a histone demethylase for H3K27, was found to be essential in senescence, and its knock down lead to escape from senescence sustaining repression of p16 by H3K27me3 [20], [21].
In the previous studies, we comprehensively analyzed aberrant promoter DNA methylation in colorectal cancer and reported three distinct DNA methylation epigenotypes [22], [23]. Distinct methylation epigenotypes significantly correlated to different oncogene mutation statuses, suggesting that epigenotypes of cancer might perhaps be requisite phenotype of aberrant methylation to escape from oncogene-induced senescence by inactivation of critical factors of senescence [23], [24]. To gain insight in phenotype of critical gene inactivation in oncogene-mutation(+) cancer, we aim to clarify critical genes/signals/phenomena in oncogene-induced senescence in normal cells in this study.
Here we perform genome-wide analyses of epigenetic and gene expression changes in Ras-indeced senescence using mouse embryonic fibroblasts (Figure S1). We show that Bmp2/Smad1 signal is critical in Ras-induced senescence, and is regulated by coordinated epigenomic alteration. We further examine downstream target genes of this critical signal on genome-wide scale, and show that the epigenomic regulation of the signal involves disruption of negative feedback loop, and that activated downstream targets actually include a gene to contribute to growth arrest.
Results
Gene expression analysis
To induce cellular senescence, mouse embryonic fibroblasts after two passages (MEFp2) was infected with retrovirus of oncogenic Ras (RasV12) with N-terminal FLAG tag and cultured through day 10 (Figure S2A). RasV12-infected cells (RasV12 cells) showed significant increase in number of SA-βgal(+) cells, compared to MEFp2, MEF passed three more times without infection (MEFp5), mock-infected cells (Mock cells), and wild type Ras (RasG12)-infected cells (Figure 1A and Figure S2B).

Global gene expression analysis was performed using expression array. In RasV12 cells on day 10, 822 genes were upreglated and 735 genes downregulated, by >5-fold compared to MEFp2 (Tables S1, S2). Gene annotation enrichment analysis suggested that genes related to secreted protein (P = 1.8×10⁻¹⁹), extracellular region (P = 1.2×10⁻²¹), and differentiation/development (P = 3.8×10⁻¹⁰), e.g. Bmp2 and Igfbp3, were upregulated, supporting the importance of secreted factor expression in senescence. Genes related to cell cycle (P = 7.2×10⁻²²) such as Cdc6 and Mcm5 were enriched in downregulated genes, indicating growth arrest. Also genes related to secreted protein (P = 7.9×10⁻¹⁸) and extracellular region (P = 9.2×10⁻¹⁴) such as Bmp4 and Tgfb2 were enriched in downregulated genes, suggesting that dynamic control of secretome by activation and repression of secreted factors occurred during senescence.
Epigenomic alteration analysis
To analyze epigenomic gene regulation during Ras-induced senescence, we selected H3K4me3 as an active mark and H3K27me3 as a repressive mark, and mapped them by Chromatin immunoprecipitation (ChIP)-sequencing. As reported, H3K27me3 mark at p16Ink4a-p19Arf locus in MEFp2 was markedly lost in RasV12 cells (Figure 1A). ChIP-sequencing of H3K4me3 showed concurrent gain of the active mark around p16 transcription start site (TSS), which reflected increase of p16 expression in RasV12 (Figure 1B). By quantitative ChIP-PCR, significant gain of H3K4me3 and loss of H3K27me3 were validated in RasV12 cells, compared to MEFp2 (Figure 1C). Gain of H3K4me3 and loss of H3K27me3 were also detected at intermediate level in Mock and RasG12 cells (Figure 1C). Expression of p16 was also partially increased in Mock and RasG12 cells, at the similar level to MEFp5 (Figure 1B). These indicated that p16 expression could be induced partially by gain of H3K4me3 and H3K27me3 during passages, which was in agreement with the previous report of gradual H3K27me3 loss in stress-induced senescence during 5–7 passages [16], [18], but more marked alteration occurred at this locus in Ras-induced senescence. Enrichment of Ezh2, a member of the Polycomb Group proteins, was also analyzed by ChIP-PCR, and it was significantly decreased around p16 TSS in RasV12 cells compared to MEFp2 (Figure 1D).
When analyzing distribution of 36-bp reads mapped around TSS of 20,232 genes, the mapped reads were enriched within ±2 kb of TSS, mainly ±1 kb of TSS (Figure S3A), for both H3K4me3 and H3K27me3. We counted mapped reads within a window of genomic region, so that the number of mapped reads per million reads within a window is regarded as epigenetic status of the center position of the window. Within ±2 kb from TSS of each gene, the maximum number of mapped reads per million reads in a window size of 300 bp (H3K4me3) or 500 bp (H3K27me3) was regarded as the epigenetic status of each gene. A wider window was necessary for H3K27me3 because distribution of H3K27me3 was rather wide than H3K4me3 (Figure 1A and Figure S3A). The number of genes with repressive H3K27me3 mark was generally decreased in RasV12 cells (Figure S3B), in agreement of the previous reports [20], [21] that expression of Jmjd3 was increased during senescence, whereas expression of Ezh2 was decreased (Figure S4). It was expected that genes activated by losing H3K27me3 might exist other than p16 and p19, because of the decrease of genes with H3K27me3 mark in RasV12 cells.
Integrated analysis of epigenomic alteration and expression
Among 20,232 genes with epigenomic alteration analyzed, 16,793 genes were also analyzed for expression on array (Figure S5). For epigenetic status of H3K4me3, 9,164 genes in MEFp2 and 8,841 genes in RasV12 showed >4 reads per million reads around TSS, and regarded as H3K4me3(+). Similarly, 7,140 and 7,354 genes respectively with <3 reads per million reads were regarded as H3K4me3(-). Markedly higher expression levels of H3K4me3(+) genes than H3K4me3(-) genes were confirmed by comparing the mean of expression levels (Figure S5A). For H3K27me3, 2,612 and 2,370 genes with >1.5 reads per million reads around TSS were regarded as H3K27me3(+), and 13,205 and 12,841 genes with <1 were as H3K27me3(-) in this study. H3K27me3(+) genes were markedly repressed than H3K27me3(-) genes (Figure S5B).
Among 284 genes losing H3K27me3 in RasV12 cells, 30 genes losing H3K27me3 and gaining H3K4me3 simultaneously, like p16, showed significant enrichment in upregulated genes among the 284 genes (P = 0.000007, Kolmogorov-Smirnov test, Figure 2A). Among the 30 genes (listed in Table S3), Bmp2, a secreted factor for BMP/SMAD pathway, was found to be the most upregulated secreted factor and activated more than p16 (Figure 2A). Interestingly, 110 genes modified bivalently in MEFp2 showed loss of H3K27me3 and sustained H3K4me3 mark in RasV12 cells, but did not show significant enrichment in upregulated genes (P = 0.9, Figure 2A).

Not only genes with H3K27me3 loss, but also there were as many as 239 genes showing H3K27me3 gain in RasV12 cells. Nine genes gaining H3K27me3 and losing H3K4me3 simultaneously showed significant enrichment in downregulated genes (P = 0.0004, Figure 2B. Genes are listed in Table S4). Very interestingly, two of the nine genes were Smad6 and Nog, inhibitors for BMP-SMAD pathway [25]. The majority, 189 of the 239 genes, had neither modification in MEFp2 with very low expression levels. These genes acquired de novo H3K27me3 mark in RasV12 cells, but did not show any more downregulation (P = 1, Figure 2B).
Upregulation of Bmp2 in senescence
Around TSS of Bmp2, a secreted factor for BMP-SMAD pathway, loss of H3K27me3and gain of H3K4me3 were validated by quantitative ChIP-PCR (Figure 3A, 3B). ChIP-PCR also showed that Ezh2 enrichment was significantly decreased around Bmp2 in RasV12 cells (Figure S6).

ChIP-PCR showed that H3K4me3 and H3K27me3 levels in MEFp2 were sustained in Mock and RasG12, but specifically altered in RasV12 cells (Figure 3B). Quantitative RT-PCR showed very low level of Bmp2 expression in MEFp2, Mock cells and RasG12 cells, but marked increase to 91.6-fold in RasV12 cells (Figure 3C). Bmp2 activation thus occurred specifically in Ras-induced senescence, different from p16 that partially showed increased expression and histone methylation alteration during passages (Figure 1C).
Retrovirus to express shRNA against Bmp2 (shBmp2) was infected together with RasV12 infection, to knock down Bmp2 to 0.04–0.08 fold on days 3, 7, and 10 (Figure 3D). Bmp2-knocked-down RasV12 cells escaped from senescence with decreased number of SA-βgal(+) cells compared to RasV12 cells. While Smad1/5/8 is known to serve principally as substrates for BMP receptors [26], western blotting analysis revealed phosphorylation of Smad1/5/8 in RasV12 cells (Figure 3E). Decrease of Smad1/5/8 phosphorylation level was also shown in Bmp2-knocked-down RasV12 cells (Figure 3E), and continual cell growth faster than Mock cells (Figure 3F). To confirm that this escape from senescence was specifically due to Bmp2 knockdown, Bmp2-knocked-down RasV12 cells were cultured with recombinant BMP2 protein (rBMP2, R&D systems #355-BM) at 0, 20 and 200 ng/mL in culture medium with 10% serum. The cells showed increased number of SA-βgal(+) cells in dose-dependent manner, even to the level of RasV12 cells when rBMP2 was at 200 ng/mL (Figure 3G, 3H). The level of Smad1/5/8 phosphorylation was increased when rBMP was added (Figure 3I), and growth curve showed growth arrest similar to senescent RasV12 cells (Figure 3F). These results indicated that Bmp2 upregulation plays an important role in Ras-induced senescence. There was no increase of SA-βgal(+) cells when Mock cells or MEF cells without infection were exposed to rBMP2 at 200 ng/mL, indicating that increase of BMP2 alone is not enough to induce cellular senescence (Figure 3G).
Repression of Smad6 in senescence
As for Smad6, a specific inhibitor for BMP-SMAD pathway, gain of H3K27me3 and loss of H3K4me3 in RasV12 cells were found and validated by quantitative ChIP-PCR (Figure 4A, 4B). H3K27me3 and H3K4me3 levels in MEFp2 were sustained in Mock and RasG12 cells, and altered specifically in RasV12 cells. This indicated that these alterations of histone methylation were not detected in stress-induced senescence during passages, but specifically occurred in Ras-induced senescence, like Bmp2. Markedly decreased expression of Smad6 to 0.05-fold specifically in RasV12 cells was also validated by quantitative RT-PCR, while there was no repression of Smad6 during passages (Figure 4C). Ezh2 enrichment was also analyzed by ChIP-PCR (Figure 4D). This histone methyltransferase for H3K27 was significantly increased around TSS of Smad6 in RasV12 cells. It was indicated that Ezh2 was recruited to this de novo H3K27 trimethylation site, and that repression mechanism by de novo H3K27me3 was still active although Ezh2 expression level itself was downregulated during senescence, and Jmjd3 expression level was upregulated (Figure S4A).

Smad6 with N-terminal Myc tag was introduced to MEF by retroviral infection together with RasV12 virus, and their simultaneous expression was confirmed by cellular immunofluorescence (Figure 4E and Figure S7). Western blotting analysis and cellular immunofluorescence showed decrease of Smad1/5/8 phosphorylation in Smad6-introduced RasV12 cells compared to RasV12 cells (Figure 4F, 4G). Smad6-introduced RasV12 cells showed decreased number of SA-βgal(+) cells compared to RasV12 cells (Figure 4H and Figure S8) and showed continual cell growth faster than Mock cells or Smad6-introduced Mock cells (Figure 4I). These data indicated that Smad6 repression was important in Ras-induced senescence.
Repression of Nog in senescence
Nog, another inhibitor for BMP-SMAD pathway, was repressed to 0.06-fold in RasV12 cells also by losing H3K4me3 and gaining H3K27me3 (Figure 5A, 5B). Introduction of Nog cDNA by retrovirus infection together with RasV12 resulted in its overexpression and escape from senescence (Figure 5B–5D).
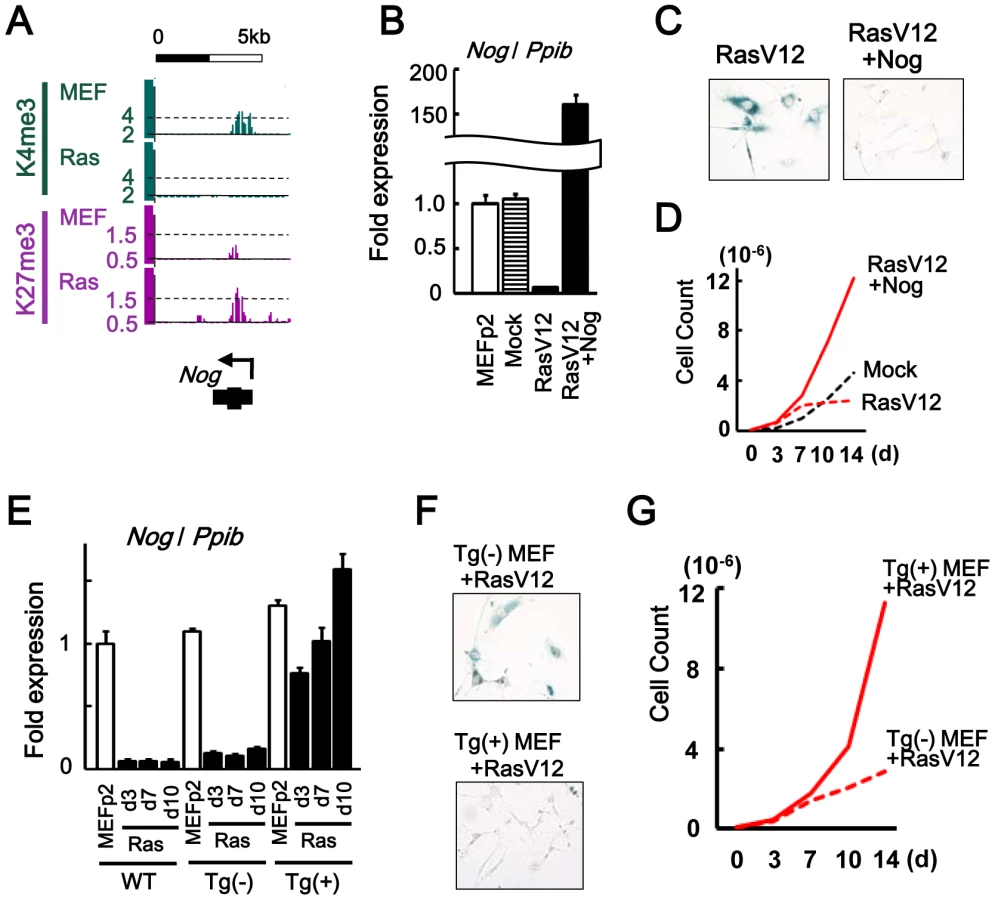
To clarify whether Nog at the physiological expression level could inhibit cellular senescence, Nog-transgenic (Nog-Tg) mice under Krt19 promoter [27] was used next, since the transgene was expected not to be modified with de novo H3K27me3. Krt19 was expressed in MEFp2 at much higher level compared to brain and testis, confirming that Krt19 promoter is active in MEF (Figure S9). Nog-Tg female mouse was crossed with C57B6, to establish and pool Tg(-) and Tg(+) MEFs from embryos of the same mother. Tg(+) MEF showed Nog expression at similar level to wild type MEFp2 and Tg(-) MEF (Figure 5E). While Tg(-) MEF showed Nog repression by RasV12 infection similarly to wild type MEF, Tg(+) MEF did not show Nog repression by RasV12 infection and showed continual growth faster than Tg(-) MEF (Figure 5E–5G). These indicated that Nog repression was also important in Ras-induced senescence.
No detection of DNA methylation alteration
It was reported that oncogenic Ras induces DNA methylation-mediated epigenetic inactivation in NIH3T3 cells [28], and that EZH2 directly controls DNA methylation [29], [30]. We therefore performed bisulfite sequencing to analyze DNA methylation statuses of 5′ regions of Smad6 and Bmp2 where increase or decrease of Ezh2 was confirmed (Figure 4D, Figure S6). There was no methylation alteration of these regions in RasV12 cells compared to MEFp2 (Figure 6A). Also, Dnmt1 expression level was not altered during Ras-induced senescence (Figure 6B). To gain insight whether oncogenic Ras induces DNA methylation-mediated inactivation in MEF on genome-wide scale, we performed methylated DNA immunoprecipitation (MeDIP)-seq in MEFp2 and RasV12 cells (Figure 6C, 6D). Although MeDIP is reported to be not accurate to detect DNA methylation in low-CpG regions, it is powerful screening method to detect candidate methylation regions in high-CpG regions, e.g. promoter CpG islands [22], [23], [31]. Increase of methylation was detected only in three candidate genes, and the increase was considered as a noise in genome-wide analysis because the increase was not validated by bisulfite sequencing (Figure 6D, 6E). Bisulfite sequencing was performed for five more genes which showed slight increase of methylation in MeDIP-seq, but there was no methylation alteration in RasV12 cells compared to MEFp2 (Figure 6F).

Ras-induced senescence of human fibroblast IMR90
Human fibroblast IMR90 was infected with RasV12 retrovirus (RasV12-IMR90 cells). It was confirmed by SA-βgal staining on day 7 that cells fell into premature senescence (Figure S10A). Real-time RT-PCR showed that BMP2 expression was markedly increased to 145-fold in RasV12-IMR90 cells, while SMAD6 and NOG expressions were decreased to 0.32-fold and 0.15-fold, respectively (Figure S10B). Nog was introduced in IMR90 by retroviral infection with RasV12, and Nog-induced RasV12-IMR90 cells showed continual cellular growth (Figure S10C), suggesting that BMP2-SMAD1 is also an effector program in human fibroblasts.
Downstream target genes of Bmp2-Smad1 signal analyzed by ChIP-sequencing
Since Bmp2 upregulation, Smad6 repression, and Nog repression were shown to contribute to Ras-induced senescence, downstream target genes of Bmp2-Smad1 signal are further analyzed on genome-wide scale.
Smad1 binding sites in MEF were analyzed by exposing MEF to rBMP and ChIP-sequencing using anti-Smad1 antibody (Figure 7A and Figure S11). Smad1 mostly bound to gene regions; 1,103 (75%) out of 1,479 Smad1 binding sites were located within 10 kb from 20,232 RefSeq genes, and 818 sites (55%) were within 5 kb from their TSS. Using GADEM (http://www.niehs.nih.gov/research/resources/software/gadem/) [32], GGGGCGGGGC was extracted as highly enriched motif within Smad1 binding region in both whole genomic and TSS regions (Figure 6B, Figure S12). Using DME (http://rulai.cshl.edu/dme/) [33], it was confirmed that very similar motifs e.g. GGGCGGGGC (Figure 7B) or GGGGCGGGGM (Figure S13) were enriched. This was in good agreement with the canonical SMAD1-bound GC-rich elements [26], [34], [35] and the previous report that the sequence GGCGGGGC was enriched within Smad1/5 binding regions in ES cells and pulled down SMAD proteins [36]. Genes with Smad1 binding site at TSS regions were significantly enriched in active genes in MEF, especially in genes upregulated by rBMP exposure (Figure 7C), suggesting that Smad1 binding correlates to gene upregulation. Smad1 target genes upregulated most by rBMP exposure included Smad6, which was upregulated by 4.5-fold in MEF (Figure 7D, 7E). These indicated that Bmp2/Smad1 signal in MEF could be controlled by negative feedback through Smad1 regulation on Smad6.

Smad1 target genes repressed or activated during senescence
However, Smad6 was repressed in RasV12 cells by H3K27me3, so when Bmp2-knocked-down RasV12 cells was exposed to rBMP2, Smad6 level was still suppressed lower than the level in MEFp2 (Figure 7E). Smad1 target genes repressed in RasV12 cells were not limited to Smad6. H3K27me3 gain during Ras-induced senescence was detected in 50 Smad1 target genes, which were enriched in genes repressed in RasV12 cells, e.g. Atoh8. Atoh8 was highly upregulated in BMP2 exposure, but repressed in RasV12 cells with decrease of H3K4me3 from 8.7 to 1.8 and increase of H3K27me3 mark from 1.0 to 1.8 (Figure 7C, Figure 8A and 8B. Gene list is available in Table S5). It was reported that Atoh8 was, like Id1, suggested to be a direct target of BMP-SMAD signal [37].
On the contrary, Smad1 target genes without increased repressive mark were shown to keep upregulation. Among 838 Smad1 target genes, 581 with no increase of H3K27me3, or 156 showing decrease of H3K27me3, were significantly enriched in genes upregulated in RasV12 cells (P = 0.01 and P = 0.004, respectively, Figure 8A). If Bmp2/Smad1 signal is critical in senescence, the most upregulated target genes are expected to include genes with growth suppressor function. To choose such candidate genes, the most upregulated target genes were screened using promoter methylation data of our previous methylated DNA-immunoprecipitation (MeDIP)-chip analyses of human cancer cells [22], [23] (Table S6), since such genes may possibly be frequently inactivated in human cancer. The most upregulated targets then included Parvb, which showed promoter methylation in human cancer cell lines HCT116 and DLD1 (Table S6). When MEF senesced, Parvb showed increase of H3K4me3 from 8.6 to 16.8, and decrease of H3K27me3 from 1.0 to 0.6 (Figure 8B). Real-time RT-PCR validated increase of Parvb expression in RasV12 cells, and also when exposed to rBMP2 (Figure 8C). When Parvb was knocked down to 0.05-fold by shRNA, SA-βgal(+) cells were partially decreased and cells showed continual growth (Figure 8D and Figure S14). Western blot analysis showed decrease of Akt phosphorylation in exposure to a growth factor or serum when Parvb with C-terminal V5 tag was introduced in MEF (Figure 8E).

Discussion
In this study, we examined H3K4me3 and H3K27me3 marks for genome-wide analysis of epigenomic changes, revealing that activation of Bmp2-Smad1 signal is important in Ras-induced senescence and it is regulated by dynamic epigenomic alteration in coordinated manner. Different from p16, H3K4me3 and H3K27me3 marks on Bmp2 was not altered during passage in cell culture, but specifically altered in RasV12 cells to induce its marked upregulation, leading to Smad1/5/8 phosphorylation and cellular senescence. Decrease of Ezh2 and increase of Jmjd3 were detected in RasV12 cells at similar levels to MEFp5, Mock cells and RasG12 cells. This may contribute to partial increase of p16 expression in MEFp5, Mock cells and RasG12 cells, and partial decrease of H3M27me3 mark on p16 in stress-induced senescence during passages as reported [16], [18]. However, the alterations on p16 were more markedly detected in RasV12 cells, and the alterations on Bmp2 and Smad6 were specifically detected in Ras-induced senescence and did not occur during passages. It is noteworthy that de novo formation of H3K27me3 occurs on Smad6 in RasV12 cells in spite of general decrease of Ezh2 and increase of Jmjd3.
The mechanism how these epigenetic regulations are programmed is largely unknown, but one possible answer might be non-coding RNA [38], [39]. PRC2 was reported to be recruited in trans to its target gene by virtue of its association with HOTAIR, a 2.2 kb non-coding RNA in the HOXC locus [40]. Oncogenic Ras inhibited expression of ANRIL (antisense non-coding RNA in the INK4 locus); ANRIL showed binding to CBX7 within PRC1 and SUZ12 in PRC2, and was important in repressing the protein-coding genes of INK4b/ARF/INK4a locus in cis to regulate senescence [41], [42]. Ezh2 recruitment was increased in Smad6, and decreased in Bmp2 and p16 (Figure 1D, Figure 4D, Figure S6). It would be interesting to analyze whether any non-coding RNAs recruit PRC to Smad6 and Bmp2 in cis or trans, and their expression alterations contribute to epigenetic alterations of these genes during Ras-induced senescence.
Gene repressions by other epigenetic mechanism than Polycomb, such as H3K9 methylation, would be interesting to be analyzed next. Human fibroblasts in senescence are reported to suppress DNA damage response by forming heterochromatic foci, where regions with methylated H3K9 gathered [12]. Amplification of SETDB1, a methyltransferase for H3K9, was recently reported to play an accelerating role in melanoma onset [13], while knockout of Suv39h1, another histone methyltransferase for H3K9, caused escape from senescence of lymphocytes [43], suggesting necessity of adequate control of H3K9 methylation. Genome-wide analyses of methylated H3K9 and other epigenomic marks as well would be helpful to obtain the whole picture of epigenomic alteration and its importance in senescence.
As for DNA methylation, it was reported that oncogenic Ras induces DNA methylation-mediated epigenetic inactivation in NIH3T3 cells and that 28 responsible genes including DNMT1 are required for the methylation [28]. DNA methylation statuses at 5′ regions of Smad6 and Bmp2 were not altered, however, indicating that expression changes of these genes during senescence were not due to DNA methylation. Dnmt1 level was not altered in RasV12 cells, either. Increase of methylation was detected only in three candidate genes by MeDIP-seq analysis, and the increase was considered as a noise in genome-wide analysis because the increase was not validated by bisulfite sequencing. Five more genes were chosen for bisulfite sequencing, because Sfrp1 was reported to be methylated by oncogenic Ras in NIH3T3[28], and four other genes were chosen randomly from genes with slight increase of methylation in MeDIP-seq. There was no methylation alteration in RasV12 cells compared to MEFp2, either. Although MeDIP is not accurate to detect DNA methylation in low-CpG regions [22], [31], it was suggested that DNA methylation unlikely occurs in Ras-induced senescence, at least high-CpG regions e.g. promoter CpG islands. The discrepancy between the previous report of NIH3T3 and our MEF result may be because MEF falls into cellular arrest by oncogenic stress and there might be no time enough to induce DNA methylation alteration. In NIH3T3, cells transform by oncogenic Ras, and may have time enough to acquire DNA methylation during continuing proliferation. Or, two independent cells, NIH3T3 (ATCC #CRL-1658) and K-ras-transformed NIH3T3 (ATCC #CRL-6361), were compared in the previous NIH3T3 study [28], so the result might be different if one NIH3T3 clone is analyzed at time courses before and after induction of activated Ras.
As for BMP-SMAD signals, utilization of four BMP type 1 receptors depends on BMP ligands; BMP2 and BMP4 utilize BMPR1A and BMPR1B, BMP6 and BMP7 bind principally to ACVR1, and BMP9 is a ligand for ACVRL1 and ACVR1 [26]. We reported that Smad6 inhibited BMPR1A/BMPR1B preferentially to ACVR1/ACVRL1, and inhibited BMP2-induced Smad1/5 phosphorylation more prominently than BMP6-induced Smad1/5 phosphorylation [44]. This is in agreement with the current results that Smad6 could cause decreased phosphorylation of Smad1/5 and escape from senescence, and that coordination of Bmp2 upregulation and Smad6 repression was critical in Ras-induced senescence.
Our genome-wide analysis showed that Smad6 was a Smad1 target gene that could be highly upregulated by exposure to BMP2, but strongly repressed in RasV12 cells with de novo H3K27me3 mark. Previous reports showed that BMP-activated Smad1/5 activates Smad6 expression through interaction with the Smad6 promoter [45], [46]. These suggested that Smad6 repression with de novo H3K27 methylation blocks negative feedback loop to sustain the effect of upregulated Bmp2, i.e. activation of Bmp2-Smad1 signal in Ras-induced senescence. In other words, dynamic H3K27me3 alteration is suggested to repress selectively the genes which could negatively control senescent signal, and to activate selectively genes which could positively affect senescent signal (Figure 9). In fact, another BMP-SMAD inhibitor, Nog, was also repressed by increased H3K27me3 mark. While ChIP-seq analysis did not show Smad1 binding site around Nog TSS, Nog was also highly upregulated by rBMP2 exposure (Figure 6C) and repressed by increased H3K27me3 mark in RasV12 cells (Figure 5A, 5B). This might suggest that Nog repression could also be a disruption of negative feedback loop, though Nog is not a direct downstream target of Bmp2-Smad1.

Parvb, which possessed Smad1 binding site around its TSS, was upregulated in exposure to BMP2 or in RasV12 cells, and its knock down lead to escape from senescence. While PARVA was reported to bind to integrin-linked kinase (ILK) and play a critical role in cell survival by promoting membrane recruitment of Akt and its activation by phosphorylation, PARVB was reported to compete PARVA in binding to ILK and reverse its oncogenic effect by repressing ILK kinase activity [47], [48]. As PARVB introduction was reported to suppress cellular growth of breast cancer cells with decreased Akt phosphorylation [49], [50], Parvb introduction in MEF also decreased phosphorylation of Akt in exposure to a growth factor or serum (Figure 7E). It was suggested that Parvb might be one of Bmp2-Smad1 target genes playing a positive role in growth inhibition, at least partly, and selectively and effectively activated through simultaneous inactivation of negative regulators. We chose Parvb on the assumption that candidate genes downstream of BMP-SMAD might be inactivated by DNA methylation in full-blown cancers, but other downstream genes that were not methylation target in analyzed cancer cell lines might also play a positive role in senescence.
Aberrations in BMP-SMAD signal have been frequently reported in human cancer. Juvenile polyposis syndrome, an inherited syndrome with high risk of colorectal cancer, is caused by germline mutation of BMPR1A or SMAD4 [51], and importance of BMP signal is supported by its mouse model with transgenic Nog expression or with Bmpr1a inactivation [52], [53]. BMP2 expression was lost in microadenoma of familial adenomatous polyposis, while BMP2 was expressed in mature colonic epithelial cells, promoting apoptosis and differentiation and inhibiting proliferation [54]. Inactivation of BMPR1A, BMPR2, and SMAD4 was frequently observed in sporadic colorectal cancer, correlating to loss of Smad1/5/8 phosphorylation [55]. Colon epithelial polyps were developed even by alteration of BMP pathway in the stromal microenvironment, using mice with conditional inactivation of Bmpr2 in the stroma [56]. About prognosis, Smad6 expression was reported to be elevated in 40% of non-small cell lung cancer, and correlated to poorer outcome [57]. BMP2 upregulation was reported in senescence of other cell types, such as vascular smooth muscle cells [58]. Considering frequent RAS gene mutation in cancer, e.g. colon (∼40%) and non-small cell lung cancers (∼30%) [59], further experiments are to be performed to clarify which cell types Bmp2-Smad1 signal is critical in oncogene-induced senescence, and whether Bmp2-Smad1 signal and its target genes are disrupted in cancer with association to oncogene mutation.
Materials and Methods
Full information of Material and Methods is also described in Supporting Materials and Methods (Text S1).
Cells and viral infection
MEF was established from 13.5 embryonic day embryos of C57/B6 as reported [60]. After cells were passed twice (MEFp2), cells were infected with retroviruses for 48 hours. Then cells were exposed to 4 µg/mL puromycin for selection during days 0–3, and were passed on days 3, 7, and 10. Human fibroblast IMR90 (JCRB9054) was purchased from Health Science Research Resources Bank (Osaka, Japan), and 2 µg/mL puromycin were used for selection after retrovirus infection. Total RNA was collected using TRIzol (Invitrogen, Carlsbad, CA). This study was certified by Animal Ethics Committee in Tokyo University.
MEF of Nog-trangenic (Nog-Tg) mice
Nog-Tg mice using keratin 19 gene promoter and mouse Nog cDNA were previously established [27], and were crossed with wild type C57/B6 mice five times to obtain C57/B6 background. Nog-Tg female mouse was crossed with C57B6, and Tg(-) and Tg(+) MEFs were established from 13.5 embryonic day embryos of the same mother. Each embryo was minced separately, and Tg(-) and Tg(+) MEFs were pooled after genotyping each MEF, and used for experiments.
Retroviral vectors
Retroviral vectors for Ras was constructed by cloning cDNAs for wild type HRAS (RasG12) and mutated HRAS (RasV12) by reverse-transcription PCR products from HMEC and SK-BR3 cell RNA, respectively, with N-terminal FLAG tag into pMX vector that contains puromycin resistance gene (a kind gift from T. Kitamura). Mock pMX vector (Mock), and vectors containing RasG12 and oncogenic RasV12 were transfected into plat-E packaging cells (a kind gift from T. Kitamura) using FuGENE 6 Transfection Reagent (Roche, Germany) to prepare retroviruses. Smad6 cDNA with N-terminal 6x Myc tag, Nog cDNA with C-terminal V5 tag, and Parvb cDNA with C-terminal V5 tag were also cloned into pMX vector. To knock down Bmp2 or Parvb, double strand oligonucleotide DNA to express small hairpin RNA against Bmp2 (shBmp2) or Parvb (shParvb), respectively, was cloned into RNAi-Ready pSIREN-RetroQ Vector (Clontech, CA). Viral packaging for Smad6, Nog, shBmp2 and shParvb retrovirus vectors was also done using plat-E cells. Retroviruses of RasV12 and Nog for human fibroblast were prepared using Retrovirus Packaging Kit Ampho (#6161, TaKaRa Bio Inc, Shiga, Japan).
Expression array analysis
For genome-wide transcription analysis, GeneChip Mouse Genome 430 2.0 Array (Affymetrix) was used as described [61]. The GeneChip data were analyzed using the Affymetrix GeneChip Operating Software v1.3 by MAS5 algorithms, to obtain signal value (GeneChip score) for each probe. For global normalization, the average signal in an array was made equal to 100. Gene annotation enrichment analysis was done at DAVID Bioinformatics Resources (http://david.abcc.ncifcrf.gov/). Array data is available at GEO datasets (#GSE18125).
ChIP, MeDIP, and sequencing
MEFp2 and infected cells at day 10 were cross-linked with 1% formaldehyde for 10 min and were prepared for ChIP. ChIP using anti-H3K4me3 (ab8580, abcam, rabbit polyclonal), H3K27me3 (07–142, Upstate, rabbit polyclonal), or Ezh2 (#39103, Active Motif, rabbit polyclonal) antibody was performed as described previously [62]. For ChIP using anti-Smad1 antibody (BioMatrix, mouse monoclonal), MEFp2 cells were starved for 16 hours and exposed to rBMP2 protein (#355-BM, R&D systems) at 25 ng/mL in serum-free medium for 1.5 hours. Cells were cross-linked with 1 mM Disuccinimidyl Glutarate (Thermo Scientific, Rockford, IL) for 20 min and 1% formalin for 10 min, and ChIP was performed similarly.
For MeDIP, genomic DNA of MEFp2 and RasV12 cells was fragmented by sonication, and immunoprecipitated by anti 5-methylcytocine monoclonal antibody (kindly supplied by Dr. K. Watanabe, Toray Research Center, Inc.), as we previously reported[22], [23], [63]. MeDIPed sample and Input sample underwent MeDIP-PCR to check enrichment of methylated regions in MeDIPed sample.
Sample preparation for ChIP - and MeDIP-sequencing was performed according to the manufacturer's instructions (Illumina), and sequencing was performed using Solexa Genome Analyzer II [61]. 36-bp single end reads were mapped to the NCBI Build #36 (UCSC mm8) reference mouse genome, using the Illumina pipeline software v1.4. The numbers of uniquely mapped reads for MEFp2 were 10,845,082 (H3K4me3), 11,519,151 (H3K27me3), 9,663,324 (DNA methylation) and 5,688,804 (Input), those for RasV12 cells were 13,246,871 (H3K4me3), 9,894,241 (H3K27me3), 11,319,506 (DNA methylation) and 6,126,206 (Input), and that for Smad1 ChIP-sequencing was 9,417,307. Window sizes of 300 bp for H3K4me3, 500 bp for H3K27me3, 500 bp for DNA methylation and 300 bp for Smad1, were used to calculate the number of mapped reads per million reads at the center of the window. Sequencing data is also available (#GSE18125).
Immunoblot analysis
Aliquots of protein were subjected to SDS/PAGE and were transferred to nitrocellulose, and the resulting immunoblots were visualized using Amersham ECL Plus (GE Healthcare) and LAS-3000 (Fujifilm, Japan).
Cellular immunofluorescence
Phosphorylated Smad1/5/8 was detected using antibody against phospho-Smad1/5/8 (Cell Signaling) as primary antibody, and green-fluorescent Alexa Fluor 488 dye-labeled anti-rabbit antibody (Invitrogen) as secondary antibody. RasV12 with N-terminal FLAG tag and Smad6 with N-terminal Myc tag were detected using antibody against FLAG (F7425, Sigma, rabbit polyclonal) and Myc (9E10, Santa Cruz, mouse monoclonal) as primary antibody, respectively, and Alexa Fluor 594 anti-rabbit antibody and Alexa Fluor 488 anti-mouse antibody (Invitrogen) as secondary antibody. Photographs were taken with Biozero BZ-8100 (KEYENCE, Osaka, Japan).
Senescence-associated β-galactosidase (SA-βgal) analysis
MEFp2 and infected MEFs on day 10, and infected IMR90 on day 7 underwent SA-βgal staining as previously described [64].
Growth curve
Infected MEFs were counted on days 3, 7, 10, 14, 17, 21 using Countess automated cell counter (Invitrogen) and seeded at density of 1×10⁵ cells/6-cm dish for every passage. Infected IMR90 were counted on days 4, 8, 12 and 16 similarly, and seeded at density of 2.5×10⁵ cells/6-cm dish. Mean number of three dishes was calculated and used to draw growth curve.
Quantitative real-time RT-PCR, ChIP-PCR, and MeDIP-PCR
Real-time PCR was performed using iCycler Thermal Cycler (Bio-Rad Laboratories) as previously described [65]. The experiment was triplicated and mean and standard error were calculated and shown. Primer information is in Tables S7 and S8.
Bisulfite treatment and bisulfite sequencing
DNA methylation status was analyzed by bisulfite sequencing as previously described [65]. Briefly, 500 ng of genomic DNA of MEFp2 and RasV12 cells underwent bisulfite treatment, and were finally suspended in 20 µL of distilled water. For bisulfite sequencing, 1 µl was used as a template for PCR with primers common for methylated and unmethylated DNA sequences. The primers and PCR conditions are available at Table S9. PCR products were cloned into pGEM-T Easy vector (Promega), and 9–10 clones each were cycle-sequenced using T7 and Sp6 primers.
Supporting Information
Zdroje
1. HayflickL 1965 The Limited in Vitro Lifetime of Human Diploid Cell Strains. Exp Cell Res 37 614 636
2. SerranoMLinAWMcCurrachMEBeachDLoweSW 1997 Oncogenic ras provokes premature cell senescence associated with accumulation of p53 and p16INK4a. Cell 88 593 602
3. KuilmanTMichaloglouCMooiWJPeeperDS 2010 The essence of senescence. Genes Dev 24 2463 2479
4. CampisiJ 2005 Senescent cells, tumor suppression, and organismal aging: good citizens, bad neighbors. Cell 120 513 522
5. NaritaMLoweSW 2005 Senescence comes of age. Nat Med 11 920 922
6. PrieurAPeeperDS 2008 Cellular senescence in vivo: a barrier to tumorigenesis. Curr Opin Cell Biol 20 150 155
7. IvanovAAdamsPD 2011 A damage limitation exercise. Nat Cell Biol 13 193 195
8. SharplessNEDePinhoRA 2005 Cancer: crime and punishment. Nature 436 636 637
9. GilJPetersG 2006 Regulation of the INK4b-ARF-INK4a tumour suppressor locus: all for one or one for all. Nat Rev Mol Cell Biol 7 667 677
10. CoppeJPPatilCKRodierFSunYMunozDP 2008 Senescence-associated secretory phenotypes reveal cell-nonautonomous functions of oncogenic RAS and the p53 tumor suppressor. PLoS Biol 6 e301 doi:10.1371/journal.pbio.0060301
11. KuilmanTPeeperDS 2009 Senescence-messaging secretome: SMS-ing cellular stress. Nat Rev Cancer 9 81 94
12. NaritaMNunezSHeardELinAWHearnSA 2003 Rb-mediated heterochromatin formation and silencing of E2F target genes during cellular senescence. Cell 113 703 716
13. Di MiccoRSulliGDobrevaMLiontosMBotrugnoOA 2011 Interplay between oncogene-induced DNA damage response and heterochromatin in senescence and cancer. Nat Cell Biol 13 292 302
14. HeJKallinEMTsukadaYZhangY 2008 The H3K36 demethylase Jhdm1b/Kdm2b regulates cell proliferation and senescence through p15(Ink4b). Nat Struct Mol Biol 15 1169 1175
15. HeJNguyenATZhangY 2011 KDM2b/JHDM1b, an H3K36me2-specific demethylase, is required for initiation and maintenance of acute myeloid leukemia. Blood 2011 Feb 2010 Epub
16. ParrinelloSSamperEKrtolicaAGoldsteinJMelovS 2003 Oxygen sensitivity severely limits the replicative lifespan of murine fibroblasts. Nat Cell Biol 5 741 747
17. JacobsJJKieboomKMarinoSDePinhoRAvan LohuizenM 1999 The oncogene and Polycomb-group gene bmi-1 regulates cell proliferation and senescence through the ink4a locus. Nature 397 164 168
18. BrackenAPKleine-KohlbrecherDDietrichNPasiniDGargiuloG 2007 The Polycomb group proteins bind throughout the INK4A-ARF locus and are disassociated in senescent cells. Genes Dev 21 525 530
19. KotakeYCaoRViatourPSageJZhangY 2007 pRB family proteins are required for H3K27 trimethylation and Polycomb repression complexes binding to and silencing p16INK4alpha tumor suppressor gene. Genes Dev 21 49 54
20. AggerKCloosPARudkjaerLWilliamsKAndersenG 2009 The H3K27me3 demethylase JMJD3 contributes to the activation of the INK4A-ARF locus in response to oncogene - and stress-induced senescence. Genes Dev 23 1171 1176
21. BarradasMAndertonEAcostaJCLiSBanitoA 2009 Histone demethylase JMJD3 contributes to epigenetic control of INK4a/ARF by oncogenic RAS. Genes Dev 23 1177 1182
22. HayashiHNagaeGTsutsumiSKaneshiroKKozakiT 2007 High-resolution mapping of DNA methylation in human genome using oligonucleotide tiling array. Hum Genet 120 701 711
23. YagiKAkagiKHayashiHNagaeGTsujiS 2010 Three DNA methylation epigenotypes in human colorectal cancer. Clin Cancer Res 16 21 33
24. KanedaAYagiK 2011 Two groups of DNA methylation markers to classify colorectal cancer into three epigenotypes. Cancer Sci 102 18 24
25. ChenDZhaoMMundyGR 2004 Bone morphogenetic proteins. Growth Factors 22 233 241
26. MiyazonoKKamiyaYMorikawaM 2010 Bone morphogenetic protein receptors and signal transduction. J Biochem 147 35 51
27. OshimaHItadaniHKotaniHTaketoMMOshimaM 2009 Induction of prostaglandin E2 pathway promotes gastric hamartoma development with suppression of bone morphogenetic protein signaling. Cancer Res 69 2729 2733
28. GazinCWajapeyeeNGobeilSVirbasiusCMGreenMR 2007 An elaborate pathway required for Ras-mediated epigenetic silencing. Nature 449 1073 1077
29. VireEBrennerCDeplusRBlanchonLFragaM 2006 The Polycomb group protein EZH2 directly controls DNA methylation. Nature 439 871 874
30. SchlesingerYStraussmanRKeshetIFarkashSHechtM 2007 Polycomb-mediated methylation on Lys27 of histone H3 pre-marks genes for de novo methylation in cancer. Nat Genet 39 232 236
31. WeberMHellmannIStadlerMBRamosLPaaboS 2007 Distribution, silencing potential and evolutionary impact of promoter DNA methylation in the human genome. Nat Genet 39 457 466
32. LiL 2009 GADEM: a genetic algorithm guided formation of spaced dyads coupled with an EM algorithm for motif discovery. J Comput Biol 16 317 329
33. SmithADSumazinPZhangMQ 2005 Identifying tissue-selective transcription factor binding sites in vertebrate promoters. Proc Natl Acad Sci U S A 102 1560 1565
34. KorchynskyiOten DijkeP 2002 Identification and functional characterization of distinct critically important bone morphogenetic protein-specific response elements in the Id1 promoter. J Biol Chem 277 4883 4891
35. MassagueJSeoaneJWottonD 2005 Smad transcription factors. Genes Dev 19 2783 2810
36. FeiTXiaKLiZZhouBZhuS 2010 Genome-wide mapping of SMAD target genes reveals the role of BMP signaling in embryonic stem cell fate determination. Genome Res 20 36 44
37. KautzLMeynardDMonnierADarnaudVBouvetR 2008 Iron regulates phosphorylation of Smad1/5/8 and gene expression of Bmp6, Smad7, Id1, and Atoh8 in the mouse liver. Blood 112 1503 1509
38. ZhaoJSunBKErwinJASongJJLeeJT 2008 Polycomb proteins targeted by a short repeat RNA to the mouse X chromosome. Science 322 750 756
39. HirotaKMiyoshiTKugouKHoffmanCSShibataT 2008 Stepwise chromatin remodelling by a cascade of transcription initiation of non-coding RNAs. Nature 456 130 134
40. RinnJLKerteszMWangJKSquazzoSLXuX 2007 Functional demarcation of active and silent chromatin domains in human HOX loci by noncoding RNAs. Cell 129 1311 1323
41. YapKLLiSMunoz-CabelloAMRaguzSZengL 2010 Molecular interplay of the noncoding RNA ANRIL and methylated histone H3 lysine 27 by polycomb CBX7 in transcriptional silencing of INK4a. Mol Cell 38 662 674
42. KotakeYNakagawaTKitagawaKSuzukiSLiuN 2011 Long non-coding RNA ANRIL is required for the PRC2 recruitment to and silencing of p15(INK4B) tumor suppressor gene. Oncogene 30 1956 1962
43. BraigMLeeSLoddenkemperCRudolphCPetersAH 2005 Oncogene-induced senescence as an initial barrier in lymphoma development. Nature 436 660 665
44. GotoKKamiyaYImamuraTMiyazonoKMiyazawaK 2007 Selective inhibitory effects of Smad6 on bone morphogenetic protein type I receptors. J Biol Chem 282 20603 20611
45. IshidaWHamamotoTKusanagiKYagiKKawabataM 2000 Smad6 is a Smad1/5-induced smad inhibitor. Characterization of bone morphogenetic protein-responsive element in the mouse Smad6 promoter. J Biol Chem 275 6075 6079
46. WangQWeiXZhuTZhangMShenR 2007 Bone morphogenetic protein 2 activates Smad6 gene transcription through bone-specific transcription factor Runx2. J Biol Chem 282 10742 10748
47. GrashoffCThievessenILorenzKUssarSFasslerR 2004 Integrin-linked kinase: integrin's mysterious partner. Curr Opin Cell Biol 16 565 571
48. WuC 2004 The PINCH-ILK-parvin complexes: assembly, functions and regulation. Biochim Biophys Acta 1692 55 62
49. MongrooPSJohnstoneCNNaruszewiczILeung-HagesteijnCSungRK 2004 Beta-parvin inhibits integrin-linked kinase signaling and is downregulated in breast cancer. Oncogene 23 8959 8970
50. JohnstoneCNMongrooPSRichASSchuppMBowserMJ 2008 Parvin-beta inhibits breast cancer tumorigenicity and promotes CDK9-mediated peroxisome proliferator-activated receptor gamma 1 phosphorylation. Mol Cell Biol 28 687 704
51. HoweJRBairJLSayedMGAndersonMEMitrosFA 2001 Germline mutations of the gene encoding bone morphogenetic protein receptor 1A in juvenile polyposis. Nat Genet 28 184 187
52. HaramisAPBegthelHvan den BornMvan EsJJonkheerS 2004 De novo crypt formation and juvenile polyposis on BMP inhibition in mouse intestine. Science 303 1684 1686
53. HeXCZhangJTongWGTawfikORossJ 2004 BMP signaling inhibits intestinal stem cell self-renewal through suppression of Wnt-beta-catenin signaling. Nat Genet 36 1117 1121
54. HardwickJCVan Den BrinkGRBleumingSABallesterIVan Den BrandeJM 2004 Bone morphogenetic protein 2 is expressed by, and acts upon, mature epithelial cells in the colon. Gastroenterology 126 111 121
55. KodachLLWiercinskaEde MirandaNFBleumingSAMuslerAR 2008 The bone morphogenetic protein pathway is inactivated in the majority of sporadic colorectal cancers. Gastroenterology 134 1332 1341
56. BeppuHMwizerwaONBeppuYDattwylerMPLauwersGY 2008 Stromal inactivation of BMPRII leads to colorectal epithelial overgrowth and polyp formation. Oncogene 27 1063 1070
57. JeonHSDrachevaTYangSHMeerzamanDFukuokaJ 2008 SMAD6 contributes to patient survival in non-small cell lung cancer and its knockdown reestablishes TGF-beta homeostasis in lung cancer cells. Cancer Res 68 9686 9692
58. BurtonDGMatsubaraHIkedaK 2010 Pathophysiology of vascular calcification: Pivotal role of cellular senescence in vascular smooth muscle cells. Exp Gerontol 45 819 824
59. BosJL 1989 ras oncogenes in human cancer: a review. Cancer Res 49 4682 4689
60. KanedaAWangCJCheongRTimpWOnyangoP 2007 Enhanced sensitivity to IGF-II signaling links loss of imprinting of IGF2 to increased cell proliferation and tumor risk. Proc Natl Acad Sci U S A 104 20926 20931
61. WakabayashiKOkamuraMTsutsumiSNishikawaNSTanakaT 2009 The peroxisome proliferator-activated receptor gamma/retinoid X receptor alpha heterodimer targets the histone modification enzyme PR-Set7/Setd8 gene and regulates adipogenesis through a positive feedback loop. Mol Cell Biol 29 3544 3555
62. KaneshiroKTsutsumiSTsujiSShirahigeKAburataniH 2007 An integrated map of p53-binding sites and histone modification in the human ENCODE regions. Genomics 89 178 188
63. DengYBNagaeGMidorikawaYYagiKTsutsumiS 2010 Identification of genes preferentially methylated in hepatitis C virus-related hepatocellular carcinoma. Cancer Sci 101 1501 1510
64. DimriGPLeeXBasileGAcostaMScottG 1995 A biomarker that identifies senescent human cells in culture and in aging skin in vivo. Proc Natl Acad Sci U S A 92 9363 9367
65. KanedaAKaminishiMYanagiharaKSugimuraTUshijimaT 2002 Identification of silencing of nine genes in human gastric cancers. Cancer Res 62 6645 6650
Štítky
Genetika Reprodukční medicínaČlánek vyšel v časopise
PLOS Genetics
2011 Číslo 11
Nejčtenější v tomto čísle
- Evidence-Based Annotation of Gene Function in MR-1 Using Genome-Wide Fitness Profiling across 121 Conditions
- De Novo Origins of Human Genes
- Capture of MicroRNA–Bound mRNAs Identifies the Tumor Suppressor miR-34a as a Regulator of Growth Factor Signaling
- TRY-5 Is a Sperm-Activating Protease in Seminal Fluid