
Identification of Novel Type 2 Diabetes Candidate Genes Involved in the Crosstalk between the Mitochondrial and the Insulin Signaling Systems
Type 2 Diabetes (T2D) is a highly prevalent chronic metabolic disease with strong co-morbidity with obesity and cardiovascular diseases. There is growing evidence supporting the notion that a crosstalk between mitochondria and the insulin signaling cascade could be involved in the etiology of T2D and insulin resistance. In this study we investigated the molecular basis of this crosstalk by using systems biology approaches. We combined, filtered, and interrogated different types of functional interaction data, such as direct protein–protein interactions, co-expression analyses, and metabolic and signaling dependencies. As a result, we constructed the mitochondria-insulin (MITIN) network, which highlights 286 genes as candidate functional linkers between these two systems. The results of internal gene expression analysis of three independent experimental models of mitochondria and insulin signaling perturbations further support the connecting roles of these genes. In addition, we further assessed whether these genes are involved in the etiology of T2D using the genome-wide association study meta-analysis from the DIAGRAM consortium, involving 8,130 T2D cases and 38,987 controls. We found modest enrichment of genes associated with T2D amongst our linker genes (p = 0.0549), including three already validated T2D SNPs and 15 additional SNPs, which, when combined, were collectively associated to increased fasting glucose levels according to MAGIC genome wide meta-analysis (p = 8.12×10⁻⁵). This study highlights the potential of combining systems biology, experimental, and genome-wide association data mining for identifying novel genes and related variants that increase vulnerability to complex diseases.
Published in the journal:
. PLoS Genet 8(12): e32767. doi:10.1371/journal.pgen.1003046
Category:
Research Article
doi:
https://doi.org/10.1371/journal.pgen.1003046
Summary
Type 2 Diabetes (T2D) is a highly prevalent chronic metabolic disease with strong co-morbidity with obesity and cardiovascular diseases. There is growing evidence supporting the notion that a crosstalk between mitochondria and the insulin signaling cascade could be involved in the etiology of T2D and insulin resistance. In this study we investigated the molecular basis of this crosstalk by using systems biology approaches. We combined, filtered, and interrogated different types of functional interaction data, such as direct protein–protein interactions, co-expression analyses, and metabolic and signaling dependencies. As a result, we constructed the mitochondria-insulin (MITIN) network, which highlights 286 genes as candidate functional linkers between these two systems. The results of internal gene expression analysis of three independent experimental models of mitochondria and insulin signaling perturbations further support the connecting roles of these genes. In addition, we further assessed whether these genes are involved in the etiology of T2D using the genome-wide association study meta-analysis from the DIAGRAM consortium, involving 8,130 T2D cases and 38,987 controls. We found modest enrichment of genes associated with T2D amongst our linker genes (p = 0.0549), including three already validated T2D SNPs and 15 additional SNPs, which, when combined, were collectively associated to increased fasting glucose levels according to MAGIC genome wide meta-analysis (p = 8.12×10⁻⁵). This study highlights the potential of combining systems biology, experimental, and genome-wide association data mining for identifying novel genes and related variants that increase vulnerability to complex diseases.
Introduction
Insulin resistance is a common trait present in complex disorders such as type 2 diabetes (T2D), obesity or metabolic syndrome (MetS). Around 340 million people suffer from diabetes worldwide, 90% of whom have T2D (http://www.who.int/diabetes/facts/en). Unlike type 1 diabetes, overt T2D is usually diagnosed several years after its onset due to its milder presenting symptoms, which in part explains why several devastating complications such as cardiovascular related diseases tend to develop soon after or have already arisen at the moment of the initial diagnosis.
There has been growing interest in identifying genes and processes that could trigger insulin resistance beyond defects on the insulin signaling cascade itself. As a result, defective mitochondrial activity has been indirectly related to insulin resistance in insulin-targeted tissues, such as skeletal muscle [1], [2], [3] and liver [4]. In particular, patients with T2D and, more importantly, non-diabetic subjects with type 2 diabetic relatives showed mitochondrial dysfunction and lower expression of PPAR gamma co-activator 1 alpha and 1 beta (PGC-1α and PGC1-1β), which are key regulators of mitochondrial biogenesis and function. In addition, subjects with early-onset type 2 diabetes typically show defective activation of PGC-1alpha in response to physical activity [5], and similarly, morbid obese type 2 diabetic patients show a defective activation of mitochondrial gene expression in response to weight-loss surgery [5]. Whether there is a heritable component involved in the alterations in expression of mitochondrial genes/proteins in these common forms of T2D remains to be determined.
Despite all of these efforts and lines of evidence, the mechanisms and the molecular contributors to the connection between mitochondria and the insulin signaling and resistance are still unknown. The availability of a wide range of functional interaction data, including metabolomics, genomics, transcriptomics and proteomics and the integration of all these data using systems biology approaches make it now possible to investigate in detail the molecular basis of the interaction between the insulin signaling cascade and mitochondrial biology in healthy and pathological scenarios, particularly in the context of T2D.
In addition, and despite substantial progress achieved in the identification of candidate genes involved in specific complex processes or diseases through genome-wide association studies (GWAS), for most diseases, including T2D, less than 10% of the heritability (percentage of variance attributable to genetic variation) can be explained by the identified genetic associations [6]. Some hypotheses suggest that a portion of the missing heritability stays behind multiple small effect size variants that have not yet reached genome-wide significance in GWAS meta-analyses when tested individually, due to insufficient sample sizes. If many of the modest effect variants are assumed to implicate genes that function in a limited number of biological processes, collective analysis of variants based on prior biological knowledge could substantially enhance association detection power. In that sense, the application of systems biology approaches to analyze GWAS data may have the potential to increase the chances of unraveling susceptibility genes or biological processes for complex diseases.
In this study, we applied systems biology approaches to screen and identify novel candidate T2D genes. The search has been guided by the hypothesis that the functional components of the crosstalk between the insulin signaling pathway and the biology of the mitochondria may play a role in the etiology or the evolution of the disease. We have also generated and analyzed gene expression data on insulin resistance and mitochondria perturbed scenarios to support these candidate genes. We finally tested whether particular genetic variants in loci that contain the identified genes could be collectively associated with T2D.
Results
Generation of the MITIN network
In order to identify genes specifically involved in the crosstalk between the insulin signaling pathway and the mitochondria, we looked for all possible direct and indirect functional interactions between mitochondria and insulin signaling genes (Figure 1). We started by building reliable models and parts lists for these two systems. We first explored and manually filtered several public versions of the insulin signaling pathway to end up with a confident collection of 197 proteins/genes (see Methods). At the same time, we extracted data from a database of nuclear and mitochondrial-encoded mitochondrial proteins (MitoP2) to generate the corresponding list of 682 mitochondria genes [7].

Once both parts lists were constructed, we screened several large functional interaction databases to identify direct and indirect connections involving any of the protein/genes of each of the systems. We applied several filters and cutoffs to be able to isolate, from all available interactions, a reliable collection that will be used further in our study. For example, from protein-protein interaction (PPI) data, we only considered those protein pairs whose interactions were reported by two or more independent laboratories (PPIhigh) and whose pair of genes were reported to be expressed both in any of the insulin-sensitive tissues (adipose tissue, muscle, liver and heart, [8]); or any other PPI interaction reported only by a single laboratory, simultaneously expressed in any of the insulin-sensitive tissues and that also showed co-expression (gene-expression correlation) in a dataset of 427 healthy human liver samples [9] (these interactions are here termed PPIcorr). As a third layer of functional interaction, we also linked those proteins observed to belong to the same protein complex as described in the CORUM protein complex database [10]. The fourth source of interaction consisted of pairs of genes coding for enzymes that participate in linked metabolic reactions, i.e. those reactions that are adjacent in a metabolic reaction map according to the Biochemical Genetic and Genomic (BiGG_met) and the Kyoto Encyclopedia of Genes and Genomes database (http://www.genome.jp/kegg/kegg2.html; KEGG_met) [11], [12], [13]. Finally, we also included those interactions between genes coding for complexes or genes linked in a signaling pathway, as defined by KEGG (KEGG_path) [12]. This final functional interactome comprised 57,751 high confidence functional interactions involving 6963 genes, which represent a whole functional network of insulin-targeted tissues or cells.
From the pool of selected high quality interactions (affecting 6963 genes), we finally selected those interactions that, either directly or indirectly, provide a link between the mitochondrial and the insulin signaling cascade genes. We defined indirect interactions as those mediated by genes, termed linker or internode genes, that do not belong to either the insulin or the mitochondria parts list, but that are simultaneously connected to both systems. By applying these filters, we finally generated the mitochondria-insulin (MITIN) network consisting of 886 genes and a total of 1259 interactions, 70 direct (Table S1) and 1194 indirect. The 70 direct interactions involved 44 insulin genes and 37 mitochondria genes, most of them showing only one evidence of interaction. Both the insulin and mitochondria genes that were directly connected were linked to a median of two genes from the other system. Direct connections showed heterogeneous sources of interaction: PPIhigh, PPIcorr, Corum Complexes, BiGG_met, KEGG_met, Kegg_pathway, contributed 41, 9, 13, 2, 3, 12 links, respectively. Indirect interactions involved 286 linker internode genes (Figure S1, Dataset S1, Table S2 and S3). These internodes genes were connected to a mean number of 2.1 Insulin and 1.7 mitochondria genes and showed a mean of 2.6 and 2.0 lines of evidence of interaction with insulin and mitochondria, respectively. Regarding the 1194 indirect connections, PPI, PPIcorr, Corum Complexes, BiGG_met,KEGG_met, Kegg_pathway, contributed 570, 472, 1263, 42, 160, 169 interactions, respectively.
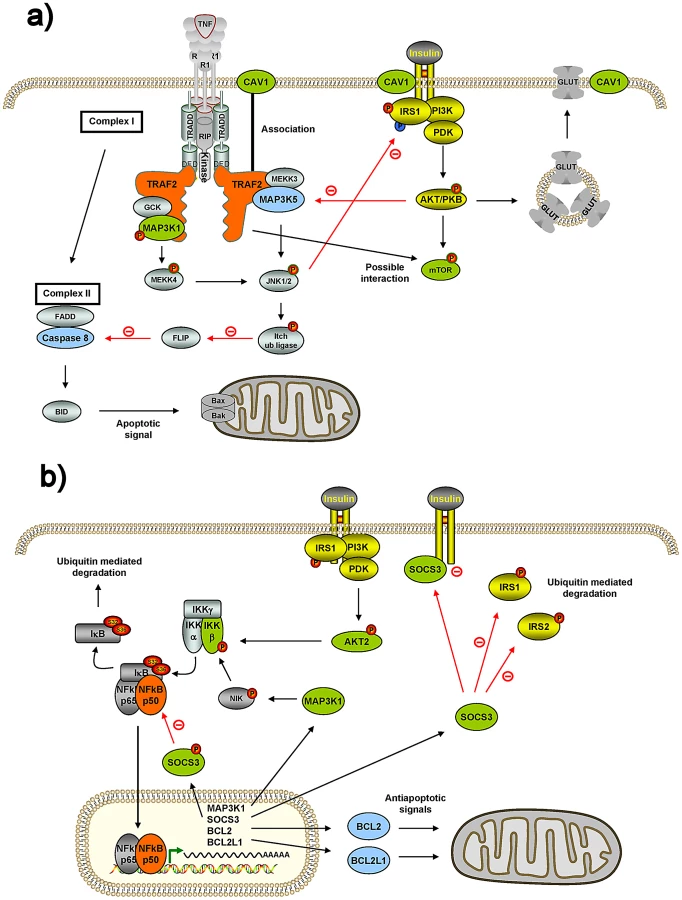
While the majority of the internode genes seem to be novel, as their bridging role connecting both systems has not yet been described, some of them have already been shown to interact with both systems, which constitutes an internal positive control of our underlying search methodology. For example, TRAF2 shows interactions within our MITIN network with four insulin and two mitochondrial genes (Table 1). Interestingly, other independent studies and approaches also identified five of these interactions. In particular with MAP3K1 (MEKK1), CAV1 (caveolin-1) and MTOR (mTOR), from the insulin signaling [14], [15], [16] and MAP3K5 (ASK1) and CASP8 (caspase-8) from the mitochondria [17], [18] (Figure 2). Another example is NFKB1, for which we found interactions with four insulin signaling and three mitochondrial genes. As above, NFKB1 has been also reported to interact with the IKBKB [19], [20], AKT2 [21], MAP3K1 [22] and SOCS3 insulin genes, as well as to BCL2L1 [22] [23] and BCL2 [24] (Figure 2).
The same MITIN network also allowed us to define which mitochondrial genes are more connected to insulin signaling, and vice-versa, either directly or indirectly. The top five insulin signaling genes most connected to mitochondria are NOLC1, RPS6, IKBKB, PKLR, SRC, with a total of 99, 40, 31, 28 and 22 indirect connections with mitochondria, respectively. Similarly, the five most connected mitochondrial genes with the insulin cascade were TUFM, TP53, SLC25A5, POLG, ESR1, with a total of 93, 36, 29, 25, and 19 indirect connections, respectively (Table S4).
We next explored whether our collection of internode genes where enriched in particular functions or processes by querying the Molecular Signatures Database [25]. We found up to 148 functional signatures for which internode genes were significantly enriched (5.7×10−107<p value<4.41×10⁻⁶, 1.94<Odds ratio<20.1; Table S5). Besides several enriched categories related to translation, Reactome Regulation of Expression in Beta Cells (p = 3.5×10−87, Odds Ratio = 15.8), Reactome Insulin Synthesis and Secretion (p = 4.46×10−79, Odds ratio = 14.0), and Reactome Diabetes pathways (p = 1.39×10⁻³⁵, Odds ratio = 5.5) were also highly enriched among our set of internode genes. No significant categories were found after correcting for multiple testing in a set of internode genes identified from a simulated network made of randomly generated interactions.
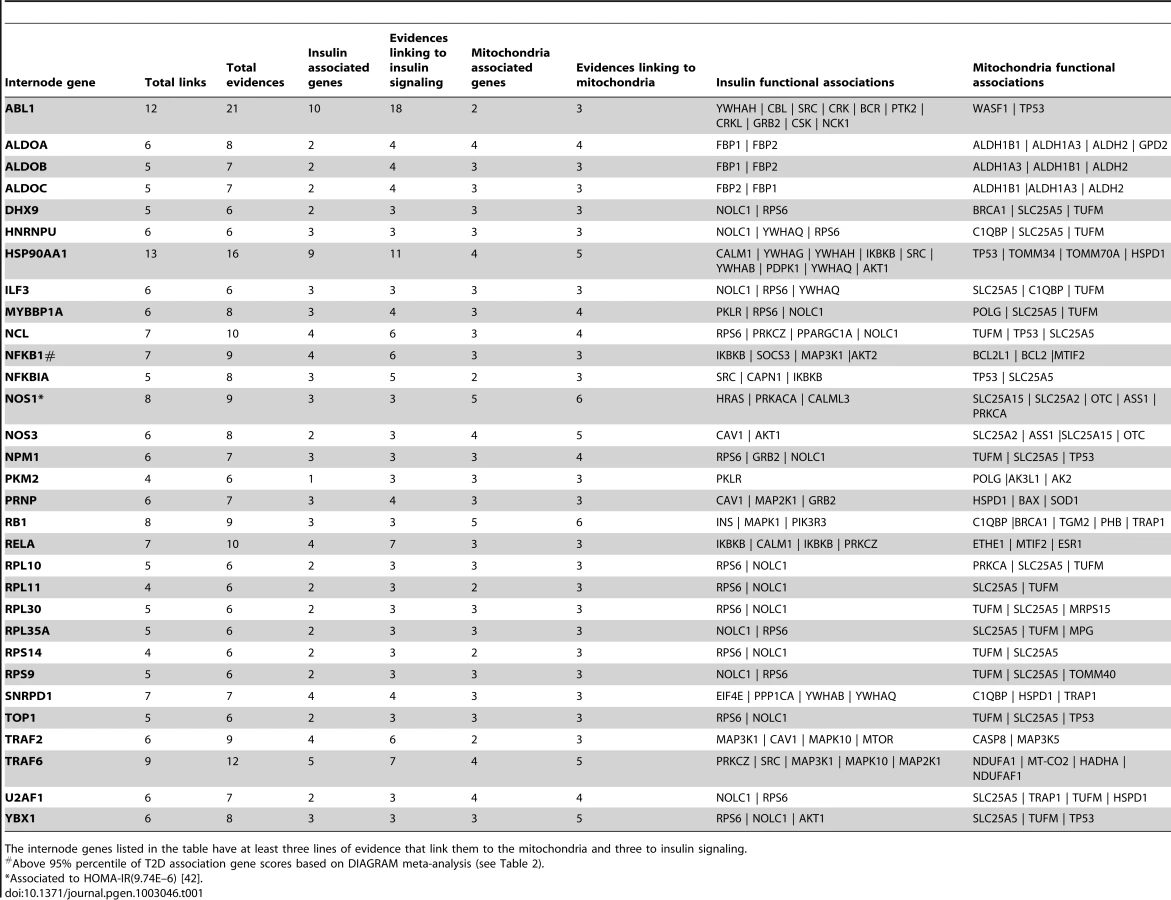
In order to facilitate the selection of any of these genes for further studies, we have ranked them according to their number of connections to each of the systems. Hence, we provide a confident subset of 31 genes with at least three lines of evidence linking insulin signaling and mitochondria genes simultaneously (Table 1).
Internode gene expression is altered in insulin resistance and mitochondrial dysfunction experimental models
As further support of the functional relationship between internode genes and both, the mitochondria and the insulin signaling pathway, we explored whether the expression of these identified internode genes is modified after perturbing each of the mitochondria or insulin signaling systems independently.
To test the effect of the insulin signaling perturbation, we performed gene expression profiling of C2C12 differentiated myotubes that were either left untreated or treated with 100 nM insulin for 2 days in order to induce an insulin resistance state. This treatment resulted in the downregulation of the insulin receptor and subsequently significantly reduced insulin signaling cascades [26]. We used the gene set enrichment analysis method (GSEA, [25]) to look for enrichment of differential expression using our set of internode, mitochondria, and insulin genes as molecular signatures. Using the collection of all 6963 genes with identified interactions as a background, we found significant enrichment of upregulation within the internode genes (Normalized Enrichment Score (NES) = 1.7; False Discovery Rate (FDR) = 0.0013), while observed downregulation enrichment within the insulin signaling genes (NES = −1.4; FDR = 0.028) (Figure 3a). We also explored a second model of insulin signaling cascade perturbation through the analysis of transcriptome data from myotubes treated with RNAi against DOR (also named Tp53inp2). This gene is dysregulated in muscle of Zucker diabetic rats, participates in the myogenic differentiation and mediates a feed-forward loop between ecdysone receptor and the insulin signaling in flies [27], [28]. In this model, we also found that there was an enrichment of upregulated internode genes (NES = 1.4; FDR = 0.004) and enrichment of downregulated insulin (NES = −1.35; FDR = 0.007) and mitochondrial (NES = −1.36; FDR = 0.001) genes (Figure 3c).

In a parallel experiment we tested how perturbations of mitochondria affect the expression of the MITIN network genes. For this, we analyzed gene expression from the heart of Peroxisome-proliferator-activated-receptor γ coactivator 1 beta (PGC-1β) knock-out mice. PGC-1β is a co-activator that regulates mitochondrial biogenesis and function [29], [30], [31], [32]. The analysis of heart gene expression of these mice showed an overrepresentation of upregulated genes within the internodes (NES = 1.3; FDR = 0.02), enrichment of upregulated genes within the insulin genes (NES = 1.6; FDR = 0.0012), and enrichment of downregulated mitochondria genes (NES = −2.63; FDR = <0.0001) (Figure 3b). Again, as a control from our experiment, randomly generated internode genes did not show any enrichment in any of these experiments (Figure 3d).
Clinical implications of the Global MITIN Network
We next investigated whether any of these genes has been associated to phenotypes related to insulin resistance or energy metabolism. For this, we searched through the OMIM database (http://www.ncbi.nlm.nih.gov/omim) those internode genes that are involved in mendelian and complex disorders [33].
We found that, among all 286 internode genes, 191 (66%) were in genomic loci associated to complex diseases or traits (SNPs within 250 kb from internode gene were considered) and 17 (6%) were involved in mendelian diseases. Interestingly 53 of the genes (18%) contained or were near polymorphisms associated to T2D or related traits such as obesity, adiposity, response to glucose challenge, hypertension or coronary artery disease (Table S6). 10,000 random simulations showed that finding 53 genes associated to T2D related traits was modestly more than what expected by chance (p = 0.0535). In contrast, the 10,000 random simulations also showed that we did not find more associations with any complex trait (not restricting to T2D related traits), than would be expected by chance, suggesting that the enrichment for associations of the identified internode genes is specific for T2D and related metabolic traits.
Scanning T2D genome-wide association meta-analyses for variants in the internode genomic regions shows enrichment of T2D associations
In order to further investigate the potential involvement of the internode genes in the etiology of T2D, we screened the DIAGRAM consortium GWAS dataset, which consisted on the largest T2D meta-analysis available at the time of the study (DIAGRAM meta-analysis): 8,130 cases and 38,987 controls [34]. To analyze enrichment of associated genes within the internodes, we used MAGENTA [35], a software specifically designed for large genome-wide association study meta-analyses, where individual genotypes are typically not available. We found that our internode gene list showed nominal enrichment for modest to strongly associated genes within the top 5% of T2D scores, with 18 genes observed, including three already confirmed T2D associated SNPs [34], [36], [37], compared to the 12 expected by chance (p = 0.0549, Table 2). These results were robust to the enrichment cutoff used (p = 0.0368 when testing for enrichment above the 97.5th percentile of all gene scores; 6 genes expected above cutoff, 11 observed). Unlike the collection of internode genes, no significant enrichment for T2D associations was found for gene-sets belonging only to the insulin signaling (p = 0.71) or to the mitochondrial (p = 0.52) systems. The insulin and mitochondria genes directly interacting with each other were also not enriched for T2D associations (p = 0.53).

To further support the involvement of at least some of these 18 internode SNPs in glucose metabolism regulation, we also computed how the best associated SNPs in the 18 regions increased the risk of altered glycemic traits, available from MAGIC consortium datasets [38], [39], [40], [41], [42], using an approximation approach developed by Toby Johnson [43]. Among the seven traits tested, we found a significant association risk score for fasting glucose (p = 8.12×10⁻⁵ including the 18 top ranked SNPs and p = 0.004 including 15 out of the 18 SNPs not previously associated with T2D). In order to evaluate the probability of finding such a highly statistical p-value, when using the top T2D associated genes (and best local SNPs) we ran MAGENTA on 10,000 simulated random gene-sets, and extracted for each simulation the p-values of the most significant SNP per gene for all genes that ranked above the 95th percentile. The empirical p-value was then calculated as the frequency of random gene-sets whose p-values were smaller than the one obtained with the real data and whose effect size was higher than 0. We found that 8.12×10⁻⁵ is significantly lower than what one can expect by chance (p = 0.0144), confirming the association of our set of internode genes, not only with T2D, but also to fasting glucose levels.
Genetic variants in internode genomic regions associated with T2D are also associated with metabolic related quantitative traits
To further explore the involvement of the internode genes associated with T2D (see above) in related metabolic traits we explored several available GWA meta-analyses pertaining to obesity-related traits from the GIANT consortium [44], [45], seven glycemic traits from MAGIC datasets [38], [39], [40], [41], [42], and cardiovascular disease traits from the ICBP consortium [46]. We found that in 10 of the 18 internode genomic loci with modest to strong associations, there was at least one SNP showing association (p<10−5) to one of these metabolic traits. For example, rs6453220, located in the IQGAP2 intron, was associated to circulating glycated hemoglobin (p = 4.19×10⁻⁶) and rs13107325, located upstream of NFKB1, was strongly associated with diastolic blood pressure (p = 7.53×10⁻⁷), body mass index (p = 1.37×10⁻⁷), high density lipoprotein levels (p = 7.2×10⁻¹¹), and systolic blood pressure (p = 2.57×10⁻⁷).
Discussion
Understanding the molecular basis of insulin resistance is essential for the early diagnosis, treatment and prevention of T2D and related co-morbidities, such as hyperlipidemia or cardiovascular disease. In this study we explored the molecular basis of insulin resistance beyond the known role of insulin signaling genes, and, implicitly screened for novel candidate T2D genes. Based on published evidence that connects the function of the mitochondria with insulin resistance and T2D [5], [47], [48], [49], we hypothesized that there are genes responsible for the crosstalk between the mitochondria and the insulin signaling system, which makes them good candidates for T2D. By screening and filtering a variety of available functional interaction data, we have first generated a conservative network (MITIN) containing all genes involved in or connected to the insulin signaling or mitochondrial systems, not only through PPI but also based on interactions of other nature, including co-expression, protein complexes, and signaling and metabolic interactions. From there, we then selected a fraction of 286 internode genes that show connections to genes of both systems and are, therefore, likely to be involved in the functional crosstalk between the insulin signaling cascade and the mitochondria.
We have examined these genes at different levels to validate their bridging role and their potential implication in T2D or co-morbidities. In order to provide a more stringent list amenable to low throughput molecular biology experiments in future studies on insulin resistance and diabetes, we ranked these genes on the basis of their level of connectivity to insulin and mitochondrial genes and generated a high confidence subset of 31 genes showing three or more functional connections to each of the systems.
While there are no reported confirmatory data for the majority of the 286 internode genes, some have been already found to be linked to both systems, and even to T2D and related metabolic processes. For example TRAF2 [14], [15], [17], [18], NFKB1 [19], [20], [21], [22], [23], [24] (Figure 2) and SMAD3 [50], which show multiple connections to insulin signaling and to mitochondrial genes in our MITIN network, have also been described elsewhere to interact with genes of both systems. In addition, variants near the NFKB1 gene have been associated to T2D based on the DIAGRAM dataset (best nearby SNP p-value = 1.6×10⁻⁵), while SMAD3 has been recently found to protect against diet-induced obesity as well as coronary artery disease [50], [51]. Other genes that also emerge as connecting internode genes in our MITIN network, such as the chaperone HPSP90AA gene, have not been previously described as linked to the insulin or the mitochondrial systems, but have been linked to insulin resistance conditions and hence to T2D [52], [53].
On top of the previous knowledge on some of the internode genes, we provide here further evidence that supports the robustness of our search strategy and of this collection of genes as potential molecular connectors of these systems, as well as insulin resistance or T2D candidate genes. First, the 286 internode genes showed significant enrichment of functional categories, like “regulation of beta cell development” (p = 2.1×10−79), “insulin synthesis and secretion” (p = 3.4×10−79) and “diabetes pathways” (p = 1.9×10⁻³⁵). Second, experimental models of mitochondria and insulin signaling perturbation caused a significant upregulation of the internode genes. This could be the result of direct regulation or a mechanism that compensates these perturbed metabolic scenarios. In all cases, the expression analyses helped us to confirm that these genes are indeed functionally connected to both systems. Furthermore, the deregulation of these internode genes under experimental conditions of insulin resistance suggests their involvement in T2D.
Encouraged by our positive functional and expression results supporting the connecting role of the internode genes and their impact on T2D, we went one step further and used the MITIN network as a basis for the identification of genetic signatures associated with T2D, contributing to unraveling its missing heritability. We tested for enrichment of T2D associations within the newly identified internode genes, by analyzing the results from the DIAGRAM GWA meta-analyses [34] using MAGENTA to define gene association scores and enrichment of gene associations [35]. We found enrichment of T2D variants within this group of genes, involving 18 associated genes compared to the 12 that were expected by chance (p = 0.0549). Our study also confirms the absence of significant signal when we tested insulin signaling and mitochondria gene-sets for enrichment of T2D associations. This is in agreement with previous studies, where no enrichment was found for mitochondrial or insulin signaling genes [34], [35], and suggests that the genes involved on the crosstalk between the insulin and mitochondria networks are more susceptible to harbor T2D risk variants than those that belong to either the insulin cascade or the mitochondria alone. The best local SNP in each of the 18 top ranked regions showed a combined risk score of increased fasting glucose levels according to MAGIC consortium data-sets (p = 8.12×10⁻⁵). Also supporting these results, several variants in the internode genomic regions identified by MAGENTA were also associated with many metabolic related quantitative traits, as reported by the MAGIC [38], [39], [40], [41], [42], GIANT [44], [45] and ICBP [46] consortia (Table 2).
Interestingly, the best-associated SNP in four of the 18 genes were among the 43 already validated loci of susceptibility for T2D, which in the former reports were assigned to ZBED3, BCL11A, PRC1, and KCNJ11 genes, based only in proximity [34], [36], [37]. Taking into account the intrinsic challenge in linking an associated variant to its causal gene, we cannot exclude that these SNPs may be proxies for causal variants affecting our group of identified internode genes. Accordingly, recent findings suggest that a fraction of regulatory variants can be more than 500 Kb away from their regulated gene and that a single locus can expand more than 1 Mb, and even contain more than one independent causal variant [54], [55], [56]. Among the top 18 top ranked internode genes identified by MAGENTA analyses of T2D GWAS meta-analysis, there are independent lines of evidence suggesting the involvement on the development of T2D or insulin resistance. For example, two members of the IQ-motif-containing GTPase-activating protein (IQGAP) family, scaffold proteins involved in a wide range of cellular and signaling processes, including cytoskeletal organization, cell adhesion, and tumorigenic processes [57], [58], appear in the top 95th percentile for association with T2D according to MAGENTA analysis. IQ motif containing GTPase activating protein 2 (IQGAP2), the second ranked gene according to MAGENTA analysis, contained an intronic low frequency SNP (rs6453220; MAF = 0.05), which was strongly associated with glycated haemoglobin according to MAGIC WGA-meta-analyses (Hb1Ac; p = 4.19×10⁻⁶), providing more evidence that variants in IQGAP2 may contribute to insulin resistance. In addition, another gene of the same family, IQGAP1 (top four according to MAGENTA), was recently reported to bind the target of rapamycin complex 1 (mTORC1) having a potential negative feedback loop role upstream mTORC1/S6K1 AKT1 activation [59]. Furthermore, IQGAP1 associates with PKA and AKAP79 in pancreatic Beta cells, suggesting a role in the Beta-cell development and physiology [60]. It is also worth mentioning that IQGAP1 was also found upregulated in our chronic insulin treatment experiment (fold change 1.4; FDR<0.01) and the Tp53inp2 RNAi treatment in myotubes experiment (fold change = 1.33; FDR = 0.1). These results, together with the general role of scaffolding proteins as hubs of signaling pathways further supports the implication of the IQGAP protein family in the insulin signaling and the mitochondrial systems crosstalk and its association to T2D. RAB4A (Best SNP p value = 3.5×10⁻⁵) is a GTPase that regulates glucose transporter GLUT4 [61], and is suggested to participate in metabolic remodeling in the diabetic heart [62]. Finally, breast cancer anti-estrogen resistance 1 (BCAR1), (Best SNP p value = 6.61×10⁻⁵, distance from gene = 16.5 Kb) is another gene that deserves attention, as is connected to 10 insulin genes, according to our network: CRK, SRC, PTPN1, PTK2, CRKL, PIK3R1, GRB2, PTPRF, RHOA and PTPRA. Interestingly, a SNP in an intronic region 16 Kb upstream this gene was reported to be strongly associated with type 1 diabetes [63].
In summary, this study contributes to untangling the molecular basis linking the mitochondria and the insulin signaling systems and provides a subset of novel T2D candidate genes for further genetic, molecular and clinical studies. This study also constitutes a proof of concept of the utility of combining several integrative systems biology approaches with the analysis of gene expression and large GWA meta-analyses to uncover novel associations with complex diseases of otherwise hidden candidate genes.
Materials and Methods
Mitochondria and insulin parts lists
We constructed a consensus insulin pathway from several public resources, including (Biocarta; www.biocarta.com, Kegg [12]; www.genome.jp/kegg/, and PID; [64]; http://pid.nci.nih.gov/) and a commercial resource (Biobase; www.biobase.de). This pathway was manually curated and refined by the participation of molecular biologists in the field.
In order to select the parts lists that compose mitochondrial proteins or genes, we have selected a total set of 900 proteins from the mitoP2 database (www.mitop2.de/; [7]). As it was done for the insulin pathway, the set has been manually curated by the participation of the expert groups in the consortium.
To allow for transferability of the results to other species, we have identified each mouse orthologous gene/protein for all involved proteins.
Generation of the MITIN network
To identify protein-protein interactions we used a non-redundant set of 23 protein interaction datasets and only included those interactions reported independently by two different laboratories (PPIhigh) [8].
For the gene co-expression analysis, we used the dataset of Schadt et al. [9], which consists of expression data of 427 healthy human liver samples and constituted the largest insulin-sensitive human transcriptome dataset. We evaluated the overlap between gene co-expression in liver and low confident PPIs (those reported only by a single lab) to provide a new source of high confident interactions.
Third, we added those interactions that pertained to the CORUM complex database [10], considering that two genes are functionally linked if they both pertain to a common complex.
The fourth source of interaction consisted of pairs of genes coding for those enzymes that participate in linked (or consecutive) metabolic reactions as described in KEGG or BiGG databases [11], [12], [13].
Finally, we also considered those interactions between genes coding for complexes or genes linked any signaling pathway, as defined by KEGG [12].
Identification of enriched signatures
We used the Molecular Signatures Database from the Broad Institute ([25]; http://www.broadinstitute.org/gsea/msigdb) and for a total of 6770 gene sets, we computed an enrichment score based on a Chi-Square test. The corrected significant p-value after applying Bonferroni's correction for all the tests was 4.41×10⁻⁶. We only considered gene sets that had at least 10 genes within the group of internode genes.
Microarray data analysis and GSEA
All statistical analyses were performed using Bioconductor (Gentleman et al., 2004). Microarray data was normalized via quantile normalization and summarized to probeset expression estimates via robust multi-array average (RMA) (Irizarry et al., 2003) using the function rma from the oligo package. All the newly generated data was deposited in the Gene Expression Omnibus (GEO) (http://www.ncbi.nlm.nih.gov/geo) database (GSE3932).
We used gene set enrichment analysis (GSEA) (Subramanian et al., 2005) as implemented in the Bioconductor library phenoTest [65] to assess the degree of association between gene expression and the following signatures: insulin, mitochondria and internodes. As indicated in Subramanian et al. [25], P-values were computed restricting attention to simulated ES with the same sign as ESobs.
Chronic insulin treatment
All chemicals and reagents were purchased from Sigma-Aldrich, (Poole, UK). Briefly, C2C12 cells were cultured in Dulbecco's modified Eagle media (DMEM) supplemented with 10% Fetal bovine serum, and penicillin/streptomycin. To induce differentiation media was replenished by DMEM containing 2% (v/v) of horse serum with penicillin/streptomycin. Myotubes between days 4 and 7 following the induction of differentiation were used for experiments. For chronic insulin treatment cells were either left untreated or incubated with 100 nMinsulin in DMEM for 48 h in fusion medium to induce an insulin resistance state. Medium was changed every 24 h.
Pgc1b knock-out model
Hearts were quickly collected and snap frozen in liquid nitrogen from wild-type and PGC-1β KO on a mix background (sv129 and C57BL/6) generated as previously reported [31]. Animal procedures were performed in accordance with the UK Home Office regulations and the UK Animal Scientific Procedures Act [A(sp)A 1986]. Animals were housed in a temperature-controlled room with a 12-h light/dark cycle. Food and water were available ad libitum.
Dor silencing
Lentiviruses encoding scrambled or DOR siRNA were used as reported [27]. Fifteen million C2C12 myoblasts grown on 12-well plates were transduced at moi 100 and cells were amplified during 5–7 days. Transduced cells (GFP-positive) were then sorted with a MoFlo flow cytometer (DakoCytomation, Summit v 3.1 software), obtaining between 93%–99% GFP-positive cells. Confluent C2C12 myoblasts previously infected with lentiviruses encoding scrambled RNA or DOR siRNA were allowed to differentiate in 5% horse serum-containing medium for 4 days. Total RNA was purified and microarrays were performed by using an Affimetrix platform.
Enrichment of T2D associations in internode genes
We used the latest DIAGRAM T2D GWA meta-analysis comprising 8,130 cases and 38,987 controls [34] and the MAGENTA software was used to test for enrichment of associations in the 286 internode genes [35]. Briefly, we assigned to each gene a set of SNPs that lie within 500 Kb upstream and downstream of the gene's most extreme transcript boundaries. This boundaries were based on the fact that a fraction of regulatory variants can be up to 500 Kb distal to their regulated gene and that a single locus may harbor more than one causal variants, and extend to more than 1 Mb from the locus top hit [54], [55], [56]. For each gene, a score was assigned based on the most significant SNP, followed by correction for confounders, including gene size, number of independent SNPs, and linkage disequilibrium-based properties. Once all the association scores were computed, MAGENTA tested for over-representation of genes in a given gene set above a predetermined gene score rank cutoff, which in this case was the 95th percentile of all gene scores. The enrichment is evaluated against a null distribution of gene sets of identical set size that were randomly sampled from the 6963 genes that constitute our complete interactome based on all identified functional interactions.
Risk score analyses using multi–SNP predictors in glycemic traits from MAGIC consortium dataset
We computed how the best associated SNPs in the 18 regions could collectively increase the risk of altered glycemic traits available from MAGIC consortium datasets [38], [39], [40], [41], [42]. We used the method described in [43]. An unweighted genetic risk score was defined for each individual as the sum of the number of risk increasing alleles at each of the 18 SNPs of interest. If one had access to individual-level data, association between SNP score and glycemic traits could be tested using the usual approach. However, when the risk score involves SNPs in linkage equilibrium, it was shown [43] that association between risk score and trait can be assessed using meta-analysis results only, without going back to individual-level data. The effect of the risk score on the phenotype is estimated by

The assumption of no Linkage Disequilibrium (LD) is required for the contribution of each SNP to be independent and for the standard error estimate to be valid. P-value for the risk score association can be assessed using the ratio of the SNP score effect estimate divided by its standard error, and assessing the significance of the ratio by comparing it to the standard normal distribution.
This large sample procedure will result in valid p-values under the null hypothesis of no relationship between the trait and variants included in the risk score.
Supporting Information
Zdroje
1. PetersenKF, DufourS, BefroyD, GarciaR, ShulmanGI (2004) Impaired mitochondrial activity in the insulin-resistant offspring of patients with type 2 diabetes. N Engl J Med 350 : 664–671.
2. PetersenKF, BefroyD, DufourS, DziuraJ, AriyanC, et al. (2003) Mitochondrial dysfunction in the elderly: possible role in insulin resistance. Science 300 : 1140–1142.
3. KelleyDE, HeJ, MenshikovaEV, RitovVB (2002) Dysfunction of mitochondria in human skeletal muscle in type 2 diabetes. Diabetes 51 : 2944–2950.
4. LeeHJ, ChungK, LeeH, LeeK, LimJH, et al. (2011) Downregulation of mitochondrial lon protease impairs mitochondrial function and causes hepatic insulin resistance in human liver SK-HEP-1 cells. Diabetologia 54 : 1437–1446.
5. Hernandez-AlvarezMI, ChielliniC, MancoM, NaonD, LiesaM, et al. (2009) Genes involved in mitochondrial biogenesis/function are induced in response to bilio-pancreatic diversion in morbidly obese individuals with normal glucose tolerance but not in type 2 diabetic patients. Diabetologia 52 : 1618–1627.
6. BillingsLK, FlorezJC The genetics of type 2 diabetes: what have we learned from GWAS? Ann N Y Acad Sci 1212 : 59–77.
7. ElstnerM, AndreoliC, KlopstockT, MeitingerT, ProkischH (2009) The mitochondrial proteome database: MitoP2. Methods Enzymol 457 : 3–20.
8. BossiA, LehnerB (2009) Tissue specificity and the human protein interaction network. Mol Syst Biol 5 : 260.
9. SchadtEE, MolonyC, ChudinE, HaoK, YangX, et al. (2008) Mapping the genetic architecture of gene expression in human liver. PLoS Biol 6: e107 doi:10.1371/journal.pbio.0060107.
10. RueppA, WaegeleB, LechnerM, BraunerB, Dunger-KaltenbachI, et al. (2009) CORUM: the comprehensive resource of mammalian protein complexes–2009. Nucleic Acids Res 38: D497–501.
11. SchellenbergerJ, ParkJO, ConradTM, PalssonBO BiGG: a Biochemical Genetic and Genomic knowledgebase of large scale metabolic reconstructions. BMC Bioinformatics 11 : 213.
12. KanehisaM, ArakiM, GotoS, HattoriM, HirakawaM, et al. (2008) KEGG for linking genomes to life and the environment. Nucleic Acids Res 36: D480–484.
13. LeeDS, ParkJ, KayKA, ChristakisNA, OltvaiZN, et al. (2008) The implications of human metabolic network topology for disease comorbidity. Proc Natl Acad Sci U S A 105 : 9880–9885.
14. FengX, GaetaML, MadgeLA, YangJH, BradleyJR, et al. (2001) Caveolin-1 associates with TRAF2 to form a complex that is recruited to tumor necrosis factor receptors. J Biol Chem 276 : 8341–8349.
15. ChadeeDN, YuasaT, KyriakisJM (2002) Direct activation of mitogen-activated protein kinase kinase kinase MEKK1 by the Ste20p homologue GCK and the adapter protein TRAF2. Mol Cell Biol 22 : 737–749.
16. TsouHK, SuCM, ChenHT, HsiehMH, LinCJ, et al. (2010) Integrin-linked kinase is involved in TNF-alpha-induced inducible nitric-oxide synthase expression in myoblasts. J Cell Biochem 109 : 1244–1253.
17. ShinodaS, SkradskiSL, ArakiT, SchindlerCK, MellerR, et al. (2003) Formation of a tumour necrosis factor receptor 1 molecular scaffolding complex and activation of apoptosis signal-regulating kinase 1 during seizure-induced neuronal death. Eur J Neurosci 17 : 2065–2076.
18. ChangL, KamataH, SolinasG, LuoJL, MaedaS, et al. (2006) The E3 ubiquitin ligase itch couples JNK activation to TNFalpha-induced cell death by inducing c-FLIP(L) turnover. Cell 124 : 601–613.
19. KarinM, Ben-NeriahY (2000) Phosphorylation meets ubiquitination: the control of NF-[kappa]B activity. Annu Rev Immunol 18 : 621–663.
20. ReuterS, CharletJ, JunckerT, TeitenMH, DicatoM, et al. (2009) Effect of curcumin on nuclear factor kappaB signaling pathways in human chronic myelogenous K562 leukemia cells. Ann N Y Acad Sci 1171 : 436–447.
21. SugataniT, HruskaKA (2005) Akt1/Akt2 and mammalian target of rapamycin/Bim play critical roles in osteoclast differentiation and survival, respectively, whereas Akt is dispensable for cell survival in isolated osteoclast precursors. J Biol Chem 280 : 3583–3589.
22. YinMJ, ChristersonLB, YamamotoY, KwakYT, XuS, et al. (1998) HTLV-I Tax protein binds to MEKK1 to stimulate IkappaB kinase activity and NF-kappaB activation. Cell 93 : 875–884.
23. PahlHL (1999) Activators and target genes of Rel/NF-kappaB transcription factors. Oncogene 18 : 6853–6866.
24. Paz-PrielI, HoungS, DooherJ, FriedmanAD C/EBPalpha and C/EBPalpha oncoproteins regulate nfkb1 and displace histone deacetylases from NF-kappaB p50 homodimers to induce NF-kappaB target genes. Blood 117 : 4085–4094.
25. SubramanianA, TamayoP, MoothaVK, MukherjeeS, EbertBL, et al. (2005) Gene set enrichment analysis: a knowledge-based approach for interpreting genome-wide expression profiles. Proc Natl Acad Sci U S A 102 : 15545–15550.
26. YangC, AyeCC, LiX, Diaz RamosA, ZorzanoA, et al. (2012) Mitochondrial dysfunction in insulin resistance: differential contributions of chronic insulin and saturated fatty acid exposure in muscle cells. Biosci Rep
27. BaumgartnerBG, OrpinellM, DuranJ, RibasV, BurghardtHE, et al. (2007) Identification of a novel modulator of thyroid hormone receptor-mediated action. PLoS ONE 2: e1183 doi:10.1371/journal.pone.0001183.
28. FrancisVA, ZorzanoA, TelemanAA (2010) dDOR is an EcR coactivator that forms a feed-forward loop connecting insulin and ecdysone signaling. Curr Biol 20 : 1799–1808.
29. LinJ, PuigserverP, DonovanJ, TarrP, SpiegelmanBM (2002) Peroxisome proliferator-activated receptor gamma coactivator 1beta (PGC-1beta), a novel PGC-1-related transcription coactivator associated with host cell factor. J Biol Chem 277 : 1645–1648.
30. MeirhaegheA, CrowleyV, LenaghanC, LelliottC, GreenK, et al. (2003) Characterization of the human, mouse and rat PGC1 beta (peroxisome-proliferator-activated receptor-gamma co-activator 1 beta) gene in vitro and in vivo. Biochem J 373 : 155–165.
31. LelliottCJ, Medina-GomezG, PetrovicN, KisA, FeldmannHM, et al. (2006) Ablation of PGC-1beta results in defective mitochondrial activity, thermogenesis, hepatic function, and cardiac performance. PLoS Biol 4: e369 doi:10.1371/journal.pbio.0040369.
32. SonodaJ, MehlIR, ChongLW, NofsingerRR, EvansRM (2007) PGC-1beta controls mitochondrial metabolism to modulate circadian activity, adaptive thermogenesis, and hepatic steatosis. Proc Natl Acad Sci U S A 104 : 5223–5228.
33. HindorffLA, SethupathyP, JunkinsHA, RamosEM, MehtaJP, et al. (2009) Potential etiologic and functional implications of genome-wide association loci for human diseases and traits. Proc Natl Acad Sci U S A 106 : 9362–9367.
34. VoightBF, ScottLJ, SteinthorsdottirV, MorrisAP, DinaC, et al. (2010) Twelve type 2 diabetes susceptibility loci identified through large-scale association analysis. Nat Genet 42 : 579–589.
35. SegreAV, GroopL, MoothaVK, DalyMJ, AltshulerD (2010) Common inherited variation in mitochondrial genes is not enriched for associations with type 2 diabetes or related glycemic traits. PLoS Genet 6 doi:10.1371/journal.pgen.1001058.
36. ZegginiE, WeedonMN, LindgrenCM, FraylingTM, ElliottKS, et al. (2007) Replication of genome-wide association signals in UK samples reveals risk loci for type 2 diabetes. Science 316 : 1336–1341.
37. ZegginiE, ScottLJ, SaxenaR, VoightBF, MarchiniJL, et al. (2008) Meta-analysis of genome-wide association data and large-scale replication identifies additional susceptibility loci for type 2 diabetes. Nat Genet 40 : 638–645.
38. StrawbridgeRJ, DupuisJ, ProkopenkoI, BarkerA, AhlqvistE, et al. (2011) Genome-wide association identifies nine common variants associated with fasting proinsulin levels and provides new insights into the pathophysiology of type 2 diabetes. Diabetes 60 : 2624–2634.
39. SoranzoN, SannaS, WheelerE, GiegerC, RadkeD, et al. (2010) Common variants at 10 genomic loci influence hemoglobin A(C) levels via glycemic and nonglycemic pathways. Diabetes 59 : 3229–3239.
40. SaxenaR, HivertMF, LangenbergC, TanakaT, PankowJS, et al. (2010) Genetic variation in GIPR influences the glucose and insulin responses to an oral glucose challenge. Nat Genet 42 : 142–148.
41. ProkopenkoI, LangenbergC, FlorezJC, SaxenaR, SoranzoN, et al. (2009) Variants in MTNR1B influence fasting glucose levels. Nat Genet 41 : 77–81.
42. DupuisJ, LangenbergC, ProkopenkoI, SaxenaR, SoranzoN, et al. (2010) New genetic loci implicated in fasting glucose homeostasis and their impact on type 2 diabetes risk. Nat Genet 42 : 105–116.
43. International Consortium for Blood Pressure Genome-Wide (2011) AssociationS, EhretGB, MunroePB, RiceKM, BochudM, et al. (2011) Genetic variants in novel pathways influence blood pressure and cardiovascular disease risk. Nature 478 : 103–109.
44. SpeliotesEK, WillerCJ, BerndtSI, MondaKL, ThorleifssonG, et al. (2010) Association analyses of 249,796 individuals reveal 18 new loci associated with body mass index. Nat Genet 42 : 937–948.
45. HeidIM, JacksonAU, RandallJC, WinklerTW, QiL, et al. (2010) Meta-analysis identifies 13 new loci associated with waist-hip ratio and reveals sexual dimorphism in the genetic basis of fat distribution. Nat Genet 42 : 949–960.
46. ChambersJC, ZhangW, SehmiJ, LiX, WassMN, et al. (2011) Genome-wide association study identifies loci influencing concentrations of liver enzymes in plasma. Nat Genet 43 : 1131–1138.
47. PattiME, ButteAJ, CrunkhornS, CusiK, BerriaR, et al. (2003) Coordinated reduction of genes of oxidative metabolism in humans with insulin resistance and diabetes: Potential role of PGC1 and NRF1. Proc Natl Acad Sci U S A 100 : 8466–8471.
48. MoothaVK, LindgrenCM, ErikssonKF, SubramanianA, SihagS, et al. (2003) PGC-1alpha-responsive genes involved in oxidative phosphorylation are coordinately downregulated in human diabetes. Nat Genet 34 : 267–273.
49. MoothaVK, HandschinC, ArlowD, XieX, St PierreJ, et al. (2004) Erralpha and Gabpa/b specify PGC-1alpha-dependent oxidative phosphorylation gene expression that is altered in diabetic muscle. Proc Natl Acad Sci U S A 101 : 6570–6575.
50. YadavH, QuijanoC, KamarajuAK, GavrilovaO, MalekR, et al. (2011) Protection from obesity and diabetes by blockade of TGF-beta/Smad3 signaling. Cell Metab 14 : 67–79.
51. SamaniNJ, ErdmannJ, HallAS, HengstenbergC, ManginoM, et al. (2007) Genomewide association analysis of coronary artery disease. N Engl J Med 357 : 443–453.
52. RamosRR, SwansonAJ, BassJ (2007) Calreticulin and Hsp90 stabilize the human insulin receptor and promote its mobility in the endoplasmic reticulum. Proc Natl Acad Sci U S A 104 : 10470–10475.
53. SawaT, ImamuraT, HarutaT, SasaokaT, IshikiM, et al. (1996) Hsp70 family molecular chaperones and mutant insulin receptor: differential binding specificities of BiP and Hsp70/Hsc70 determines accumulation or degradation of insulin receptor. Biochem Biophys Res Commun 218 : 449–453.
54. StrangerBE, NicaAC, ForrestMS, DimasA, BirdCP, et al. (2007) Population genomics of human gene expression. Nat Genet 39 : 1217–1224.
55. NicaAC, PartsL, GlassD, NisbetJ, BarrettA, et al. (2011) The architecture of gene regulatory variation across multiple human tissues: the MuTHER study. PLoS Genet 7: e1002003 doi:10.1371/journal.pgen.1002003.
56. YangJ, FerreiraT, MorrisAP, MedlandSE (2012) Genetic Investigation of ATC, (2012) et al. Conditional and joint multiple-SNP analysis of GWAS summary statistics identifies additional variants influencing complex traits. Nat Genet 44 : 369–375.
57. PathmanathanS, HamiltonE, AtchesonE, TimsonDJ (2011) The interaction of IQGAPs with calmodulin-like proteins. Biochem Soc Trans 39 : 694–699.
58. WhiteCD, BrownMD, SacksDB (2009) IQGAPs in cancer: a family of scaffold proteins underlying tumorigenesis. FEBS Lett 583 : 1817–1824.
59. TekletsadikYK, SonnR, OsmanMA (2012) A conserved role of IQGAP1 in regulating TOR complex 1. J Cell Sci 125 : 2041–2052.
60. NauertJB, RigasJD, LesterLB (2003) Identification of an IQGAP1/AKAP79 complex in beta-cells. J Cell Biochem 90 : 97–108.
61. KaddaiV, GonzalezT, KeslairF, GremeauxT, BonnafousS, et al. (2009) Rab4b is a small GTPase involved in the control of the glucose transporter GLUT4 localization in adipocyte. PLoS ONE 4: e5257 doi:10.1371/journal.pone.0005257.
62. SackMN (2010) Rab4a signaling unmasks a pivotal link between myocardial homeostasis and metabolic remodeling in the diabetic heart. J Mol Cell Cardiol 49 : 908–910.
63. BarrettJC, ClaytonDG, ConcannonP, AkolkarB, CooperJD, et al. (2009) Genome-wide association study and meta-analysis find that over 40 loci affect risk of type 1 diabetes. Nat Genet 41 : 703–707.
64. SchaeferCF, AnthonyK, KrupaS, BuchoffJ, DayM, et al. (2009) PID: the Pathway Interaction Database. Nucleic Acids Res 37: D674–679.
65. PlanetE (2010) phenoTest: Tools to test correlation between gene expression and phenotype. Bioconductor R package version 1.0.0.
Štítky
Genetika Reprodukční medicínaČlánek vyšel v časopise
PLOS Genetics
2012 Číslo 12
Nejčtenější v tomto čísle
- Population Genomics of Sub-Saharan : African Diversity and Non-African Admixture
- Dnmt3a Protects Active Chromosome Domains against Cancer-Associated Hypomethylation
- Excessive Astrocyte-Derived Neurotrophin-3 Contributes to the Abnormal Neuronal Dendritic Development in a Mouse Model of Fragile X Syndrome
- Pre-Disposition and Epigenetics Govern Variation in Bacterial Survival upon Stress