
Pre-Disposition and Epigenetics Govern Variation in Bacterial Survival upon Stress
Bacteria suffer various stresses in their unpredictable environment. In response, clonal populations may exhibit cell-to-cell variation, hypothetically to maximize their survival. The origins, propagation, and consequences of this variability remain poorly understood. Variability persists through cell division events, yet detailed lineage information for individual stress-response phenotypes is scarce. This work combines time-lapse microscopy and microfluidics to uniformly manipulate the environmental changes experienced by clonal bacteria. We quantify the growth rates and RpoH-driven heat-shock responses of individual Escherichia coli within their lineage context, stressed by low streptomycin concentrations. We observe an increased variation in phenotypes, as different as survival from death, that can be traced to asymmetric division events occurring prior to stress induction. Epigenetic inheritance contributes to the propagation of the observed phenotypic variation, resulting in three-fold increase of the RpoH-driven expression autocorrelation time following stress induction. We propose that the increased permeability of streptomycin-stressed cells serves as a positive feedback loop underlying this epigenetic effect. Our results suggest that stochasticity, pre-disposition, and epigenetic effects are at the source of stress-induced variability. Unlike in a bet-hedging strategy, we observe that cells with a higher investment in maintenance, measured as the basal RpoH transcriptional activity prior to antibiotic treatment, are more likely to give rise to stressed, frail progeny.
Published in the journal:
. PLoS Genet 8(12): e32767. doi:10.1371/journal.pgen.1003148
Category:
Research Article
doi:
https://doi.org/10.1371/journal.pgen.1003148
Summary
Bacteria suffer various stresses in their unpredictable environment. In response, clonal populations may exhibit cell-to-cell variation, hypothetically to maximize their survival. The origins, propagation, and consequences of this variability remain poorly understood. Variability persists through cell division events, yet detailed lineage information for individual stress-response phenotypes is scarce. This work combines time-lapse microscopy and microfluidics to uniformly manipulate the environmental changes experienced by clonal bacteria. We quantify the growth rates and RpoH-driven heat-shock responses of individual Escherichia coli within their lineage context, stressed by low streptomycin concentrations. We observe an increased variation in phenotypes, as different as survival from death, that can be traced to asymmetric division events occurring prior to stress induction. Epigenetic inheritance contributes to the propagation of the observed phenotypic variation, resulting in three-fold increase of the RpoH-driven expression autocorrelation time following stress induction. We propose that the increased permeability of streptomycin-stressed cells serves as a positive feedback loop underlying this epigenetic effect. Our results suggest that stochasticity, pre-disposition, and epigenetic effects are at the source of stress-induced variability. Unlike in a bet-hedging strategy, we observe that cells with a higher investment in maintenance, measured as the basal RpoH transcriptional activity prior to antibiotic treatment, are more likely to give rise to stressed, frail progeny.
Introduction
Microbial phenotypic heterogeneity, defined as variability of a given trait in a genetically identical population in a homogeneous environment, has been repeatedly observed [1], [2]. It is manifest, for example, in the broad distributions of individual gene expression levels recorded in studies of both prokaryotic and eukaryotic cells [3], [4]. Stress conditions may induce further differentiation of clonal cells, in agreement with the observed higher variability of stress response genes' expression in comparison with other gene families [5]. At the extreme, initial stochastic variability is funneled into bistable states via positive feedback mechanisms that persist through generations [6], [7]. Recent evidence suggests that fate decisions can be partly made even before cells experience an environmental change [8], [9], [10]. A cell's ultimate fate depends on its historical state, indicating that phenotypic variability is shaped by pre-disposition factors [11].
It has been proposed that population heterogeneity increases fitness in unpredictable environments [12], [13]. This may work as a kind of bet-hedging [7], [14], [15], allowing a given genotype to express multiple phenotypes of differing viability. One phenotype may be better adapted to the current environment while others are prepared for future environmental changes under which they may gain higher fitness. On the other hand, heterogeneous populations may simply undergo performance-based selection, in which fitter cells always perform better despite an environmental change.
Stress-responsive genes show greater expression variability than genes from other classes [5], suggesting the hypothesis that variability arises as an anti-stress adaptation evolutionary strategy. Among the stresses that bacteria face, antibiotics are prominent and widespread [16]. Yet the consequences of low-grade antibiotic stress are rather poorly understood. Our interest here is to characterize the dynamic process of stress-induced phenotypic heterogeneity. Specifically, we address the following questions: Will sub-inhibitory antibiotic concentrations further amplify phenotypic variation to the extent of producing persistant and sensitive sub-populations? Are there any predetermining factors that modulate the response? How does this variation propagate through the bacterial lineage?
To this end, we followed the growth of micro-colonies from single Escherichia. coli (E. coli) cells under microfluidic control. We exposed cells to sub-inhibitory concentrations of the aminoglycoside antibiotic streptomycin and tracked their responses at the single-cell level. We find that mild antibiotic treatment results in rapid generation of increased phenotypic variability in terms of stress-induced gene expression, growth rate, survival and death. Stochastic events leading to differentiated outcomes may precede the application of stress, propagating in a more deterministic fashion within the lineage as the stress persists. Counter-intuitively, progenitors that exhibit relatively higher maintenance activity prior to stress are not primed for survival, but are rather more likely to develop frail progeny.
Results
Sub-inhibitory concentration of streptomycin induces heat-shock-responsive gene expression independent of genetic variability
Streptomycin penetrates aerobically growing bacteria and targets the ribosome, causing mistranslation of nascent proteins [17]. These in turn may misfold, resulting in the induction of RpoH-mediated heat-shock-responsive gene expression [18]. We monitored the heat-shock response using a chromosomal transcriptional fusion of the yellow fluorescent protein (YFP) to the RpoH-driven ibpAB promoter [19], [20]. This construct was found to be a highly sensitive reporter (Figure S1). We found streptomycin concentrations (<4 µg/ml), lower than the minimal inhibition concentration (MIC), where significant induction of the heat-shock response can be detected with minimal perturbation to bacterial population growth rate (Figure S2). The survival rate in these conditions, as determined by plating experiments, is 100% (see Materials and Methods).
Stress responses vary broadly from survival to death and propagate within lineages
We followed the outcome of low-dose streptomycin treatment at the single-cell level within its lineage context by time-lapse fluorescence microscopy. This allowed us to determine the extent to which a cell's stress state depends on its ancestors and life history. From a single cell exposed to antibiotics, large variations in fluorescence and growth rate phenotypes were found to propagate through the lineage (Video S1). As can be seen in this typical movie, cells may either survive or die. As early as the first division, the two daughter cells differentiate into sub-lineages: one with higher fluorescence signal, visible inclusion bodies, slower growth and fewer total divisions before the ultimate death of all its descendants. Here ‘death’ is defined as prolonged arrest in cell growth and gradual loss of contrast in phase contrast images. The other sub-lineage grows faster (engulfing the dead cousins), exhibits lower fluorescence and further develops variation in fluorescence signal and growth rate. Periodic ‘switch on’ events, characterized by increased fluorescence and slowed growth, recur within this sub-lineage (Video S1). Thus, in response to stress induction, single cells give rise to progeny of diverse phenotypes. Other examples of stressed 2D colonies can be found in Figure S3.
We further studied the emergence of variability using a microfluidic setup allowing controlled environmental changes while following micro-colony growth with time-lapse microscopy [8]. In this setup, single cells were grown without stress for four generations prior to streptomycin treatment. The micro-colonies were monitored by phase contrast and fluorescence time-lapse microscopy (Video S2, Video S3 as representative examples). The time-series images were analyzed by our custom-made open-source software ‘Cellst’ [21] to segment the cells, quantify their growth rate and fluorescence intensities, and reconstruct their lineage (Materials and Methods).
Under induced stress conditions, the pibpAB-YFP signal was found to negatively correlate with growth rate (Figure 1A). In contrast, in absence of stress, a positive correlation prevails (Figure S4A). Therefore, the promoter fusion is a valid reporter for the protein quality, streptomycin-induced stress response. Notably, when the stress is so severe that cells stop growing, overall promoter activity diminishes. As shown in Figure 1a, the correlation saturates at low growth rates. Single cell growth rates exhibit a bimodal distribution (Figure 1B), with one sub-population identified as death-prone (Figure 1A, data points in red). The commitment to eventual cell death can be traced back as early as one generation (30 minutes, Figure S6) after induction, even though the actual death may take up to 3 generations to occur (Figure 1C, Figure S6). Staining with Propidium iodide (PI), a widely used death marker that fluoresces upon intercalation between DNA bases yet can diffuse only through depolarized cellular membranes, supports our conclusion that growth-arrested cells are indeed killed by continuous antibiotic exposure (Figure S5). While a significant (>5 hours) delay occurs between growth-arrest and PI signal, all growth-arrested cells are eventually marked.

Phenotypic variation increases after stress
We quantified phenotypic variation as the sub-lineage coefficient of variation (SLCV) and individual coefficient of variation (IDCV) of cellular fluorescence intensity or growth rate across time (Text S1). The IDCV measures the phenotypic heterogeneity among a population of single cells regardless of their lineage relation, while the SLCV quantifies the differences among sub-populations of cells grouped according to common progenitors. For example, a single cell may divide twice to form a four-cell micro-colony. These four cells continue to divide respectively. Under normal conditions, the four subsequent sub-lineages are expected to have similar phenotypes, with relatively small differences. However, if the four sub-lineages show significantly large variation in phenotype, we would conclude that differentiation had occurred in the four-cell micro-colony, leading to significantly different sub-lineages. It follows, as depicted theoretically below, that large SLCV with respect to IDCV, indicates occurrence of differentiation.
Consider a micro-colony originated from a single cell. At time s, the micro-colony reaches Ns cells. At a later time point t>s, each cell from time s has produced ni progeny, whose fluorescence intensity or growth rate are denoted as xik (i = 1∼Ns; k = 1∼ni). Therefore, the total number of cells at time t is Nt = n1+n2…+nNs
The SLCV for a starting point s and end point t is calculated as

Let IDCV be the coefficient of variation among all individual cells in the micro-colony.

We expect that if no differentiation occurs between the sub-lineages (see Text S1 for the derivation):


We then calculated the actual SLCV and IDCV curves from the growth rate and fluorescence signal experimental data with different starting points Ns = 4, 8, 16, 32, 64 (eg. 2∼6 generations) under induced and non-induced conditions (Figure 2). The IDCV and SLCV values are similar and stable through 8 generations of micro-colony growth without induction, indicating no differentiation (Figure 2C and 2D). In contrast, when streptomycin is added at the 8–16 cell stage, both values increase (Figure 2A and 2B). The SLCV increases faster than the IDCV, indicating differentiation. The SLCV curves with a starting point prior to induction (Ns = 4, 8) also increase relative to the IDCV, indicating that differentiation potentially occurs among sibling cells even before they encounter the stress condition. This suggests that the stress has revealed a pre-existing difference in physiological states among the non-induced cells. In other words, there may exist pre-disposition factors in non-induced cells that prime the stress-induced differentiation.

We used data randomization to assess the significance of these experimental results. Randomly-chosen cells were switched within the lineage tree as follows: For a micro-colony with final population of N cells, N pairs of cells were chosen for switching to achieve sufficient mixing. Only cells born after stress induction were selected. In order to preserve the time course profile, switching was only allowed between cells of the same generation. As expected, while IDCV remains unchanged, SLCV decreases and is indistinguishable from IDCV (Figure S8). This result highlights the existence of extended memory effect in the original data.
We could exclude a genetic component to the observed variability increase under stress. Identical variability emerged by repeating the above microfluidics experiments with cells from an exponential phase culture, initially stressed (2 hours, 3 ug/ml Streptomycin), washed, and recovered for 4 hours in absence of stress (data not shown). Indeed, mutations would not be expected to reproducibly manifest these phenotypic effects given the rapid emergence of variability by 4–16 cell stage.
The stress response is characterized by phenotypic predisposition and epigenetic inheritence
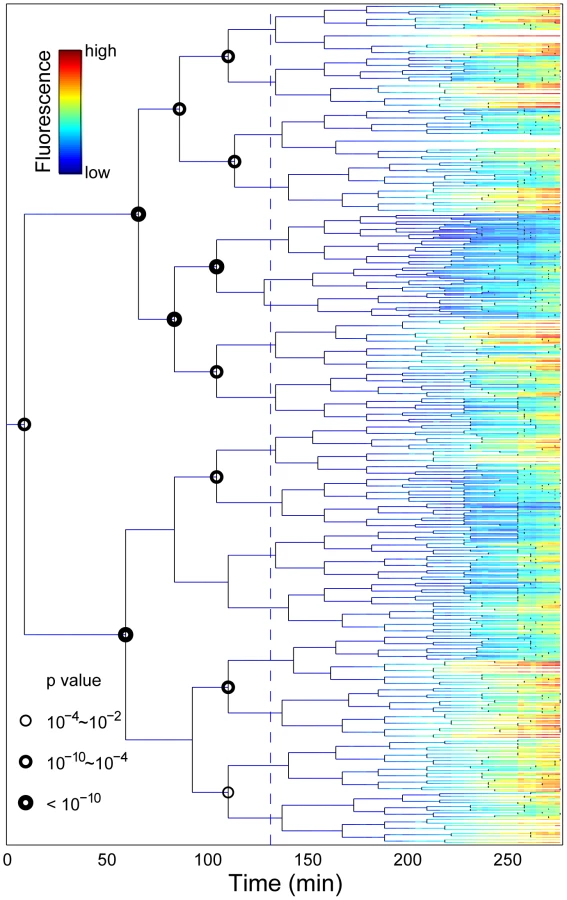
In agreement with the SLCV analysis, the detailed view of the induction phenotype within the lineage context reveals significant sub-lineage divergence as well as clustering of stress induction (Figure 3; Video S2). To highlight the existence of pre-disposition factors in single cells, we compared the RpoH-driven stress response and growth rate of the descendants of each sister cell at the tree nodes prior to induction. In most cases, there was a significant difference between the mean fluorescence (T-test, p-value <0.01; circled nodes, Figure 3) and mean growth rate (Figure S10) of the two progeny groups. To assess the significance of this result, we randomly exchanged progeny measurements in the experimentally derived tree. For each pair of sister cells born prior to induction (15 nodes), we generated 500 randomized trees where progeny were randomly re-assigned. In the stark majority of the runs, no significant difference was detected between the descendants of the pre-induction sister cells. At most, fewer than two percent of the runs per node were statistically significant (p value <0.01). This is in contrast with the experimental data (Figure 3) where the majority of these events (12 of 15) are significant indicating a 15!/12!/3!)*0.02∧12 = 2E-18 probability of generating our experimental tree by chance. This suggests that differentiation between progenitor sister cells occurred prior to stress induction.
In search of a marker for pre-disposition, we considered differentiation events occurring within the time-scale of the stressed cellular phenotype memory half-life time (90 minutes, see below, Figure 4). That is, we compared sibling progeny at 90 minutes after induction. We found no global correlation in the comparison of fluorescence intensity, promoter activity, or growth rate between the non-induced progenitor cells and their induced progeny (Figure S9). However, for the specific identified differentiation events (T-test, p-value <0.01, Figures S11, S12, S13, S14), there is a clear bias (p-value of binomial distribution test <0.003 Figures S11, S12, S13, S14) that the more fluorescent sister gives rise to a sub-lineage with more stressed siblings.

The memory or epigenetic effect was further quantified with a gene expression level auto-correlation function. In its simplest form (i.e. stable gene product and constant production rate), this auto-correlation is expected to decrease exponentially with half-life equal to the cellular doubling time ([22]; Text S1 and Figure S19). In case of nonlinear regulation, such as a positive feedback loop, the half-life will be longer than the doubling time. To this end, we calculated the auto-correlation function of the fluorescence signal, representing the RpoH-driven gene expression level. As expected, before induction, the auto-correlation function decreases exponentially with a half-life close to the cells' doubling time (23 Minutes; Figure 4). However, a significant delay of the auto-correlation function decrease is observed after induction (Figure 4). Note that the auto-correlation function half-life increases after induction to as long as three times the cell doubling time (140 minutes, Figure 4 red line). This is indicative of epigenetic effects that last longer than a generation. It is thus likely that nonlinear effects such as positive feedback contribute to the delayed decrease in auto-correlation.
The epigenetic inheritance of stress responses may be mediated by increased membrane permeability
It was previously proposed that streptomycin exposure could induce further streptomycin uptake by damaging the bacterial cytoplasmic (inner) membrane [23]. Such a positive feedback loop could be responsible for the epigenetic effects described above. Upon streptomycin treatment, the cytoplasmic membrane integrity is challenged by mistranslated periplasmic [23] and membrane proteins [18]. However, despite reports of increased secretion of small molecules [24], direct evidence for increased membrane permeability after streptomycin treatment is scarce. If streptomycin (molecular weight MW = 581 g/mol) treatment increases the membrane permeability, it should also increase permeability of other molecules with similar size. Therefore, controlled gene expression by transcriptional inducers such as anhydrotetracycline (ATC, analog of tetracycline, MW = 463 g/mol) should function as indicators of a parallel increase in streptomycin uptake. Similar to streptomycin, tetracycline (MW = 444 g/mol) can penetrate the outer membrane through porins [25] and diffuse across the cytoplasmic membrane. The latter step is rate limiting for both streptomycin [26] and tetracycline, with half-equilibration time of 35±15 minutes [27]. Such slow permeation rates produce detectable variation in the intracellular inducer concentration. Consider cells co-induced by streptomycin and ATC, a positive correlation between the heat-shock reporter and an ATC-inducible reporter is expected if the higher stress level induced by streptomycine leads to higher membrane permeability, with a corresponding influx of ATC molecules.
To test this hypothesis, a tetR-controlled fluorescence reporter was chromosomally integrated in the ibpAB-promoter-driven fluorescence reporter strain. When the strain was co-induced with both ATC and streptomycin, a positive correlation between two reporters was observed (Figure 5). Furthermore, compared to ATC induction alone, the expression level of the tetR reporter is stronger in the presence of streptomycin. The possibility that the positive correlation is due to elevated global protein expression level in higher stressed cells was excluded as no positive correlation was found between prrna promoter (e.g. a constitutive promoter) and pibpAB activity after stress (Figure S15). These results suggest that cells accumulate higher concentration of ATC under streptomycin stress, supporting the hypothesis that streptomycin stress increases the cytoplasmic membrane permeability. Such increased membrane permeability is likely to allow higher uptake of streptomycin as well, closing a positive feedback loop of stress induction which leads to the observed epigenetic effect (Figure 4). As control, we tested two other antibiotics at sub-inhibitory concentrations: Mitomycin C (a DNA cross-linker) and Nalidixic acid (topoisomerase inhibitor) that are not expected to significantly impact translational fidelity. Indeed, while these antibiotics induced the SOS response (judged by characteristic filamentation) they did not induce the ibpAB promoter and did not enhance but rather reduced the ATC induction levels (Figure S16).

Discussion
We demonstrated that sibling E. coli cells diverge in their response to a sub-inhibitory concentration of streptomycin, to the extent that sub-populations may die and others survive within the same growing micro-colony in a homogeneously defined environment (Figure 1 and Figure S5). Upon induction, phenotypic differentiation events occurred, manifested as a stronger increase of the coefficient of variation among sub-lineages as compared to that of the coefficient of variation among individual cells (Figure 2), leading to significant differences between sister's progeny (Figure 3). Increased phenotypic variation upon stress is coupled with transient epigenetic inheritance that lasts for up to three generations, as opposed to a typical autocorrelation half-life of one generation time in absence of stress (Figure 4). Our results indicate the existence of nonlinear feedbacks that prolong the memory lifetime. The correlated expression of an ATC-induced tetR promoter and a streptomycin-induced ibpAB promoter (Figure 5) agrees with the hypothesis that streptomycin treatment leads to higher cellular membrane permeability, allowing more streptomycin as well as ATC molecules to enter the cell. Such feedback could be triggered by random events such as bursts of membrane damage by nascent mistranslated proteins or the asymmetric segregation of damaging factors during cell division [28]. While some cells are induced earlier and pass on the stressed state to descendants, others stay relatively healthy for a longer time, resulting in sustained diversification of cell fate. Therefore, we argue that positive feedback and stochasticity are responsible for the differentiation and increased variation.
Apart from membrane permeability, there may be other feedback pathways that can affect cell fate. For example, streptomycin may lead to production of ribosomes with lower accuracy, which in turn produce more dysfunctional ribosomes [29]. Or the amount of misfolded protein in the cell could exceed the capacity of the chaperone system, preventing the latter from maintaining protein homeostasis [30]. Recent work presents a revised view of the antibiotic mode of action, showing that apart from targeting a single entity, antibiotics broadly effect on the global metabolism of the cell [31], [32]. It is well established that sub-inhibitory concentration of antibiotics can directly or indirectly interact with different functional modules in the cell [33]. In the presence of stochastic events, such complex response processes are expected to produce diverse phenotypic outcomes. The process described here may play a role in other systems, since stochastic fluctuation and positive feedback are common. Our methodology could be applied to test other stresses, where incurred damage weakens the defense system of cells, leading to further damage accumulation.
The early occurrence of differentiation events (Figure 2 and Figure 3) indicates that the stress condition can reveal differences in cellular physiological state existing prior to induction. Some cells are intrinsically more resistant to stress than others. After induction, the difference is amplified and passed on in the respective sub-lineages, resulting in differentiation and increased variability. Similar pre-disposition phenomena have been reported in other induction-response systems. For example, the probability of lysogeny during phage infection is determined by both the number of infecting phage and the size of the host cell [9]. In the lactose switch, the bacterial growth rate and basal LacI level are highly predictive of switching outcome after induction [8]. In Bacillus subtilis, the decision to form an endospore is made two generations before encountering starvation conditions [10]. Whether these pre-disposition factors are a consequence of natural selection for bet hedging is mostly unclear. In the case of ampicillin ‘persisters’, a sub-population of bacteria transiently enter a dormant state in a non-stressing environment and can thus survive ampicillin treatment that attacks only growing cells [14]. Such persister cells pay a cost to express a phenotype which is less fit in the current environment but more fit for a particular environmental change. This example was interpreted as a bet-hedging strategy anticipating the arrival of future stress conditions. Yet whether it is beneficial to apply a bet-hedging strategy depends on the phenotypic switching rate, the time scale of environmental change and the fitness cost [15], or on rather stochastic events inherent to cellular physiology rather than resulting from a positive evolutionary fitness gain. In our observations, there is no sign of a pre-disposition factor working to hedge phenotypic bets. Higher stress responses prior to induction do not prime our cells for the stress to come. Instead, cells with relatively higher basal RpoH transcriptional activity are more likely to give rise to more stressed progeny (Figure S11, S12, S13, S14). This suggests that under non-stressed conditions, cells with a higher basal stress level may be paying a cost which will not help them to survive the upcoming stress. It is the weaker cells that simply suffer more, while fitter cells prevail, suggesting a simple performance-based selection.
It was recently shown that antibiotic-resistant mutants can emerge rapidly in a structured environment with a gradient of antibiotic concentrations, even from small population of 100 cells [34]. The fact that a single bacteria can generates highly variable progeny at sub-inhibitory antibiotic concentrations may facilitate this process, as it has been shown theoretically that higher variation in cellular growth rate indicates higher selection pressure [35]. Our findings may have clinical relevance as it is common that pathogens encounter sub-lethal doses of antibiotics, due either to disruptions in the prescribed medication regime or limited diffusion through structured niches such as biofilms.
Materials and Methods
Strains
All strains were derived from the wild-type strain E. coli MG1655 [36]. The YFP gene was integrated downstream of the ibpAB promoter with the ibpAB operon [19]. The strain with pibpAB-RFP and ptetR-YFP is from [37]. The strain with prrna-CFP and pibpAB-RFP is from [19].
Survival upon streptomycin stress
E. coli were cultured overnight at 37°C in Luria-Bertani (LB) medium (Bacto). The cell culture was diluted and plated on LB-agar plates with different concentrations of streptomycin (0–4 µg/ml). The number of colonies on the plates were counted following overnight incubation at 37°C.
Microfluidics-microscopy setup
A detailed description of the microfluidic setup can be found in [8]. In short, cells were plated on a thin agarose pad (1.5% agarose in LB medium). The agarose pad was then inverted and laid on a cover slide with cells contacting the glass. A block of crosslinked poly(dimethylsiloxane) (PDMS RTV615, General Electric) with the feeding channel structures is exposed to air plasma (HARRICK PLASMA) and then placed over the agarose pad with the rest of surface area sticking to the cover-slide. LB medium or LB supplemented with 3 µg/ml streptomycin (Sigma) is injected into the feeding channel (2 ml per hour) and diffuses through the agarose pad to feed the cells. With this setup, it is possible to switch the medium on the spot with <1 minute homogenisation time [8].
We controlled for positional effects and no difference in cellular growth rate was found at different locations within a micro-colony (Figure S17 and S18). Additional controls on homogeneous permeability of the agarose layer have already been reported [8].
All the experiments are run at 37°C using a Zeiss automated microscope (Axio Observer Z1, HXP 120, 63× objective) with a temperature-controlled chamber (Live Imaging Services). For each media condition (with or without streptomycin), four single cells were chosen to be followed. Phase contrast photos were taken every 90 seconds while fluorescence photos were taken every 180 seconds (2% lamp energy, 3 second exposure).
2D micro-colony growth on agarose pad
Overnight cultures in LB 37°C were diluted 200 fold into fresh LB and agitated at 37°C for 2 hours. 1 µl of cell culture was dropped onto an agarose pad (1.5% agarose in LB medium with or without 3 µg/ml streptomycin or 25 ng/ml ATC). The agarose pad was covered with a cover-slide and the border sealed with nail polish [38], [39].
Image analysis and lineage reconstruction
Phase contrast images were analyzed by customized software “Cellst” [21] for cell segmentation and micro-colony lineage reconstruction. The cell border was then projected onto the corresponding fluorescence image to determine the fluorescence intensity of the cells, defined as the mean grey level (background subtracted) of the pixels inside cell border. The exact location of a cell was set as the pixel coordinate of the centre of mass of the cell area. The length of a cell is measured as the long axis of the cell area.
Supporting Information
Zdroje
1. LidstromME, KonopkaMC (2010) The role of physiological heterogeneity in microbial population behavior. Nat Chem Biol 6 : 705–712.
2. EldarA, ElowitzMB (2010) Functional roles for noise in genetic circuits. Nature 467 : 167–173.
3. Bar-EvenA, PaulssonJ, MaheshriN, CarmiM, O'SheaE, et al. (2006) Noise in protein expression scales with natural protein abundance. Nat Genet 38 : 636–643.
4. TaniguchiY, ChoiPJ, LiGW, ChenHY, BabuM, et al. (2010) Quantifying E-coli Proteome and Transcriptome with Single-Molecule Sensitivity in Single Cells. Science 329 : 533–538.
5. NewmanJRS, GhaemmaghamiS, IhmelsJ, BreslowDK, NobleM, et al. (2006) Single-cell proteomic analysis of S-cerevisiae reveals the architecture of biological noise. Nature 441 : 840–846.
6. NovickA, WeinerM (1957) Enzyme Induction as an All-or-None Phenomenon. Proc Natl Acad Sci U S A 43 : 553–566.
7. VeeningJW, SmitsWK, KuipersOP (2008) Bistability, Epigenetics, and Bet-Hedging in Bacteria. Annu Rev Microbiol 62 : 193–210.
8. RobertL, PaulG, ChenY, TaddeiF, BaiglD, et al. (2010) Pre-dispositions and epigenetic inheritance in the Escherichia coli lactose operon bistable switch. Mol Syst Biol 6 : 357.
9. ZengLY, SkinnerSO, ZongCH, SippyJ, FeissM, et al. (2010) Decision Making at a Subcellular Level Determines the Outcome of Bacteriophage Infection. Cell 141 : 682–691.
10. VeeningJW, StewartEJ, BerngruberTW, TaddeiF, KuipersOP, et al. (2008) Bet-hedging and epigenetic inheritance in bacterial cell development. Proc Natl Acad Sci U S A 105 : 4393–4398.
11. SnijderB, PelkmansL (2011) Origins of regulated cell-to-cell variability. Nat Rev Mol Cell Biol 12 : 119–125.
12. BlakeWJ, BalazsiG, KohanskiMA, IsaacsFJ, MurphyKF, et al. (2006) Phenotypic consequences of promoter-mediated transcriptional noise. Mol Cell 24 : 853–865.
13. FraserD, KaernM (2009) A chance at survival: gene expression noise and phenotypic diversification strategies. Mol Microbiol 71 : 1333–1340.
14. BalabanNQ, MerrinJ, ChaitR, KowalikL, LeiblerS (2004) Bacterial persistence as a phenotypic switch. Science 305 : 1622–1625.
15. KussellE, LeiblerS (2005) Phenotypic diversity, population growth, and information in fluctuating environments. Science 309 : 2075–2078.
16. D'CostaVM, KingCE, KalanL, MorarM, SungWWL, et al. (2011) Antibiotic resistance is ancient. Nature 477 : 457–461.
17. MagnetS, BlanchardJS (2005) Molecular insights into aminoglycoside action and resistance. Chem Rev 105 : 477–497.
18. KohanskiMA, DwyerDJ, WierzbowskiJ, CottarelG, CollinsJJ (2008) Mistranslation of Membrane Proteins and Two-Component System Activation Trigger Antibiotic-Mediated Cell Death. Cell 135 : 679–690.
19. FontaineF, StewartEJ, LindnerAB, TaddeiF (2008) Mutations in two global regulators lower individual mortality in Escherichia coli. Mol Microbiol 67 : 2–14.
20. KraftM, KnupferU, WenderothR, PietschmannP, HockB, et al. (2007) An online monitoring system based on a synthetic sigma32-dependent tandem promoter for visualization of insoluble proteins in the cytoplasm of Escherichia coli. Appl Microbiol Biotechnol 75 : 397–406.
21. Primet M, Demarez A, Taddei F, Lindner AB, Moisan L (2008) Tracking of cells in a sequence of images using a low-dimension image representation. 2008 Ieee International Symposium on Biomedical Imaging: from Nano to Macro, Vols 1–4. New York: Ieee. pp. 995–998.
22. SigalA, MiloR, CohenA, Geva-ZatorskyN, KleinY, et al. (2006) Variability and memory of protein levels in human cells. Nature 444 : 643–646.
23. DavisBD, ChenLL, TaiPC (1986) Misread Protein Creates Membrane Channels - an Essential Step in the Bactericidal Action of Aminoglycosides. Proc Natl Acad Sci U S A 83 : 6164–6168.
24. AnandN, DavisBD (1960) Effect of Streptomycin on Escherichia-Coli. Nature 185 : 22–23.
25. DelcourAH (2009) Outer membrane permeability and antibiotic resistance. Biochim Biophys Acta -Proteins and Proteomics 1794 : 808–816.
26. TaberHW, MuellerJP, MillerPF, ArrowAS (1987) Bacterial Uptake of Aminoglycoside Antibiotics. Microbiol Rev 51 : 439–457.
27. SiglerA, SchubertP, HillenW, NiederweisM (2000) Permeation of tetracyclines through membranes of liposomes and Escherichia coli. Eur J Biochem 267 : 527–534.
28. HuhD, PaulssonJ (2011) Non-genetic heterogeneity from stochastic partitioning at cell division. Nat Genet 43 : 95–100.
29. NinioJ (1991) Connections between Translation, Transcription and Replication Error-Rates. Biochimie 73 : 1517–1523.
30. LindnerAB, DemarezA (2009) Protein aggregation as a paradigm of aging. Biochim Biophys Acta -General Subjects 1790 : 980–996.
31. DaviesJ, SpiegelmanGB, YimG (2006) The world of subinhibitory antibiotic concentrations. Curr Opin Microbiol 9 : 445–453.
32. KohanskiMA, DwyerDJ, HayeteB, LawrenceCA, CollinsJJ (2007) A common mechanism of cellular death induced by bactericidal antibiotics. Cell 130 : 797–810.
33. NicholsRJ, SenS, ChooYJ, BeltraoP, ZietekM, et al. (2011) Phenotypic Landscape of a Bacterial Cell. Cell 144 : 143–156.
34. ZhangQC, LambertG, LiaoD, KimH, RobinK, et al. (2011) Acceleration of Emergence of Bacterial Antibiotic Resistance in Connected Microenvironments. Science 333 : 1764–1767.
35. LeiblerS, KussellE (2010) Individual histories and selection in heterogeneous populations. Proc Natl Acad Sci U S A 107 : 13183–13188.
36. BlattnerFR, PlunkettG, BlochCA, PernaNT, BurlandV, et al. (1997) The complete genome sequence of Escherichia coli K-12. Science 277 : 1453–1462.
37. GiraudA, ArousS, De PaepeM, Gaboriau-RouthiauV, BambouJC, et al. (2008) Dissecting the genetic components of adaptation of Escherichia coli to the mouse gut. PLoS Genet 4: e2 doi:10.1371/journal.pgen.0040002.
38. LindnerAB, MaddenR, DernarezA, StewartEJ, TaddeiF (2008) Asymmetric segregation of protein aggregates is associated with cellular aging and rejuvenation. Proc Natl Acad Sci U S A 105 : 3076–3081.
39. StewartEJ, MaddenR, PaulG, TaddeiF (2005) Aging and death in an organism that reproduces by morphologically symmetric division. PLoS Biol 3: e45 doi:10.1371/journal.pbio.0030045.
Štítky
Genetika Reprodukční medicínaČlánek vyšel v časopise
PLOS Genetics
2012 Číslo 12
Nejčtenější v tomto čísle
- Population Genomics of Sub-Saharan : African Diversity and Non-African Admixture
- Dnmt3a Protects Active Chromosome Domains against Cancer-Associated Hypomethylation
- Excessive Astrocyte-Derived Neurotrophin-3 Contributes to the Abnormal Neuronal Dendritic Development in a Mouse Model of Fragile X Syndrome
- Pre-Disposition and Epigenetics Govern Variation in Bacterial Survival upon Stress