
Controls Gliogenesis by Regulating the Transient Expression of the Gcm/Glide Fate Determinant
The Gcm/Glide transcription factor is transiently expressed and required in the Drosophila nervous system. Threshold Gcm/Glide levels control the glial versus neuronal fate choice, and its perdurance triggers excessive gliogenesis, showing that its tight and dynamic regulation ensures the proper balance between neurons and glia. Here, we present a genetic screen for potential gcm/glide interactors and identify genes encoding chromatin factors of the Trithorax and of the Polycomb groups. These proteins maintain the heritable epigenetic state, among others, of HOX genes throughout development, but their regulatory role on transiently expressed genes remains elusive. Here we show that Polycomb negatively affects Gcm/Glide autoregulation, a positive feedback loop that allows timely accumulation of Gcm/Glide threshold levels. Such temporal fine-tuning of gene expression tightly controls gliogenesis. This work performed at the levels of individual cells reveals an undescribed mode of Polycomb action in the modulation of transiently expressed fate determinants and hence in the acquisition of specific cell identity in the nervous system.
Published in the journal:
. PLoS Genet 8(12): e32767. doi:10.1371/journal.pgen.1003159
Category:
Research Article
doi:
https://doi.org/10.1371/journal.pgen.1003159
Summary
The Gcm/Glide transcription factor is transiently expressed and required in the Drosophila nervous system. Threshold Gcm/Glide levels control the glial versus neuronal fate choice, and its perdurance triggers excessive gliogenesis, showing that its tight and dynamic regulation ensures the proper balance between neurons and glia. Here, we present a genetic screen for potential gcm/glide interactors and identify genes encoding chromatin factors of the Trithorax and of the Polycomb groups. These proteins maintain the heritable epigenetic state, among others, of HOX genes throughout development, but their regulatory role on transiently expressed genes remains elusive. Here we show that Polycomb negatively affects Gcm/Glide autoregulation, a positive feedback loop that allows timely accumulation of Gcm/Glide threshold levels. Such temporal fine-tuning of gene expression tightly controls gliogenesis. This work performed at the levels of individual cells reveals an undescribed mode of Polycomb action in the modulation of transiently expressed fate determinants and hence in the acquisition of specific cell identity in the nervous system.
Introduction
One of the most challenging issues in biology is to elucidate the mechanisms underlying cell fate determination and maintenance. The Drosophila melanogaster Glial cell missing/Glial cell deficient transcription factor (Gcm/Glide, referred throughout the text to as Gcm) is transiently expressed and is key to decide between glial and neuronal fates in the multipotent neural precursors [1]–[6]. Threshold levels of Gcm are necessary and sufficient to induce gliogenesis and the tight regulation of its expression prevents defective/excessive gliogenesis [7]–[11]. These features make Gcm an ideal tool to study cell differentiation and plasticity.
Two major classes of proteins that modify the chromatin structure and its condensation state, the Polycomb group (PcG) and the Trithorax group (TrxG), are known as critical regulators of HOX transcription factors, which act as molecular switches that are maintained in a silent or in an active state [12]. PcG and TrxG proteins act in large multimeric complexes that bind specific DNA regions called Polycomb (or Trithorax) response elements (respectively PREs and TREs) [13]. PcG and TrxG complexes trigger posttranslational modification of histone tails that have opposite effects on gene activity, mainly methylation of H3K27 induced by PcG complexes (negative regulation) and methylation of H3K4, H3K36 as well as acetylation of H3K27 by TrxG complexes (positive regulation) ([12], [14] and references therein). PcG proteins enter two main conserved complexes called Polycomb Repressive Complex 1 and 2 (PRC1 and PRC2). The latter is formed by four core components including, in flies, Enhancer of zeste (E(z)), and catalyzes the reaction that leads to di - and tri-methylation of H3K27. This epigenetic mark is recognized by Polycomb (Pc), which belongs to the PRC1 complex.
Recent chromatin immunoprecipitation studies have shown that PcG and TrxG binding is also associated with dynamic transcriptional states modulating different processes including mitogenic pathways and progression from multipotency to differentiation ([12], [15]–[19] and references therein). Understanding the mode of action of PcG and TrxG proteins in dynamic processes, however, requires analyses at the level of identified cells and times. This is particularly important for developmental genes that are expressed transiently and in specific cell populations. The present in vivo study analyzes the role of Pc in fly gliogenesis.
To identify components and regulators of the Gcm pathway, we designed a screen for genetic modifiers of a dominant phenotype due to gcm ectopic expression and identified PcG and TrxG proteins. Importantly, mutations in PcG components and in TrxG members found in chromatin remodeling complexes enhance the gcm dominant phenotype, whereas mutations in TrxG proteins known to specifically counteract PcG function rescue it. This suggests that a balanced action of these chromatin modifiers regulate Gcm function. Moreover, we demonstrate that the gcm regulatory sequences carry a PRE and are bound by Pc. Finally, Pc inhibits the autoregulatory loop ensuring threshold Gcm levels [7] and hence gliogenesis.
To our knowledge, this is the first direct evidence that PcG proteins negatively modulate a transiently expressed fate determinant, thereby affecting a specific lineage in the nervous system.
Results
A screen to identify gcm genetic interactors
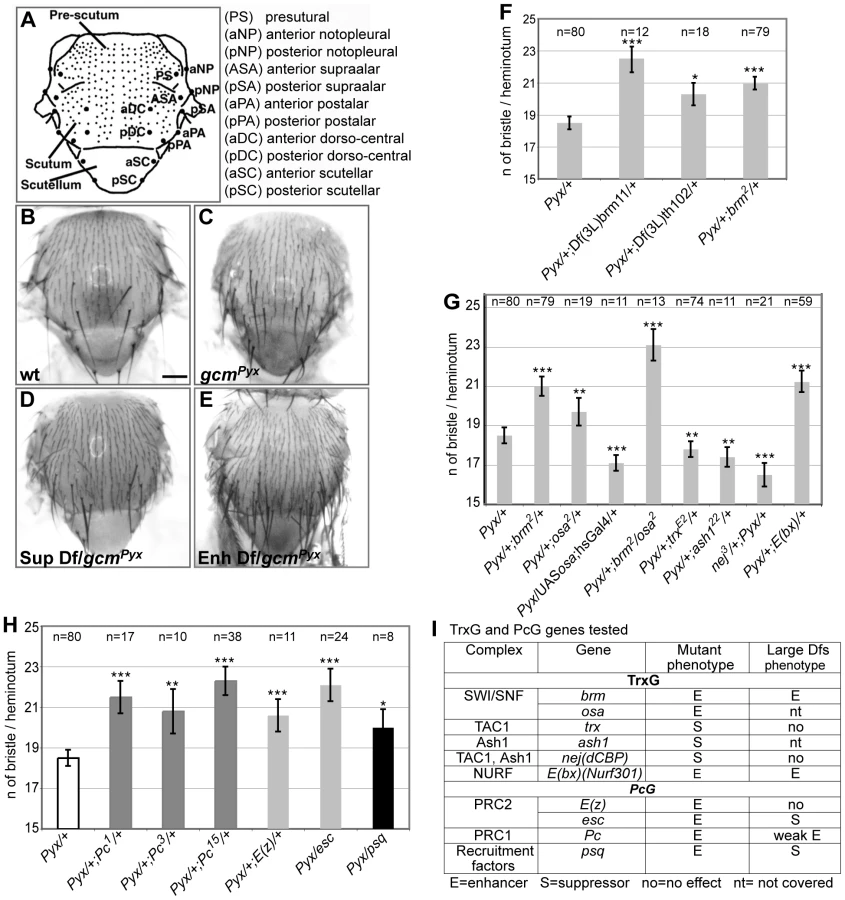
The need of tight Gcm regulation prompted us to screen for interactors using a sensitized background. This approach allows the dissection of molecular cascades when the loss of a gene product is embryonic lethal. The Drosophila thorax (notum) carries a stereotyped number of sensory organs called macrochaete or bristles. gcmPyx/+ flies ectopically express gcm in the larval notum, which triggers the differentiation of supernumerary sensory organ precursors (SOPs) and bristles (Figure 1A–1C) [20]. gcmPyx/+ females show, in average, 18,5 bristles instead of the 11/heminotum typical of wild-type (wt) animals. Using large overlapping deficiencies (67–75% genome coverage, Deficiency kit, Bloomington), we performed a primary screen and identified 42 genomic regions that dominantly enhance or suppress the gcmPyx dominant phenotype when deleted (Figure 1D–1E, Figure S1Aa and S1B). These regions were selected for quantitative analyses (Figure S1Ab), which identified weakly and strongly modifying deficiencies. We further analyzed the latter ones (Figure S1Ab, S1B) and identified 28 interacting genomic regions. A secondary quantitative screen with smaller deficiencies (Figure S1Ac, Table 1) allowed us to identify those that act as strong modifiers, based on statistical analyses. Single gene loss of function mutations within those deficiencies were then analyzed and the interaction was confirmed for 18 of them (Figure S1Ad, Figure S2, Table 1). In sum, the Deficiency kit allowed us to identify large interacting regions and to progressively refine the analysis to single mutations.

To evaluate the specificity and the sensitivity of the screen, we asked whether the selected deficiencies eliminate genes expected to interact with gcm. The gcmPyx phenotype correlates with the ectopic formation of proneural territories and precursors of the central (CNS) and peripheral (PNS) nervous systems, neuroblasts (NB) and SOPs, respectively [21], [22]. Thus, mutations of NB/SOP specific genes should act as gcmPyx suppressors and indeed, the large and the small deficiencies covering three genes – escargot (esg), worniu (wor) and snail (sna) – expressed in most embryonic NBs act as gcmPyx suppressors (Table 1, Figure S1C). Testing single gene loss of functions confirmed that sna and esg mutations act as gcmPyx suppressors. Accordingly, esg overexpression triggers the opposite phenotype (Figure S1C). Finally, genes as pimples (pim) and crooked legs (crol), identified in a microarray as induced by Gcm [23], were also identified in our screen (Figure S1D).
The fact that known and predicted gcm interactors were identified validates our screen and shows that the dominant bristle phenotype is a reliable and very sensitive readout.
The Pc and the trx group mutations interact with gcmPyx
A genomic region identified in the screen covers the trxG gene brahma (brm), which encodes a transcriptional coactivator related to yeast SWI/SNF proteins and plays a role in ATP-dependent nucleosomal remodeling [24]. The large and the small deficiencies covering brm, Df(3L)brm11, Df(3L)th102 and, most importantly, a null brm allele, enhance the gcmPyx phenotype (Figure 1F). To extend our findings, we tested osa, an integral component of the Brahma complex [25]. osa loss of function also enhances the gcmPyx phenotype, whereas osa gain of function (GOF: hs-Gal4;UAS-osa flies) suppresses it (Figure 1G, 1I). Thus, osa acts as brm, moreover, double brm/osa heterozygous mutants show an even stronger phenotype.
Furthermore, a deficiency covering Enhancer of bithorax (E(bx)) and the E(bx) mutation itself enhance the gcmPyx phenotype (Table 1, Figure 1G, 1I). Interestingly, E(bx) (also called NURF301) encodes a transcription coactivator that belongs to the ISWI chromatin remodeler complex, another TrxG complex, and negatively regulates the JAK-STAT pathway [26], which is known to interact with gcm [27].
We then tested members of two TrxG complexes that specifically counteract Pc function. Trx is a SET-domain containing protein able to induce H3K4 methylation [28]. It has been purified as a subunit of the Drosophila COMPASS-like complex [29] and of the TAC1 complex that combines histone methylating and acetylating activities (reviewed in [30]). The trx null mutation acts as a suppressor of the gcmPyx phenotype (Figure 1G, 1I). Ash1 is a SET-domain protein reported to have histone methyltransferase activity [30]: its null mutation also suppresses the gcmPyx phenotype (Figure 1G, 1I). Finally, the Drosophila CREBS-binding protein (dCBP) encoded by nejire (nej) is responsible for H3K27 acetylation [31] and is associated with both TAC1 and ASH1 complexes. The nej null mutation suppresses the gcmPyx phenotype (Figure 1G, 1I). In conclusion, we found that mutations in TrxG proteins known to specifically counteract PcG function [12] act as suppressors of the gcmPyx phenotype, whereas TrxG members found in chromatin remodeling complexes that are involved in more general transcriptional regulation act as enhancers. We therefore tested members of the two PcG complexes, PRC1 (Pc) (three null alleles) and PRC2 ((esc), E(z)), as well as the PcG protein recruiter pipsqueak (psq). Mutations in all four genes enhance the gcmPyx phenotype (Figure 1H, 1I). Thus, PcG mutations act in the same way as mutations in the TrxG genes brm and osa, but have opposing effects compared to mutations in the TrxG genes Ash1, trx and nej. This suggests that a balanced action of these chromatin modifiers regulate gcm function.
In sum, the screen allowed the identification of several chromatin factors as gcm genetic interactors.
The Pc protein binds to the gcm promoter region
gcm was identified as a putative Pc target in genome-wide chromatin immunoprecipitation (ChIP) studies on Drosophila embryos and different cell lines [32]–[34], we therefore focused on this chromatin factor. As seen in Figure 2B, a Polycomb Response Element (PRE) is present around the transcription start sites (TSS) of gcm and gcm2, which are organized head to head in a 30 kb region [35]. PRC1 binding at the TSS is accompanied by the H3K27 methylation mark (H3K27me3), the profile of which is much broader, extending throughout the gcm-gcm2 5′ regulatory region. As expected, the profile of H3K4methylation complements that of H3K27me3 (Figure 2B). Pc binding was further validated and quantified by qChIP analysis on specific regions including the TSS region for each gene (gcm, gcm2), or an adjacent region (GlacAT) and a negative control (Rp49) (Figure 2A, 2B).

We then asked whether the upstream region of the gcm gene bound by PcG proteins is able to recruit PcG proteins in transgenic assays. For this, we examined PcG binding to a transgene containing the upstream region of the gcm locus on salivary gland chromosomes by Immuno-FISH experiments. Similar to the endogenous gcm locus, which associates with both Pc and Ph proteins (Figure 2E–2F′″), a transgene carrying a gcm construct including 9 kb from the promoter region (9 kb gcm) induces the recruitment of PcG proteins to an ectopic site (Figure 2B, 2G–2Hb′″). Interestingly, a transgene carrying a shorter construct (2 kb gcm) is not able to efficiently recruit PcG proteins (Figure 2B, Figure S3). Importantly, this shorter construct triggers very limited rescue when reintroduced in gcm mutant embryos, whereas the 9 kb gcm construct rescues the embryonic mutant phenotype almost completely [8], suggesting a correlation between Pc binding and transgene activity. Of note, the transgenes do not contain gcm2, excluding the requirement of a gene complex for Pc binding. Moreover, gcm2 plays a minor role in gliogenesis and its mutation is viable [35] allowing us to focus on gcm.
Finally, we tested the 9 kb construct for pairing sensitive silencing (PSS), as transgenes carrying PREs/TREs in Drosophila have been shown to share this property ([36], [37]). Transgenic flies carrying the mini-white gene typically have eye colors ranging from yellow to orange in a white mutant background. Normally, flies that are homozygous for such a transgene have a darker eye color than heterozygotes, as the genetic dose of mini-white is doubled. However, with transgenes carrying PRE/TREs, the eye color is similar in homozygotes and heterozygotes or even darker in the latter. This is what we also observed in our transgenic lines (Figure 2C–2D).
Altogether, these data indicate that the gcm promoter region contains a PRE and suggest that PcG proteins directly regulate gcm expression.
Reducing the dose of Pc rescues the gcm fate conversion phenotype
We next scored for Pc gcm interaction in a physiological asset, i.e., in loss of function conditions for both genes. The gcm-Gal4 line, an insertion in the gcm locus, is a hypomorphic semiviable allele in homozygous conditions and can be used to follow gcm activation and glial cells using a UAS-green fluorescent protein (GFP) line [38]–[40]. We analyzed the expression of GFP as well as that of an independent glial marker (Repo) and a neuronal marker (Elav) in homozygous gcm-Gal4,UAS-GFP (referred to as gcm-Gal4) animals and in homozygous gcm-Gal4 animals that are also heterozygous for Pc. As a control, we used heterozygous gcm-Gal4 animals.
The Drosophila wing contains two major nerves, L1 and L3, covered by glia that depend on gcm [41] (Figure 3A, 3B). Because of their simple organization, we focused on the L3 glia, which arise from three SOPs called L3-3, L3-1 and L3-v. Each SOP produces a sensory neuron and a glial precursor (GP) that proliferates and produces four to eight glia that are GFP+ (Figure 3C–3H).

gcm-Gal4 homozygous flies show the glia to neuron transformation observed in gcm null clones [41], albeit at much lower penetrance (Figure 3I–3M). To analyze the phenotype at single cell level, we followed glia from a specific lineage, the L3-v, at the time the GP is generated. At this stage, control L3-v lineages contain a GFP+ cell that expresses Repo and a neuron that expresses Elav (Figure 3S, 3T–3T″). In gcm-Gal4 homozygous animals, the GFP+ cell expresses Elav rather than Repo (9% penetrance) (Figure 3S, 3U–3U″). By 24 hr after puparium formation (APF), the number of GFP+ and Repo+ cells present in the control animals increases, whereas only one GFP+ cell is present in the transformed lineage, due to lack of proliferation, and this cell is a neuron (Figure 3C–3M). The penetrance of ectopic neurons does not decrease during development (16 and 18% by 20 and 24 hr APF, respectively, Figure 3S), indicating that low Gcm levels trigger a stable fate conversion; a similar phenotype was observed on L1 glia (Kumar and Giangrande, unpublished data).
Based on the genetic data, we then asked whether Pc downregulation rescues the phenotype of homozygous gcm-Gal4 wings. Indeed, no evidence of stable glia to neuron transformation was found in homozygous gcm-Gal4 wings that carry only one Pc functional allele (Figure 3N–3S). The phenotype was verified at early and at late stages of wing development, to exclude the possibility of unstable rescue. These data strongly suggest that Pc affects gcm expression in the gcm-Gal4 line.
Pc is required for gliogenesis
In order to extend the above findings, we analyzed late gliogenesis upon lowering the dose of Pc. Differentiated gcm-Gal4 homozygous wings carry fewer glia than wt wings in which the three glial precursors have divided more than once in most of the cases (Figure S4A, 24 hr APF wings). Given the low penetrance of the fate transformation phenotype, this suggests an additional, later, effect on the glial cell number. To clarify the nature of the phenotype we counted the Repo+ cells just after the first division of the three L3 GPs in gcm-Gal4 homozygous wings that showed no fate transformation. We could confirm a decreased number of cells (Figure 4B, 4E, S4B, 20 hr APF wings), complementing the finding that sustained gcm expression induces glial overproliferation (embryo: [11]; wing: Kumar and Giangrande, unpublished data). Of note, the gcm-Gal4/+ wings already show a minor but consistent defect as there are cases in which the three GPs have not proliferated yet, which does not occur in wild type wings of the same stage (Figure 4A and 4E, Figure S4B). Moreover, heterozygous wings show a high variance in the number of Repo+ cells. Finally, homozygous gcm-Gal4 wings expressing a single Pc show a higher number of glia compared to those found in homozygous gcm-Gal4 wings (Figure 4D and 4E, Figure S4B), confirming that Pc negatively controls Gcm. This was confirmed by the significant P values obtained with different robust non-parametric tests comparing the homozygous wings with the homozygous wings that carry one dose of Pc (Mann Whitney test P = 0,0127; Wilcoxon test P = 0,0122). Moreover, one-way Anova comparison of the three genotypes (gcm-Gal4/+, gcm-Gal4 and gcm-Gal4; Pc/+) also produces a significant value (0,0028). These data indicate a partial rescue of the gcm-Gal4 proliferation phenotype by Pc, the moderate difference likely depending on the fact that only one dose of Pc is deleted.

To understand the role of Pc in gliogenesis, we also analyzed Pc mutant animals in an otherwise wt background and asked whether the mutation affects the number of glia (Figure 4F–4H, Figure S4C 24 hr APF wings) and the frequency of glial dividing cells (Figure 4I). Since removing Pc completely leads to pleiotropic defects, we used heterozygous Pc animals and counted the number of Repo+ cells on the L1 nerve, which shows massive gliogenesis, compared to the sparse glial cells present on the L3 nerve [41]. While the number of Repo+ cells increases very moderately in Pc/+ compared to wt wings (P = 0,03), a stronger, significant, increase is observed in E(z)/+ wings (P = 0,0007), which have a compromised PRC2, and an even stronger phenotype is observed in double heterozygous Pc/E(z) animals (P = 3,9×10⁻⁶), which display compromised PRC2 and PRC1 (Figure 4F–4H, Figure S4C). Finally, we labeled wings with Repo and phospho-histone H3 (PH3) as a mitotic marker. By 24 hr APF, the Repo/PH3+ cells are very rare in wt wings (1 Repo-PH3+ cell in 1/11 wings) (Figure 4I). E(z)/+ or Pc/E(z) double heterozygous animals, which show the most significant increase in glial cell number, show a significant increase in the number of wings with proliferating glia, whereas Pc/+ animals, in which the increase in glial cell number very small, do not. Thus, PcG proteins likely synergize and affect both glial differentiation and proliferation.
Pc represses the maintenance of gcm expression
We next analyzed the role of Pc on the gcm expression profile. Positional cues first trigger initiation of transcription, then Gcm positively autoregulates [7] and, as the glial fate is established, gcm expression progressively decreases so that its transcripts are no longer present in mature glia [42]. We analyzed the initiation of gcm transcription in gcm-Gal4/+; Pc/+ wings. Previous analyses showed that the gcm RNA becomes detectable by 8–9 hr APF (Van de Bor and Giangrande, unpublished data). We therefore analyzed 7–8 hr APF wings and found that the GFP appears at the same time as in wt animals (data not shown). Since the binary Gal4 system may not faithfully reproduce the temporal pattern, we analyzed wings carrying one dose of Pc and the P-mediated insertional gcmrA87 allele expressing the LacZ reporter and confirmed that the β-Gal labeling starts as in wt animals (Figure S5). The finding that Pc does not affect initiation of gcm expression is in line with the wt number of GFP+ cells observed in homozygous gcm-Gal4 wings at early stages, even in cases in which glial cells convert into neurons.
We also performed in situ hybridization with a gcm-specific probe in Pc/+ wings. We took advantage of the supernumerary glia phenotype to see whether Pc helps repressing the maintenance of gcm expression. gcm transcripts are well visible on both wt and Pc/+ wings by 19 hr APF, a stage at which the glial precursors have differentiated (Figure 5A, 5D). By 24 hr APF, however, they are absent in wt, but still present in Pc/+ wings (Figure 5B, 5E), which correlates with the slight increase in glial number observed in Pc/+ animals. Interestingly, Pc/+ wings do not show gcm expression at ectopic positions, suggesting that the absence of Pc induces a failure in repressing gcm maintenance rather than a global loss of silencing in whole tissues.

We extended the data by analyzing other stages and tissues. In the brain, gcm is expressed in several cell populations: GPC and its glial progeny, lamina neurons, central brain neurons and medulla glia [39], [40], [43], [44]. We focused on gcm expression at the position of lamina glial precursors (GPCs), which produce numerous cells that migrate and form the glia of the lamina visual ganglion (Figure 5K) [39], [40], [43]. For the sake of simplicity, we analyzed the optic lobes at a stage at which gcm is detectable in the GPC area but just starts being expressed in the other regions. In wt animals, gcm expression fades away as glia differentiate and migrate (Figure 5G, 5K, 5L), whereas in Pc/+ animals gcm is expressed in an expanded area (Figure 5H, 5L). Moreover, gcm is overexpressed in brm/+ brains and this phenotype is suppressed in brm,trx/+ animals. This shows that brm acts similar to Pc on gcm expression, and both act antagonistically to trx, in line with the genetic data (Figure 5H–5J, 5L). All the phenotypes were quantified by comparing the intensity and the area of the gcm signal (see Text S1, Figure S4E). In the double mutant, the area of labeling resembles that observed in wt animals and the intensity of the signal is even lower than that observed in wt animals. Future analyses will determine whether the increase of gcm expression in the mutant backgrounds reflects longer perdurance in migrating glia, production of more glia or production of more glial progenitor cells in the larval lamina. In some preparations, labeling in other regions is also observed, depending on sample orientation. Even though we cannot formally exclude the possibility that this represents ectopic labeling, these regions correspond to the other positions at which gcm accumulates at slightly later stages in wild type animals, suggesting that in those regions as well Pc negatively controls gcm expression.
Finally, we analyzed gcm transcripts in Pc embryos. In wt animals, gcm is expressed at early stages of glial development and transcripts subsequently fade away, first in the ventral cord and then in the brain [42]. The most frequent phenotype of Pc mutant embryos is a persisting gcm expression in the brain, but we also found extreme cases of late gcm expression in the ventral cord (Figure 5C, 5F). The embryonic and the postembryonic brains contain too compact and numerous glia and the perdurance in the ventral cord is a rare event, likely due to the Pc maternal component.
Although these tissues/stages do not allow quantitative analyses of glial cells, the expression data and the wing phenotype strongly suggest that Pc represses gcm maintenance. Altogether, our observations highlight the importance of Pc in tightly regulating Gcm levels.
Pc represses gcm positive autoregulation and a downstream gcm target
To assess whether Pc directly represses gcm, we used in vivo and in vitro assays. Gcm directly and positively autoregulates and alteration of this feedback loop severely affects its gliogenic potential, providing further evidence for the importance of Gcm maintenance at a precise developmental time [7], [9]. In vivo autoregulation can be documented in gain of function experiments by using the gcmrA87 allele. We asked whether Pc negatively controls Gcm autoregulation by comparing animals that simultaneously overexpress Gcm and Pc to control animals that only overexpress Gcm. Compared to controls, Pc and Gcm cooverexpressing embryos show a drastic reduction in the number of β-Gal+ cells as well in the intensity of β-Gal labeling (Figure 6A, 6C). Accordingly, co-overexpression reduces the number of ectopic glia as assessed by the Repo marker (Figure 6D, 6F, 6G, 6I). Moreover, and in line with these results, overexpressing Gcm in Pc loss of function embryos triggers a significant increase in the number of autoregulating cells compared to that observed in control animals (Figure 6A, 6B). Accordingly, these animals show an increased number of ectopic Repo+ cells (Figure 6D, 6E, 6G, 6H). These data were quantified upon counting the number of β-Gal+ and Repo+ cells (Figure 6J). Loss and gain of function of Pc do not, on their own, alter the expression of the Repo marker (Figure S6).

To evaluate whether the inhibitory effects of Pc in the Gcm pathway are direct, we used transactivation assays in which we transfected S2 cells with a Gcm expression vector and a reporter of its activity in presence or in absence of a Pc expression vector.
We first analyzed the repo promoter, a major direct Gcm target that contains several Glide Binding Sites (GBSs) [45] (Figure S7D). This promoter is inactive in S2 cells, but Gcm expression is sufficient to activate it. Upon cotransfection with Gcm and Pc expression vectors, however, the transactivation induced by Gcm decreases significantly (Figure S7C, S7D). We repeated the same type of assay using a second, transiently expressed, promoter depending on gcm. The gcm2 2 kb proximal promoter contains four GBSs and was previously shown to be activated by Gcm in transfection assays [35] (Figure 6K, 6L), more robustly than the gcm 2 kb promoter itself, which only contains one GBS. As for repo, the cotransfection with Gcm and Pc reduces the activation of the gcm2 promoter. Thus, Pc represses the expression of Gcm stably and transiently expressed targets.
In sum, the above data support the hypothesis that Pc represses gcm autoregulation and Gcm downstream targets, thereby inhibiting glial development.
Discussion
Cell fate determination and maintenance require pathways that finely modulate gene expression and hence ensure the proper balance of cell types in metazoa. The pleiotropic and genome-wide effects of such pathways still hamper clear understanding of their impact and mode of action at single cell level. Our screen and genetic analyses in the Drosophila model unveil the role of the Polycomb chromatin modifier in the generation of glial cells upon fine modulation of the transiently expressed fate determinant gcm.
A genetic screen that identifies novel gcm interactors
The genetic screen over a sensitized background proved to be an extremely sensitive tool, as it allowed us to identify several genes that in heterozygous conditions are able to modify the strong dominant gcmPyx phenotype. The screen also provided hints onto the function of the interactors, suppressors or enhancers of a given phenotype. For example, sna and esg act as gcmPyx suppressors, in line with the fact that gcmPyx triggers the expression of NB-specific genes [20]. Identifying an interactor provided an entry point to find members of the same pathway that were initially underscored because located in deficiencies with moderate phenotypes (perhaps due to the presence of genes with opposite effects) or in regions that were not covered by the deficiencies. In the first case is Pc, in the second are osa and Ash1 (Figure S2). The screen also identified members of other signaling pathways (Table 1, Figure S2). One of them depends on Notch (N), which controls gcm expression [20]. While the used Deficiency kit does not cover N itself, we identified Suppressor of Hairless (Su(H)), which regulates the transcription of the N targets, and Lethal (2) giant disc 1, which negatively regulates N receptor trafficking ([46] and references therein). We also tested and validated the genetic interaction with other members of the cascade, including N, its ligand Delta, one of its targets, Enhancer of split, and Groucho, a transcriptional repressor and a partner of Su(H). Future studies will dissect the role of this and of the other pathways on the Gcm cascade.
gcm genetically interacts with TrxG proteins
Several TrxG proteins act as genetic modifiers of the gcmPyx phenotype. TrxG proteins were initially identified as positive regulators of HOX genes and considered as PcG counteractors. In recent years, however, it has become evident that they have a much wider role in gene regulation and it is unclear whether they mainly antagonize PcG functions or whether they globally control gene expression [12]. Interestingly, the three TrxG proteins that behave as positive regulators, Trx, Ash1 and dCBP, are found in TAC and ASH1 complexes that contain a histone acetylation activity. The dCBP histone acetyltransferase present in these complexes acetylates H3K27, a modification that is associated with PcG target genes when they are active [34]. This modification is incompatible with Pc dependent H3K27me3, as these modifications occur on the same amino acid. Thus, Trx - and Ash1-associated dCBP might be a key player in counteracting PcG-dependent silencing of the gcm gene [31]. Future studies will address the role of dCBP onto the Gcm cascade.
osa and brm act as negative regulators of gcm. TrxG proteins can form different complexes that have distinct properties and in some instances repress gene expression. For example, Trx and Brm, which belong to different molecular complexes [30], act positively on the HOX genes and influence a homeotic transformation phenotype in the same way [47], however, Brm-containing complexes mediate transcriptional repression of genes other than the HOX genes [48]. The emerging view is that the SWI/SNF TrxG proteins act as transcriptional activators or repressors depending on the temporal and spatial context [49]. Further studies will determine whether the TrxG proteins acting as negative regulators of gcm directly repress its expression or induce a gcm repressor.
Pc modulates the transient expression of the fate determinant gcm
PcG proteins repress homeotic genes to ensure the maintenance of transcriptional states and provide a cellular memory that is transmitted upon cell division, in contrast, their mode of action in the control of more dynamic processes remains elusive. We show in vivo that members of the PcG negatively regulate the gcm pathway during glial fate establishment and proliferation. At least in the first step, a process based on cell memory can be excluded, as Pc acts prior to the division of the GP, the cell in which gcm starts being expressed [41].
The qChIP assay as well as the expression, the S2 cell transfection and the autoregulation data strongly suggest that Pc directly represses gcm transcription maintenance. In addition, the phenotypes observed upon changing the relative gene dosage indicate that Pc and gcm need to be present in appropriate amounts. The importance of an adequate balance between positive (Gcm) and negative (Pc) factors in the establishment of the glial fate is also provided by a rare phenotype observed in a gcm-Gal4; Pc/+ background (1/17 wings) in which the GFP+ cell expresses Repo and Elav, indicating an intermediate glial/neuronal state (Figure 3V–3V″). Thus, Pc acts by finely tuning a transiently expressed fate determinant.
We speculate that the role and the mode of action of chromatin factors depend on the target. HOX promoters, which require to stay in an ON or OFF state, may involve strong binding/high accumulation of chromatin regulators and several studies have already shown that HOX activators drastically reduce K27me3 and also PcG protein binding (Figure 7A) [34], [50], [51]. More dynamically expressed genes may involve less strong binding, a configuration that allows modulation of gene expression. From a mechanistic point of view, as the activator of the transiently expressed genes disappears, PcG proteins may gradually bind and turn these genes OFF (Figure 7B) although we cannot formally exclude that PcG proteins may simply provide a constant repressive background as a threshold for activation (Figure 7C).

In line with these hypotheses, HOX and Gcm display different behaviors. A fragment of 219bp from Fab7, the classical PRE described on a HOX promoter, is sufficient to recruit PcG proteins on salivary glands [52], whereas a 2 kb gcm carrying the PRE seems very inefficient. In addition, the intensity of Pc, Ph and ‘recruiters’ peaks onto the gcm promoter is very low, definitely weaker compared to those found on the classical HOX PRE (Figure S8). Finally, the heterozygous Pc/+ mutation only temporarily prolongs gcm expression (Figure S5I), whereas it produces a long lasting HOX-dependent phenotype [53], [54].
Understanding the precise molecular events will require the development of new tools and the in vivo analysis of chromatin organization at the level of specific cell types or in single cells. Our data nevertheless clearly show that Gcm and Pc compete with each other: PcG proteins bind gcm genes as well as repo (Figure 2, Figure S7, Figure S8) [33] and counteract Gcm activity. We therefore speculate that Gcm displaces Pc from its target promoters, including itself, which would explain how a general chromatin regulator impinges onto a cell-specific transcriptional program. In mammals as well it has been suggested that cell fate transcription factors play a role in PcG recruitment and displacement and some of them were shown to be PcG targets ([55] and reference therein). Finally, 63 genes are common Pc and Gcm targets, as revealed by analyzing the Pc binding sites in embryos and in cell lines (from [33] and [34]) and the genes positively regulated by Gcm identified by microarray (from [23]). Clearly, genome-wide screens for direct Gcm targets will be necessary to support the hypothesis of Pc displacement. These studies will also assess whether the impact of the PRCs on glial proliferation is direct or mediated by Gcm.
Pc represses gliogenesis
The rescue of the gcm-dependent phenotype upon Pc downregulation indicates a role for this chromatin factor in glial repression. Interestingly, upregulating or downregulating Pc does not per se produce the opposite fate transformation (Figure S4D), whereas it does modify the number of glia, showing that distinct protein levels are required in different processes. In vertebrates, the PRC2 is also involved in the production of glial cells, which differentiate after a wave of neurogenesis. However, different results were obtained depending on the experimental asset. Livesey and collaborators ([56]) deleted Ezh2 constitutively, thereby altering the balance between self-renewal and differentiation, and found precocious astrocyte differentiation. In contrast, Gotoh and collaborators [57] used a conditional Ezh2 knockout and documented a decrease in astrocyte differentiation. In the first case, the authors speculated that the altered timing of neurogenesis and accelerated onset of gliogenesis are secondary to the primary function of PRC2 in cortical progenitor cells. In the second report, it was shown that Ezh2 represses Neurogenin1, which controls timing during corticogenesis and therefore the relative production of neurons and glia. While these studies indicate the importance of chromatin modifiers in the nervous system, they do not clarify the role of PRCs in gliogenesis. In our study, the combined use of sensitive tools demonstrates that the Pc chromatin factor directly inhibits gliogenesis and identifies gcm as a major target in the pathway. First, we used sensitized backgrounds rather than total knockouts, which makes it possible to score for subtle phenotypes. Second, we analyzed the mutants at the single cell resolution and therefore scored for direct, cell autonomous, effects of the Pc mutation. Third, we analyzed a gene that plays an instructive role rather than simply being permissive for gliogenesis. Fourth, gcm carries a functional PRE and competes with Pc on its targets. Altogether, these findings reinforce the view that distinct chromatin states characterize specific cell fates, as also illustrated by the low levels of histone acetylation observed in both fly and vertebrate glia [6], [58].
Materials and Methods
Drosophila stocks and crosses
Flies were grown on standard cornmeal/molasses medium at 25°C. The deficiency kit was obtained from the Bloomington Stock Center (Bloomington, IN), see Supplementary Material and Methods.
Bristle phenotype analysis
For the qualitative screen: for each cross (180 deficiencies), double heterozygous females carrying the gcmPyx allele and a deficiency were scored for the supernumerary bristle phenotype and compared to sibling females carrying the gcmPyx allele and the balancer from the deficiency stock. This allowed us to classify each deficiency as gcmPyx modifier or not modifier (Figure S1Aa). 75 deficiencies covering 42 genomic regions were selected for quantitative analyses (Figure S1Ab); for each genotype we counted the bristles from 10–80 heminota. The flow chart in Figure S1A shows the details of the screen. Average values +/ − SEM were calculated and, for genotype comparisons, the statistical significance was estimated by t-test.
To overexpress esg or osa, respectively, w; EP(2)0684/CyO or w; P{w[+mC] = UAS-osa}s2/CyO females were crossed with w; gcmPyx/Sp; hs-Gal4/Sb males. A 30 minute heat-shock pulse on 2nd instar larvae was performed at 37°C.
qChIP
qChIP was performed as in [33]. Primers are listed in Figure S3A.
Immunolabeling and in situ hybridization
these assays were performed as in [41] and [44]. For the antibody list as well as for the protocol of wing and embryo mounting and analysis by confocal microscopy, see Text S1. Repo and β-Gal positive cells from embryonic VC were subjected to quantification in 3D image using Imaris 7.2 software. Masks were generated as a region of interest for three thoracic segments along the z-stack, then volume image was visualized and the “crop 3D” function was applied to isolate the region of interest. Voxels (volume picture element) corresponding to cells were identified based on size and intensity. Then automatic voxel (cell) counting was performed in the region of interest. t-test was used to quantify the difference between genotypes. For immuno-FISH staining on polytene chromosomes [59], three consequent probes covering around 3 kb around gcm TSS were used, see Figure S3. Unless specified, all quantitative analyses used the t-test.
Cell transfection and reporter activation assay
The gcm2 promoter construct is pBLCAT6-1.96 from [35]. The 4,3 kb of the repo promoter [45] was cloned into the pRed H-Stinger vector (Berzsenyi and Giangrande, unpublished data). pPAC-gcm is described in [7]. UAS-gcm is described in [42]. pPAC-Pc and UAS-Pc were obtained by cloning the entire Pc cDNA in backbone vectors. pPAC-lacZ was a gift from T. Cook. Transient transfection of Drosophila S2 cells [60] was performed using Effectene (Qiagen) according to the manufacturer's instructions using 3 µg of total DNA. For CAT assay to evaluate the activation of the 2 kb gcm2 reporter construct (pBLCAT6-1.96), cells were harvested 48 hr after transfection and normalized for ß-Gal activity. CAT levels were determined using the CAT ELISA kit (Roche). For repoRFP, images of cells were acquired 48 hr after transfection, and the green (UAS-GFP)/red (repoRFP) cells, were quantified automatically using the ImageJ software.
Supporting Information
Zdroje
1. HosoyaT, TakizawaK, NittaK, HottaY (1995) glial cells missing: a binary switch between neuronal and glial determination in Drosophila. Cell 82 : 1025–1036.
2. JonesBW, FetterRD, TearG, GoodmanCS (1995) glial cells missing: a genetic switch that controls glial versus neuronal fate. Cell 82 : 1013–1023.
3. VincentS, VoneschJL, GiangrandeA (1996) Glide directs glial fate commitment and cell fate switch between neurones and glia. Development 122 : 131–139.
4. Akiyama-OdaY, HosoyaT, HottaY (1998) Alteration of cell fate by ectopic expression of Drosophila glial cells missing in non-neural cells. Dev Genes Evol 208 : 578–585.
5. BernardoniR, MillerAA, GiangrandeA (1998) Glial differentiation does not require a neural ground state. Development 125 : 3189–3200.
6. FliciH, ErkosarB, KomonyiO, KaratasOF, LaneveP, et al. (2011) Gcm/Glide-dependent conversion into glia depends on neural stem cell age, but not on division, triggering a chromatin signature that is conserved in vertebrate glia. Development 138 : 4167–4178.
7. MillerAA, BernardoniR, GiangrandeA (1998) Positive autoregulation of the glial promoting factor glide/gcm. Embo J 17 : 6316–6326.
8. RagoneG, Van De BorV, SorrentinoS, KammererM, GalyA, et al. (2003) Transcriptional regulation of glial cell specification. Dev Biol 255 : 138–150.
9. De IacoR, SoustelleL, KammererM, SorrentinoS, JacquesC, et al. (2006) Huckebein-mediated autoregulation of Glide/Gcm triggers glia specification. Embo J 25 : 244–254.
10. SoustelleL, RoyN, RagoneG, GiangrandeA (2008) Control of gcm RNA stability is necessary for proper glial cell fate acquisition. Mol Cell Neurosci 37 : 657–662.
11. HoMS, ChenH, ChenM, JacquesC, GiangrandeA, et al. (2009) Gcm protein degradation suppresses proliferation of glial progenitors. Proc Natl Acad Sci U S A 106 : 6778–6783.
12. SchuettengruberB, MartinezAM, IovinoN, CavalliG (2011) Trithorax group proteins: switching genes on and keeping them active. Nat Rev Mol Cell Biol 12 : 799–814.
13. RingroseL, ParoR (2007) Polycomb/Trithorax response elements and epigenetic memory of cell identity. Development 134 : 223–232.
14. SchuettengruberB, ChourroutD, VervoortM, LeblancB, CavalliG (2007) Genome regulation by polycomb and trithorax proteins. Cell 128 : 735–745.
15. SchuettengruberB, CavalliG (2009) Recruitment of polycomb group complexes and their role in the dynamic regulation of cell fate choice. Development 136 : 3531–3542.
16. KharchenkoPV, AlekseyenkoAA, SchwartzYB, MinodaA, RiddleNC, et al. (2010) Comprehensive analysis of the chromatin landscape in Drosophila melanogaster. Nature 471 : 480–485.
17. EnderleD, BeiselC, StadlerMB, GerstungM, AthriP, et al. (2011) Polycomb preferentially targets stalled promoters of coding and noncoding transcripts. Genome Res 21 : 216–226.
18. BrookesE, de SantiagoI, HebenstreitD, MorrisKJ, CarrollT, et al. (2012) Polycomb Associates Genome-wide with a Specific RNA Polymerase II Variant, and Regulates Metabolic Genes in ESCs. Cell Stem Cell 10 : 157–170.
19. ToumaJJ, WeckerleFF, ClearyMD (2012) Drosophila Polycomb complexes restrict neuroblast competence to generate motoneurons. Development 139 : 657–666.
20. Van De BorV, HeitzlerP, LegerS, PlessyC, GiangrandeA (2002) Precocious expression of the Glide/Gcm glial-promoting factor in Drosophila induces neurogenesis. Genetics 160 : 1095–1106.
21. DominguezM, CampuzanoS (1993) asense, a member of the Drosophila achaete-scute complex, is a proneural and neural differentiation gene. Embo J 12 : 2049–2060.
22. BrandM, JarmanAP, JanLY, JanYN (1993) asense is a Drosophila neural precursor gene and is capable of initiating sense organ formation. Development 119 : 1–17.
23. AltenheinB, BeckerA, BusoldC, BeckmannB, HoheiselJD, et al. (2006) Expression profiling of glial genes during Drosophila embryogenesis. Dev Biol 296 : 545–560.
24. PapoulasO, BeekSJ, MoseleySL, McCallumCM, SarteM, et al. (1998) The Drosophila trithorax group proteins BRM, ASH1 and ASH2 are subunits of distinct protein complexes. Development 125 : 3955–3966.
25. CollinsRT, FurukawaT, TaneseN, TreismanJE (1999) Osa associates with the Brahma chromatin remodeling complex and promotes the activation of some target genes. Embo J 18 : 7029–7040.
26. BadenhorstP, VoasM, RebayI, WuC (2002) Biological functions of the ISWI chromatin remodeling complex NURF. Genes Dev 16 : 3186–3198.
27. JacquesC, SoustelleL, NagyI, DieboldC, GiangrandeA (2009) A novel role of the glial fate determinant glial cells missing in hematopoiesis. Int J Dev Biol 53 : 1013–1022.
28. CzerminB, MelfiR, McCabeD, SeitzV, ImhofA, et al. (2002) Drosophila enhancer of Zeste/ESC complexes have a histone H3 methyltransferase activity that marks chromosomal Polycomb sites. Cell 111 : 185–196.
29. MohanM, HerzHM, SmithER, ZhangY, JacksonJ, et al. The COMPASS family of H3K4 methylases in Drosophila. Mol Cell Biol 31 : 4310–4318.
30. GrimaudC, NegreN, CavalliG (2006) From genetics to epigenetics: the tale of Polycomb group and trithorax group genes. Chromosome Res 14 : 363–375.
31. TieF, BanerjeeR, StrattonCA, Prasad-SinhaJ, StepanikV, et al. (2009) CBP-mediated acetylation of histone H3 lysine 27 antagonizes Drosophila Polycomb silencing. Development 136 : 3131–3141.
32. KwongC, AdryanB, BellI, MeadowsL, RussellS, et al. (2008) Stability and dynamics of polycomb target sites in Drosophila development. PLoS Genet 4: e1000178 doi:10.1371/journal.pgen.1000178.
33. SchuettengruberB, GanapathiM, LeblancB, PortosoM, JaschekR, et al. (2009) Functional anatomy of polycomb and trithorax chromatin landscapes in Drosophila embryos. PLoS Biol 7: e13 doi:10.1371/journal.pbio.1000013..
34. SchwartzYB, KahnTG, StenbergP, OhnoK, BourgonR, et al. (2010) Alternative epigenetic chromatin states of polycomb target genes. PLoS Genet 6: e1000805 doi:10.1371/journal.pgen.1000805..
35. KammererM, GiangrandeA (2001) Glide2, a second glial promoting factor in Drosophila melanogaster. Embo J 20 : 4664–4673.
36. GindhartJGJr, KaufmanTC (1995) Identification of Polycomb and trithorax group responsive elements in the regulatory region of the Drosophila homeotic gene Sex combs reduced. Genetics 139 : 797–814.
37. KassisJA (2002) Pairing-sensitive silencing, polycomb group response elements, and transposon homing in Drosophila. Adv Genet 46 : 421–438.
38. PaladiM, TepassU (2004) Function of Rho GTPases in embryonic blood cell migration in Drosophila. J Cell Sci 117 : 6313–6326.
39. SoustelleL, TrousseF, JacquesC, CeronJ, CochardP, et al. (2007) Neurogenic role of Gcm transcription factors is conserved in chicken spinal cord. Development 134 : 625–634.
40. SoustelleL, GiangrandeA (2007) Glial differentiation and the Gcm pathway. Neuron Glia Biol 3 : 5–16.
41. Van De BorV, WaltherR, GiangrandeA (2000) Some fly sensory organs are gliogenic and require glide/gcm in a precursor that divides symmetrically and produces glial cells. Development 127 : 3735–3743.
42. BernardoniR, VivancosV, GiangrandeA (1997) glide/gcm is expressed and required in the scavenger cell lineage. Dev Biol 191 : 118–130.
43. ChotardC, LeungW, SaleckerI (2005) glial cells missing and gcm2 cell autonomously regulate both glial and neuronal development in the visual system of Drosophila. Neuron 48 : 237–251.
44. SoustelleL, GiangrandeA (2007) Novel gcm-dependent lineages in the postembryonic nervous system of Drosophila melanogaster. Dev Dyn 236 : 2101–2108.
45. AkiyamaY, HosoyaT, PooleAM, HottaY (1996) The gcm-motif: a novel DNA-binding motif conserved in Drosophila and mammals. Proc Natl Acad Sci U S A 93 : 14912–14916.
46. AnderssonER, SandbergR, LendahlU (2011) Notch signaling: simplicity in design, versatility in function. Development 138 : 3593–3612.
47. TamkunJW, DeuringR, ScottMP, KissingerM, PattatucciAM, et al. (1992) brahma: a regulator of Drosophila homeotic genes structurally related to the yeast transcriptional activator SNF2/SWI2. Cell 68 : 561–572.
48. CollinsRT, TreismanJE (2000) Osa-containing Brahma chromatin remodeling complexes are required for the repression of wingless target genes. Genes Dev 14 : 3140–3152.
49. MarendaDR, ZralyCB, DingwallAK (2004) The Drosophila Brahma (SWI/SNF) chromatin remodeling complex exhibits cell-type specific activation and repression functions. Dev Biol 267 : 279–293.
50. BreilingA, O'NeillLP, D'EliseoD, TurnerBM, OrlandoV (2004) Epigenome changes in active and inactive polycomb-group-controlled regions. EMBO Rep 5 : 976–982.
51. PappB, MullerJ (2006) Histone trimethylation and the maintenance of transcriptional ON and OFF states by trxG and PcG proteins. Genes Dev 20 : 2041–2054.
52. DejardinJ, RappaillesA, CuvierO, GrimaudC, DecovilleM, et al. (2005) Recruitment of Drosophila Polycomb group proteins to chromatin by DSP1. Nature 434 : 533–538.
53. CabreraCV, BotasJ, Garcia-BellidoA (1985) Distribution of Ultrabithorax proteins in mutants of Drosophila bithorax complex and its transregulatory genes. Nature 318 : 569.
54. BusturiaA, LloydA, BejaranoF, ZavortinkM, XinH, et al. (2001) The MCP silencer of the Drosophila Abd-B gene requires both Pleiohomeotic and GAGA factor for the maintenance of repression. Development 128 : 2163–2173.
55. BrackenAP, HelinK (2009) Polycomb group proteins: navigators of lineage pathways led astray in cancer. Nat Rev Cancer 9 : 773–784.
56. PereiraJD, SansomSN, SmithJ, DobeneckerMW, TarakhovskyA, et al. (2010) Ezh2, the histone methyltransferase of PRC2, regulates the balance between self-renewal and differentiation in the cerebral cortex. Proc Natl Acad Sci U S A 107 : 15957–15962.
57. HirabayashiY, SuzkiN, TsuboiM, EndoTA, ToyodaT, et al. (2009) Polycomb limits the neurogenic competence of neural precursor cells to promote astrogenic fate transition. Neuron 63 : 600–613.
58. LiuJ, CasacciaP (2010) Epigenetic regulation of oligodendrocyte identity. Trends Neurosci 33 : 193–201.
59. LavrovS, DejardinJ, CavalliG (2004) Combined immunostaining and FISH analysis of polytene chromosomes. Methods Mol Biol 247 : 289–303.
60. SchneiderI (1972) Cell lines derived from late embryonic stages of Drosophila melanogaster. J Embryol Exp Morphol 27 : 353–365.
Štítky
Genetika Reprodukční medicínaČlánek vyšel v časopise
PLOS Genetics
2012 Číslo 12
Nejčtenější v tomto čísle
- Population Genomics of Sub-Saharan : African Diversity and Non-African Admixture
- Dnmt3a Protects Active Chromosome Domains against Cancer-Associated Hypomethylation
- Excessive Astrocyte-Derived Neurotrophin-3 Contributes to the Abnormal Neuronal Dendritic Development in a Mouse Model of Fragile X Syndrome
- Pre-Disposition and Epigenetics Govern Variation in Bacterial Survival upon Stress