
Identification of , a Locus Controlling Dominant Resistance to Autoimmune Orchitis, as Kinesin Family Member 1C
Experimental autoimmune orchitis (EAO), the principal model of non-infectious testicular inflammatory disease, can be induced in susceptible mouse strains by immunization with autologous testicular homogenate and appropriate adjuvants. As previously established, the genome of DBA/2J mice encodes genes that are capable of conferring dominant resistance to EAO, while the genome of BALB/cByJ mice does not and they are therefore susceptible to EAO. In a genome scan, we previously identified Orch3 as the major quantitative trait locus controlling dominant resistance to EAO and mapped it to chromosome 11. Here, by utilizing a forward genetic approach, we identified kinesin family member 1C (Kif1c) as a positional candidate for Orch3 and, using a transgenic approach, demonstrated that Kif1c is Orch3. Mechanistically, we showed that the resistant Kif1cD2 allele leads to a reduced antigen-specific T cell proliferative response as a consequence of decreased MHC class II expression by antigen presenting cells, and that the L578→P578 and S1027→P1027 polymorphisms distinguishing the BALB/cByJ and DBA/2J alleles, respectively, can play a role in transcriptional regulation. These findings may provide mechanistic insight into how polymorphism in other kinesins such as KIF21B and KIF5A influence susceptibility and resistance to human autoimmune diseases.
Published in the journal:
. PLoS Genet 8(12): e32767. doi:10.1371/journal.pgen.1003140
Category:
Research Article
doi:
https://doi.org/10.1371/journal.pgen.1003140
Summary
Experimental autoimmune orchitis (EAO), the principal model of non-infectious testicular inflammatory disease, can be induced in susceptible mouse strains by immunization with autologous testicular homogenate and appropriate adjuvants. As previously established, the genome of DBA/2J mice encodes genes that are capable of conferring dominant resistance to EAO, while the genome of BALB/cByJ mice does not and they are therefore susceptible to EAO. In a genome scan, we previously identified Orch3 as the major quantitative trait locus controlling dominant resistance to EAO and mapped it to chromosome 11. Here, by utilizing a forward genetic approach, we identified kinesin family member 1C (Kif1c) as a positional candidate for Orch3 and, using a transgenic approach, demonstrated that Kif1c is Orch3. Mechanistically, we showed that the resistant Kif1cD2 allele leads to a reduced antigen-specific T cell proliferative response as a consequence of decreased MHC class II expression by antigen presenting cells, and that the L578→P578 and S1027→P1027 polymorphisms distinguishing the BALB/cByJ and DBA/2J alleles, respectively, can play a role in transcriptional regulation. These findings may provide mechanistic insight into how polymorphism in other kinesins such as KIF21B and KIF5A influence susceptibility and resistance to human autoimmune diseases.
Introduction
Experimental autoimmune orchitis (EAO) is a model of idiopathic male infertility mediated by autoreactive T cells [1], [2]. It can be induced in mice by active immunization with mouse testicular homogenate (TH) emulsified in complete Freund's adjuvant (CFA) and Bordetella pertussis toxin (PTX) [3]. In genetically susceptible mice, the inflammatory lesions comprised of monocytes, macrophages, lymphocytes, neutrophils, and eosinophils are mainly found in the seminiferous tubules of the testes in association with aspermatogenesis [3]. We previously have shown that MHC class II restricted CD4+ T cells are the primary effectors in autoimmune orchitis [4], [5]. However, recent evidence suggests the involvement of CD8+ T cells during the onset and maintenance of chronic inflammation [6], [7].
Various strains of inbred mice respond differently to EAO induction, indicating that susceptibility is genetically controlled. Previously, it was shown that BALB/cByJ (CByJ) mice are highly susceptible to EAO [8] whereas DBA/2J (D2) and (CByJ×D2)F1 hybrids (CD2F1) are resistant [3], [9]. This demonstrates that resistance to EAO is inherited as a dominant phenotype in this strain combination. Additionally, resistance can be adoptively transferred to CByJ mice with CD2F1 primed splenocytes [10]. Therefore, the factors that regulate EAO resistance appear to be governed by an immune-mediated dominant negative mechanism.
Genome exclusion mapping was utilized to map the immunosuppressive genes regulating dominant resistance to EAO [10] with significant linkages to multiple loci residing on chromosomes (Chr) 1 and 11 [10]. Of these, Orch3 on Chr11 displayed the most significant linkage and accounted for the majority of disease resistance seen in D2 mice.
In this study, congenic mapping was employed to restrict Orch3 to a ∼1.3 Mb interval that identified Kif1c (kinesin family member 1c) as a positional candidate. By generating CByJ.CD11B-Kif1cD2 transgenic (Tg) mice, we demonstrated that Kif1c underlies Orch3. Mechanistically, we showed that the resistant Kif1cD2 allele leads to reduced antigen (Ag)-specific T cell responsiveness as a consequence of decreased MHC class II expression by myeloid cells, and that the L578→P578 and S1027→P1027 polymorphisms distinguishing the CByJ and D2 alleles, respectively, can play a role in regulating gene transcription.
Results
Congenic mapping of Orch3
In the genome scan in which Orch3 was identified, D11Mit219, D11Mit8, and D11Mit118 exhibited the most significant linkage [10]. As the first step in the positional-candidate gene cloning of Orch3, we used marker-assisted selection to introgress the Orch3D2 allele onto the susceptible CByJ background. Next, we generated overlapping interval specific recombinant congenic (ISRC) lines (Figure S1 and Figure S2) and studied them in a stepwise fashion for susceptibility and resistance to EAO (Figure 1). Importantly, since resistance to EAO is inherited as a dominant trait in CD2F1 hybrid mice [10], and the pathology indices (PI) between heterozygous and homozygous congenic lines were not significantly different (data not shown), the data were pooled for each line. Control parental CByJ mice were clearly susceptible to EAO, with an average PI of 4.0, whereas D2 and CD2F1 hybrid mice were resistant, with an average PI of 0.1 and 0.8, respectively (Figure 2). C.D2-Es3/Hba, C.D2-3.1, C.D2-5, C.D2-8.4, C.D2-8.5, and C.D2-9 mice were also susceptible with average scores of 3.6, 4.9, 2.6, 3.7, 3.8, and 4.0, respectively. In contrast, C.D2-Evi2, C.D2-3, C.D2-3.2, C.D2-8 and C.D2-8.1 thru -8.3 were resistant with average scores of 0.2, 0.6, 1.3, 1.7, and ≤1.4, respectively.


These data placed Orch3 within the interval between D11Mit298 (69339966–69340164) and NLR (nucleotide-binding domain and leucine rich repeat containing) family, pyrin domain containing 1A, B, C (Nlrp1a/b/c) at 70.9–71.0 Mb (70904699–71098734 bp). Importantly, this excluded transient receptor potential cation channel, subfamily V, member 1 (Trpv1) at 73.0 Mb (73047794–73074744) underlying Idd4.1, a quantitative trait loci (QTL) controlling susceptibility to type 1 diabetes in the NOD mouse [11], and inducible nitric oxide synthase (Nos2/iNos), important in inflammatory diseases including autoimmunity [12], [13], as candidate genes for Orch3. Nlrp1a/b/c is one of two highly polymorphic positional candidate loci of immunological relevance within the interval, the second gene being kinesin family member 1C (Kif1c). However, Nlrp1c could be excluded as a candidate since it is a pseudogene (www.informatics.jax.org) and Nlrp1a and -b are less likely to be relevant to Orch3 than Kif1c due to discordance between EAO susceptibility and Nlrp1a and -b alleles among CByJ, BALB/cJ and D2 mice (www.informatics.jax.org) [14].
CByJ.CD11B-Kif1cD2 Tg (Tg-Kif1cD2) mice are resistant to EAO
To confirm that Kif1c was the most likely candidate gene for Orch3 and to definitively exclude Nlrp1a/b as a positional candidate, we generated overlapping sub-ISRC congenic lines across the C.D2-3.2 interval and studied them for susceptibility to EAO (Figure 3). Statistically significant differences in EAO susceptibility between C.D2-3.2, C.D2-3.2c and CByJ mice were observed (Figure 3, right panel). In contrast, the severity of EAO in C.D2-3.2a and C.D2-3.2b was not significantly different from that of CByJ mice. Moreover, dominant resistance co-segregated with Orch3 as evidenced by the fact that no significant difference in the PI between homozygous and heterozygous mice was detected across all congenic lines studied (Figure 2 and Figure 3). Taken together, these data restrict Orch3 to a ∼1.3 Mb interval distal of D11Mit298 (69339966–69340164) and proximal of D11Die30 (70552627–70552762) which includes Kif1c but not Nlrp1a and Nlrp1b (Figure 3, left panel), thereby excluding them as positional candidates for Orch3.

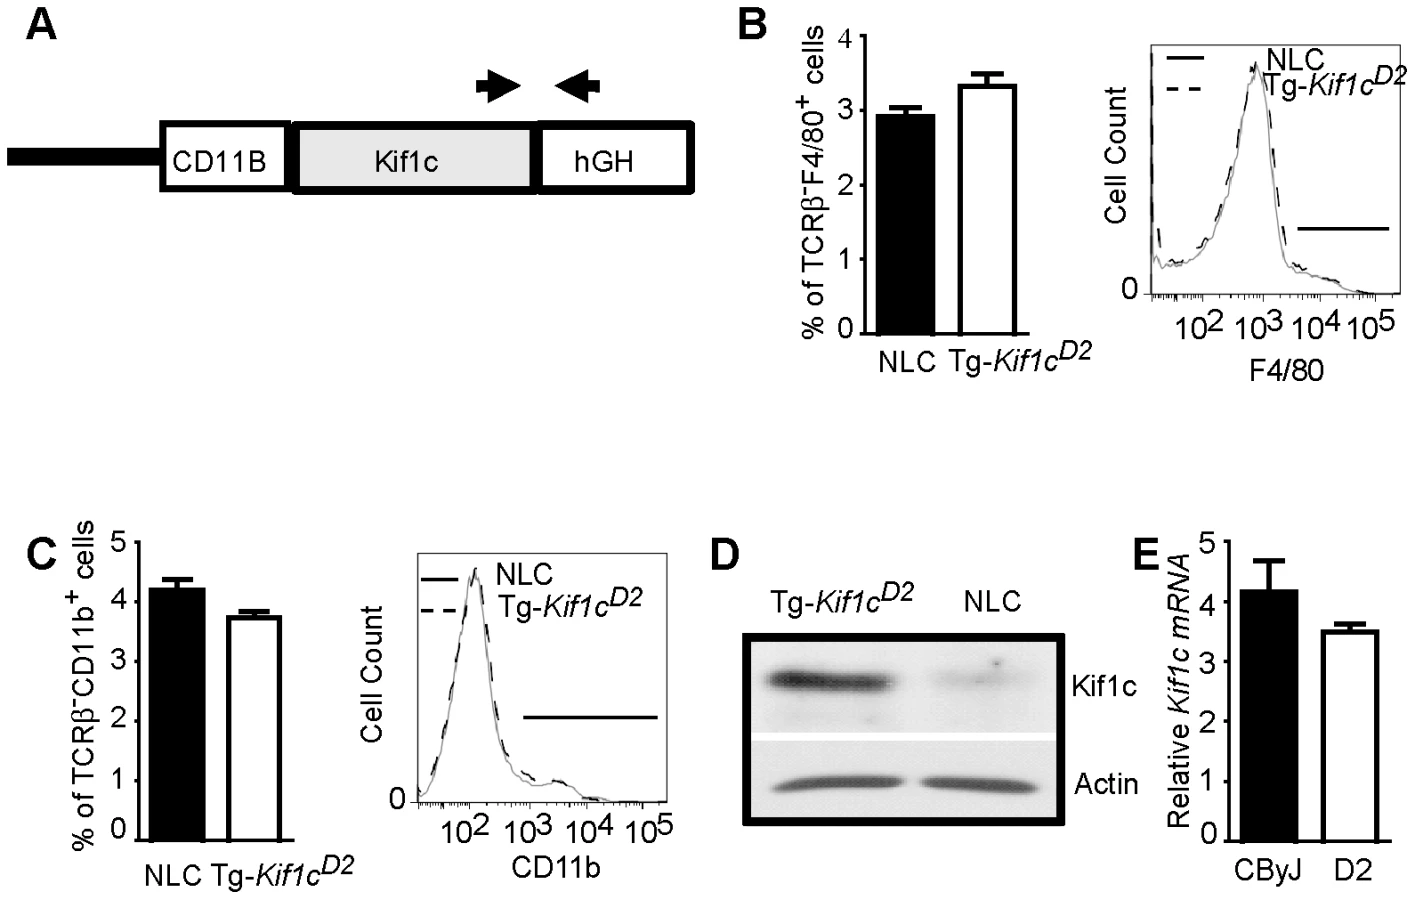
Given the role of Kif1c in macrophage function [15], and that kinesins have been implicated in antigen processing and presentation [16], we decided to directly test the hypothesis that Orch3 is Kif1c. We generated a transgenic mouse line that selectively expressed the resistant Kif1cD2 allele on the susceptible CByJ background using the human CD11B/ITGAM regulatory elements for macrophage/myeloid-specific expression of Kif1cD2 (Figure 4A). The expression of the transgene did not affect macrophage/myeloid cell generation or homeostasis as similar percentages of splenic F4/80+ (Figure 4B) and CD11b+ cells (Figure 4C) were detected on Tg-Kif1cD2 mice compared to negative littermate control (NLC) mice. In addition, no differences in the expression of CD40 or CD86 were observed between strains at baseline (data not shown). Compared to NLC, greater Kif1c protein expression was seen in thioglycolate-induced Tg-Kif1cD2 cells (Figure 4D). Despite the existence of polymorphisms upstream of Kif1c in potential regulatory regions (http://phenome.jax.org/), we did not observe differences in Kif1c expression at the mRNA level between the Kif1cCByJ and Kif1cD2 alleles (Figure 4E). NLC and Tg-Kif1cD2 mice were studied for susceptibility to EAO. The expression of Kif1cD2 in CD11b+ cells protected susceptible CByJ mice from developing EAO (Figure 3, right panel). This finding establishes Kif1c as being Orch3.
Tg expression of Kif1cD2 downregulates MHC class II expression and antigen presenting function of CD11b+ cells
To better understand the mechanism of resistance to EAO conferred by Kif1cD2, microarray analyses were performed on CD11b+ cells from NLC and Tg-Kif1cD2 mice. Using a false discovery rate (FDR) cutoff of 0.05, we determined that 164 genes were differentially expressed between NLC and Tg-Kif1cD2 CD11b+ cells (Table S1). An analysis for functional inference using Ingenuity Pathway Analysis (Ingenuity Systems, www.ingenuity.com) revealed that T helper cell differentiation was the most significant pathway influenced by Kif1c (p<2.80 E-10; Figure S3 and Table S2). In addition, 18 of the top 20 pathways implicated a role for MHC class II, including antigen presentation. Indeed, compared to NLC CD11b+ cells, we observed a marked down regulation in MHC class II gene expression by Tg-Kif1cD2 CD11b+ cells (Table S1 and Figure 5A, dark blue dots). This is consistent with the role of kinesin as the motor that drives MHC class II to the plus end of microtubules toward the cell surface [16].

To corroborate diminished class II expression, flow cytometric analysis was performed using naïve TCRβ−CD19−CD11b+ splenocytes. The results presented in Figure 5B show lower MHC class II expression on Tg-Kif1cD2 cells compared to NLC, D2, and C.D2-3.2 mice. Despite the differences in MHC II expression, no significant difference in the proportion of total splenic CD11b+ cells was observed (Figure 4C). Therefore, expression of the transgene in CD11b+ cells negatively regulates MHC II protein levels.
To further establish a functional role for the differential expression of MHC class II, we assessed antigen presentation by examining Ag-specific T cell proliferation. NLC and Tg-Kif1cD2 mice were immunized with ovalbumin (OVA)+CFA or proteolipid protein (PLP) 180–199 peptide (PLP180–190)+CFA on d0 and d7. Spleen and lymph nodes (LN) were harvested at d10 and the proliferative responses evaluated. Compared to NLC antigen presenting cells (APCs), T cell proliferation in response to OVA was significantly reduced when T cells were stimulated in the presence of Tg-Kif1cD2 APCs (Figure 6A). Similar results were observed for PLP180–199-dependent T cell responses (Figure 6B). These data show that expressing the Kif1cD2 allele in CD11b+ cells confers resistance to EAO by modulating APC function. Taken together our data suggest that Kif1c coding region polymorphism controls susceptibility to autoimmune orchitis.

Amino acid polymorphisms at residues 578 and 1027 on the C-terminal end of Kif1c regulate its function
Kif1c alleles possess amino acid substitutions at residues 578, 1027, and 1066 [17]. Four haplotypes have been identified: LSS (Kif1cCByJ), PSS, PPS, and PPY (Kif1cD2). In addition, it has been shown that the C-terminal region of KIF1c is involved in protein-protein interactions and cargo function [17]–[20]. Therefore, substitutions at 578, 1027, and/or 1066 may have a significant impact on KIF1c function. Given that KIF17b has been shown to control CREM-dependent transcription by regulating the intracellular location of the transcriptional coactivator ACT (activator of CREM in testis) [21], [22], and CREM binding to the Il2 promoter suppresses its activity [23], we evaluated the effect of LSS Kif1cCByJ and PPY Kif1cD2 alleles on Il2 transcriptional activity as an in vitro assay of KIF1c allelic function. Jurkat cells were co-transfected with a plasmid containing the PPY Kif1cD2 allele, the LSS Kif1cByJ allele, or an empty plasmid, and an Il2-promoter luciferase reporter. Cells were then activated with phorbol myristate acetate (PMA) and calcimycin, a calcium ionophore, and the luciferase activity quantified. Jurkat cells that were transfected with the plasmid containing the PPY Kif1cD2 allele displayed significantly decreased luciferase activity (mean decrease 31.46±8.59%, P = 0.03) as compared to the plasmid containing the LSS Kif1cCByJ allele or the control plasmid (Figure 7A). These data demonstrate the functionality of the KIF1c structural polymorphism.

To further characterize the amino acid(s) responsible for the observed differences on Il2-promoter activity associated with the alleles, we replaced the D2-P578→L578 (LPY-KIF1c) or D2-P1027→S1027 (PSY-KIF1c). Jurkat cells were co-transfected with the plasmids containing the wild type D2 PPY-KIF1c allele, LPY-KIF1c (P578→L578) or PSY-KIF1c (P1027→S1027) mutant alleles, or a control plasmid, and Il2-promoter luciferase reporter. Cells were activated with PMA and calcimycin and luciferase activity was assessed. As shown in Figure 7B, LPY-KIF1c and PSY-KIF1c mutants resulted in increased Il2-promoter luciferase activity compared to the D2 PPY-KIF1c allele. Taken together, our data demonstrate that structural polymorphisms at position 578 and 1027 are critical for KIF1c allelic functions.
Discussion
EAO is an organ-specific autoimmune disease that is a model of immunological male infertility [1], [2]. We previously demonstrated that genetic control of EAO is complex and involves both H2-linked (Orch1) and non-H2-linked (Orch3, Orch4, and Orch5) genes [24], [25]. The H2-linked immune response genes primarily control susceptibility to EAO, whereas the non-H2-linked genes suppress the phenotypic expression of disease associated with a susceptible Orch1/H2 allele [9]. Here we report the identification of Orch3 as Kif1c that suppresses EAO by decreasing MHC class II expression and impairing APC function. Importantly, Kif1c may be a shared-autoimmune gene controlling susceptibility to experimental allergic encephalomyelitis (EAE) [26]. Eae7, Eae22, and Eae23 are linked to Orch3 [27], and CByJ and D2 mice are susceptible and resistant to EAE, respectively [28].
With the exception of tyrosine kinase-2 (Tyk2), in which a rare single nucleotide polymorphism in a well conserved APE motif within the pseudokinase domain is fully penetrant in controlling susceptibility to autoimmune diseases [29], [30], the vast majority of non-MHC autoimmune loci identified to date are QTL that exhibit only partial to minimal penetrance. This has proven to be problematic as researchers have attempted to positionally clone and characterize such genes [31]. The fact that Orch3/Kif1c controls a dominant negative immunoregulatory mechanism that suppresses autoimmune orchitis with a high degree of penetrance is unique. Because EAO resistance is conferred in a dominant fashion in this model, an animal must be Orch3CByJ/Kif1cCByJ homozygous to permit disease progression. By using a forward genetic approach, we have now established that Orch3 is Kif1c which, in isolation, controls resistance to EAO with a remarkable degree of penetrance.
Using a transgenic approach we demonstrated that Kif1c is Orch3, and that expression of the resistant Kif1cD2 allele by CD11b+ cells of CByJ mice confers complete protection from the development of EAO. Our data are consistent with the growing number of CD11b+ myeloid cell types with immunosuppressive activity [32], [33]. Indeed, resistance to autoimmune type I diabetes in NOD mice and EAE correlated with the presence of immunomodulatory CD11b+ myeloid cells [34]–36 and the capacity of these cells to maintain a proper T regulatory cell function [37].
Kinesin family members are involved in the activation of immune cells and inflammatory responses [38], [39], and autoimmune disease GWAS identified KIF21B and KIF5A as candidates for autoimmune disease genes [40], [41], suggesting an immunoregulatory role for kinesin family members. In addition, kinesin proteins have been identified as the major molecular motor of microtubule-based intracellular transport [42]. Kif1c is expressed in a variety of tissues [43] and overexpression of a dominant negative form disrupts molecular motor-dependent Golgi-to-Endoplasmic Reticulum (ER) retrograde vesicular transport [18]. It is known that Kif1c alleles possess amino acid substitutions at residues 578, 1027, and 1066 [17]. Here, we demonstrated that residues 578 and 1027 are functionally significant. Although the amino acid polymorphism at residue 1027 is not in an evolutionarily conserved domain [17], it is in the C-terminal region believed to participate in cargo binding. In fact, alterations of this domain have been shown to modify in vivo kinesin protein function [19]. Moreover, it has been shown that the C-terminal tail domain of KIF1c (amino acids 811–1090) is involved in the interaction with bicaudal-D-related protein 1 (BDRP1) and this interaction regulates secretory transport required for neurite development [20]. Therefore, the ability of KIF1c to bind and transport cargo may be altered by polymorphism in this region. However, motor-dependent Golgi-to-ER transport functions normally in Kif1c knockout mice [44]. Immunohistochemical staining partially co-localized KIF1c with the Golgi marker CTR433, suggesting that KIF1c may also be involved in transport around the Golgi apparatus rather than only Golgi-to-ER transport. Accordingly, Wubbolts, et. al. [16] showed that kinesin plays a role in the vesicular transport of MHC II-containing lysosomes from the microtubule organizing center region towards the cell surface. Here, we provide evidence that the resistant Kif1cD2 allele negatively regulates the expression of MHC II proteins on APCs, since Tg-Kif1cD2 CD11b+ cells express lower mRNA and protein levels. The reduction in MHC II expression by CD11b+ Tg-Kif1cD2 cells was directly correlated with impaired antigen presentation as reflected by diminished Ag-specific T cell proliferative response. Whether amino acids at position 578 and 1027 on KIF1c are involved in MHC II expression is currently under investigation. Taken together, our results nevertheless provide mechanistic insight into how polymorphism in other kinesins including KIF21B and KIF5A influence human autoimmune disease susceptibility.
Materials and Methods
Ethics statement
Mice were housed at 25°C with 12/12-h light-dark cycles and 40–60% humidity. The experimental procedures performed in this study were under the guidelines of the Animal Care and Use Committees of the University of Vermont (Burlington, VT) and University of Illinois at Urbana-Champaign (Urbana, IL).
Animals
BALB/cByJ (CByJ), DBA/2J (D2), and (BALB/cByJ×DBA/2J) F1 hybrid (CD2F1) mice were purchased from The Jackson Laboratory (Bar Harbor, ME). The congenic lines in this study were generated using (BALB/cAnPt×DBA/2NCr)×BALB/cAnPt backcross mice [45]. Third generation backcross mice heterozygous at Evi2 or at Hba and Es3 were selected and backcrossed for six generations to BALB/cAnPt mice and fixed by brother-sister mating to generate the C.D2-Evi2 and C.D2-Hba/Es3 lines. Overlapping interval specific recombinant congenic (ISRC) lines were generated by crossing C.D2-Evi2 mice to CByJ mice. F2 hybrids were genotyped using tail snip DNA and PCR with Chr11 microsatellite markers discriminating CByJ and D2 mice across the Orch3 candidate interval. Founders were analyzed for background contamination at a density of 2–5 cM and mice carrying CByJ alleles at all background marker loci were backcrossed an additional two generations to CByJ mice. The lines were fixed by brother-sister mating to generate the C.D2-3, C.D2-5, C.D2-8, and C.D2-9 ISRC lines. Similarly, higher order resolution mapping panels of ISRC lines were generated by screening (C.D2-3×CByJ)×CByJ, (C.D2-8×CByJ)×CByJ and (C.D2-3.2×CByJ)×CByJ backcross mice for recombinants. The genealogy and complete genotypes of the C.D2 congenic mice used in this study are given in Figure S1 and Figure S2, respectively.
The CByJ.CD11B-Kif1cD2 transgenic (Tg-Kif1cD2) mice were generated by microinjection with a construct containing the human CD11B/ITGAM promoter [46], Kif1cD2 cDNA, and the human growth hormone (hGH) polyA signal [47] into C fertilized eggs at the University of Vermont Transgenic/Knockout Facility. Mice were screened for hGH gene by PCR using hGH Fwd 5′ TAG GAA GAA GCC TAT ATC CCA AAG G 3′, hGH Rev 5′ ACA GTC TCT CAA AGT CAG TGG GG 3′ primers. Proinsulin Fwd 5′ CTA GTT GCA GTA GTT CTC CAG 3′ and proinsulin Rev 5′ CCT GCC TAT CTT TCA GGT C 3′ primers were used as internal control.
PCR–based restriction fragment length polymorphism (RFLP)
Genomic DNA was PCR-amplified using standard conditions and the following primers designed around a polymorphism in Nlrp1a: 5′-GGGCACATGGATTCAGAGAT-3′; 5′-AGAGACCCCACCCAACTTC-3′. 10 µl of PCR reaction was digested using 5 units of ApaLI in 50 µl of 1× NEBuffer 4 (New England BioLabs, Inc., Ipswich, MA) for 1 hour at 37°C. Resulting fragments were electrophoresed in 2% agarose gels and visualized by ethidium bromide.
EAO induction
Six-12 week old mice were immunized as previously described [9] with 10 mg of TH plus CFA (Sigma-Aldrich, St. Louis, MO) supplemented with 200 µg of Mycobacterium tuberculosis H37Ra (Difco Laboratories, Detroit, MI) in conjunction with PTX (List Biological Laboratories Inc., Campbell, CA). EAO was evaluated at 25–30 days post-injection. The testes were processed for histological examination as previously described [9]. Histopathologic analysis was carried out in a double-blind manner with each testis being scored individually on a PI from 0–10 as described previously [9]. The overall score for each animal was calculated as the average of both testes with the strain means representing the average of the averages.
Cell preparation and Western blotting
Spleens were collected from CByJ and Tg-Kif1cD2 mice, and single cell suspensions were prepared by passing the cells through a 50 µm nylon mesh (Small parts Inc, Miami Lakes, FL). Erythrocytes were lysed using complete Geyes solution, washed two times and plated to obtain adherent cells. Adherent cells were removed by treating with 0.025% Trypsin-EDTA (Invitrogen, Carlsbad, California), washed three times and pelleted. Whole-cell lysates were prepared in Triton lysis buffer and equal amounts of protein were then separated via SDS-PAGE and transferred to nitrocellulose membranes as described previously [48]. Primary antibodies used for Western blot include anti-Kif1c and anti-Actin (Santa Cruz Biotechnology Inc., Santa Cruz, CA). Bound antibody was visualized by peroxidase-conjugated secondary antibody and detected by chemiluminescence (Kirkegaard and Perry Laboratories, Gaithersburg, MD).
FACS sorting and flow cytometric analysis
NLC and Tg-Kif1cD2 myeloid cells from erythrocyte-free spleens were first enriched by negative selection (using magnetic beads, Qiagen, Hilden, Germany) to deplete cells expressing CD8, CD4, and IgM. For FACS isolation, negatively selected enriched-myeloid cells were stained with anti-CD11b–APCCy7 (BD Pharmingen. Franklin Lakes, NJ), anti-CD11c-PECy5.5 (Invitrogen, Camarillo, CA), anti-TCRβ–FITC, and anti-IA/IE-PE (eBioscience, San Diego, CA), and sorted on a FACSAria (BD Biosciences, San Jose, CA) by gating in the TCRβ−IA/IE+CD11c−CD11b+ myeloid cell population. Antibodies against B220 and CD19 (eBioscience) were also used for flow cytometry.
Microarray analysis
Total RNA was extracted and purified from TCRβ−IA/IE+CD11c−CD11b+ myeloid cells from naïve NLC and Tg-Kif1cD2 mice (n = 6 to 10 mice/strain) using RNeasy isolation reagent (Qiagen Inc.). Purified RNA was quantified using a Nanodrop ND1000™ spectrophotometer (Thermo Scientific, Wilmington, DE) and quality was assessed using an Agilent 2100 bioanalyzer (Agilent Technologies, Palo Alto, California). The RNA integrity number of all samples was greater than 8. For microarray analysis, two RNA pools were created so that each pool contained RNA from 3 to 5 mice, and two arrays per strain were analyzed.
RNA amplification and microarray analysis was performed at UVM Microarray Core Facility using previously described protocols [49]. Briefly, 2 µg of total RNA from each pooled sample were reverse transcribed to the single stranded cDNA using T7-oligo(dT) primer. T4 DNA polymerase was used to synthesize double-stranded cDNA, which served as a template for in vitro transcription using T7 RNA polymerase to produce biotinylated cRNA. The biotinylated cRNAs were fragmented into 50 - to 200-base fragments and then hybridized to GeneChip Mouse Genome 430A 2.0 Arrays for 16 h at 45°C in a rotating Affymetrix GeneChip Hybridization Oven 320. After hybridization, arrays were washed and stained with streptavidin-phycoerythrin on an automated Affymetrix GeneChip Fluidic Station F450. The arrays were scanned with an Affymetrix GeneChip Scanner 2700 and the images quantified using Affymetrix GeneChip Operating Software.
The signal intensity for each probe on each chip was calculated from scanned images using GeneChip Operating Software (Affymetrix), and signal intensities were analyzed using BioConductor (http://www.bioconductor.org). Probe intensities were background corrected, normalized, and summarized using the Robust Multichip Average method described by Speed and coworkers [50], [51]. An alternative normalization method based on reference genes did not significantly change the results. The FDR for differential expression between NLC and Tg-Kif1cD2 for each individual gene was calculated using the method of Benjamini and Hochberg [52]. Gene expression data were analyzed using a threshold of FDR≤0.05 to identify differentially expressed genes.
T cell stimulatory capacity of antigen presenting cells (APCs)
NLC and Tg-Kif1cD2 mice were immunized at d0 and d7 s.c. in the posterior right and left flank and the scruff of the neck with a sonicated PBS/oil emulsion containing 20 µg of OVA, faction V (Sigma-Aldrich, St. Louis, MO), or 100 µg of PLP180–199 in CFA supplemented with 200 µg of Mycobacterium tuberculosis H37Ra. Spleens and LN were harvested on d10. APCs from erythrocyte-free spleens were obtained by anti-CD4/anti-CD8 complement depletion and treated with mitomycin C (25 µg/ml; Sigma-Aldrich). Responder CD4 T cells from LN and spleens were isolated by negative selection as previously described [48]. Single cell suspensions of OVA - or PLP180–199-APCs (2×10⁵ cells/well) and Ag-specific responder CD4 T cell (1×10⁵ cells/well) suspensions were prepared in RPMI 1640 (5% FBS), and plated on standard 96-well U-bottom tissue culture plates. Cells were stimulated with 1, 10, and 25 µg/ml of OVA or 2.5, 10, and 50 µg/ml of PLP180–199 for 72 h at 37°C. During the last 18 h of culture, 1 µCi of [3H] thymidine (PerkinElmer, Santa Clara, CA) was added. Cells were harvested onto glass fiber filters and thymidine uptake was determined with a liquid scintillation counter.
Preparation of Jurkat cells, transfection, stimulation, and luciferase assays
Jurkat cells were cultured in RPMI containing 10% FBS without stimulation for 24 hours at a concentration of 1×10⁶ cells/ml. Plasmids encoding Kif1cD2, Kif1cCByJ alleles, LPY-KIF1c and PSY-KIF1c mutants, corresponding empty vector (pcDNA, Invitrogen, Carlsbad, CA), Il2 promoter (−575 to +57 base pairs) luciferase reporter, and control pGL2 luciferase reporter (Promega, Madison, WI) were used for transfection. Five micrograms of each plasmid were used for the transfection of approximately 5×10⁶ Jurkat cells by electroporation at 250 mV and 900 µF in 250 µl of RPMI with a BioRad electroporator (BioRad, Hercules, CA). Cells were subsequently cultured in RPMI and 10% FBS for 24 hours and then stimulated with PMA (10 ng/ml) and calcium ionophore calcimycin (0.5 µg/ml) for 3 hours. Cell lysates were prepared and supernatants collected to quantified luciferase activity (Promega, Madison, WI). The luminescence was measured immediately using a luminometer (Sunnyvale, CA). The transfection efficiency was compared between the samples by co-transfecting a plasmid encoding β-galactosidase. The luciferase activity was normalized using the β-galactosidase value.
Mutagenesis
Point mutations were introduced in the plasmid encoding the Kif1c allele from the D2 mouse using the QuikChange Site-Directed mutagenesis kit (Stratagene, USA). Briefly the plasmid was denatured and then annealed with the appropriate mutagenic primer that contained the desired mutation. Using Pfu DNA polymerase, new mutagenized strands were created. The parental DNA template was digested with DpnI and the new mutated plasmid was used to transform E. coli. The plasmid DNA was extracted using the Qiagen Maxi-Prep kit (Qiagen, Valencia, CA). The primers used for mutagenesis of the nucleotide at position 1033 (amino acid 578) of the D2 allele were: forward: 5′-GCTCGTGACGGAGCTGCTGGTGCTGAAGTC-3′; reverse: 5′-GACTTCAGCACCAGCAGCTCCGTCACGAGC - 3′; and for the nucleotide at position 3079 (amino acid 1027):
Forward: 5′CGAAGACCCCACCGTTCTCGCAGGAATTCCC-3′, and
Reverse: 5′GGGAATTCCTGCGAGAACGGTGGGGTCTTCG-3′.
Supporting Information
Zdroje
1. Lustig L, Tung KSK (2006) The autoimmune diseases. Missouri: Elsevier-Academic Press. 841–848 p.
2. Tung KSK, Fusi F, Teuscher C (2002) Autoimmune disease of the speermatozoa, ovary and testis; USA: Routledge. 1031–1045 p.
3. KohnoS, MunozJA, WilliamsTM, TeuscherC, BernardCC, et al. (1983) Immunopathology of murine experimental allergic orchitis. J Immunol 130 : 2675–2682.
4. TungKS, TeuscherC (1995) Mechanisms of autoimmune disease in the testis and ovary. Hum Reprod Update 1 : 35–50.
5. YuleTD, TungKS (1993) Experimental autoimmune orchitis induced by testis and sperm antigen-specific T cell clones: an important pathogenic cytokine is tumor necrosis factor. Endocrinology 133 : 1098–1107.
6. JacoboP, GuazzoneVA, Jarazo-DietrichS, TheasMS, LustigL (2009) Differential changes in CD4+ and CD8+ effector and regulatory T lymphocyte subsets in the testis of rats undergoing autoimmune orchitis. J Reprod Immunol 81 : 44–54.
7. JacoboP, PerezCV, TheasMS, GuazzoneVA, LustigL (2011) CD4+ and CD8+ T cells producing Th1 and Th17 cytokines are involved in the pathogenesis of autoimmune orchitis. Reproduction 141 : 249–258.
8. TeuscherC, BlankenhornEP, HickeyWF (1987) Differential susceptibility to actively induced experimental allergic encephalomyelitis and experimental allergic orchitis among BALB/c substrains. Cell Immunol 110 : 294–304.
9. TeuscherC, SmithSM, GoldbergEH, ShearerGM, TungKS (1985) Experimental allergic orchitis in mice. I. Genetic control of susceptibility and resistance to induction of autoimmune orchitis. Immunogenetics 22 : 323–333.
10. MeekerND, HickeyWF, KorngoldR, HansenWK, SudweeksJD, et al. (1995) Multiple loci govern the bone marrow-derived immunoregulatory mechanism controlling dominant resistance to autoimmune orchitis. Proc Natl Acad Sci U S A 92 : 5684–5688.
11. RazaviR, ChanY, AfifiyanFN, LiuXJ, WanX, et al. (2006) TRPV1+ sensory neurons control beta cell stress and islet inflammation in autoimmune diabetes. Cell 127 : 1123–1135.
12. MacMickingJ, XieQW, NathanC (1997) Nitric oxide and macrophage function. Annu Rev Immunol 15 : 323–350.
13. NagyG, KonczA, TelaricoT, FernandezD, ErsekB, et al. (2010) Central role of nitric oxide in the pathogenesis of rheumatoid arthritis and systemic lupus erythematosus. Arthritis Res Ther 12 : 210.
14. BoydenED, DietrichWF (2006) Nalp1b controls mouse macrophage susceptibility to anthrax lethal toxin. Nat Genet 38 : 240–244.
15. KoppP, LammersR, AepfelbacherM, WoehlkeG, RudelT, et al. (2006) The kinesin KIF1C and microtubule plus ends regulate podosome dynamics in macrophages. Mol Biol Cell 17 : 2811–2823.
16. WubboltsR, Fernandez-BorjaM, JordensI, ReitsE, DusseljeeS, et al. (1999) Opposing motor activities of dynein and kinesin determine retention and transport of MHC class II-containing compartments. J Cell Sci 112 ((Pt 6))
785–795.
17. WattersJW, DewarK, LehoczkyJ, BoyartchukV, DietrichWF (2001) Kif1C, a kinesin-like motor protein, mediates mouse macrophage resistance to anthrax lethal factor. Curr Biol 11 : 1503–1511.
18. DornerC, CiossekT, MullerS, MollerPH, UllrichA, et al. (1998) Characterization of KIF1C, a new kinesin-like protein involved in vesicle transport from the Golgi apparatus to the endoplasmic reticulum. J Biol Chem 273 : 20267–20275.
19. KirchnerJ, SeilerS, FuchsS, SchliwaM (1999) Functional anatomy of the kinesin molecule in vivo. Embo J 18 : 4404–4413.
20. SchlagerMA, KapiteinLC, GrigorievI, BurzynskiGM, WulfPS, et al. (2010) Pericentrosomal targeting of Rab6 secretory vesicles by Bicaudal-D-related protein 1 (BICDR-1) regulates neuritogenesis. Embo J 29 : 1637–1651.
21. MachoB, BrancorsiniS, FimiaGM, SetouM, HirokawaN, et al. (2002) CREM-dependent transcription in male germ cells controlled by a kinesin. Science 298 : 2388–2390.
22. ChennathukuzhiV, MoralesCR, El-AlfyM, HechtNB (2003) The kinesin KIF17b and RNA-binding protein TB-RBP transport specific cAMP-responsive element modulator-regulated mRNAs in male germ cells. Proc Natl Acad Sci U S A 100 : 15566–15571.
23. HedrichCM, RauenT, TsokosGC (2011) cAMP-responsive element modulator (CREM)alpha protein signaling mediates epigenetic remodeling of the human interleukin-2 gene: implications in systemic lupus erythematosus. J Biol Chem 286 : 43429–43436.
24. SnoekM, JansenM, OlavesenMG, CampbellRD, TeuscherC, et al. (1993) Three Hsp70 genes are located in the C4-H-2D region: possible candidates for the Orch-1 locus. Genomics 15 : 350–356.
25. TeuscherC, GasserDL, WoodwardSR, HickeyWF (1990) Experimental allergic orchitis in mice. VI. Recombinations within the H-2S/H-2D interval define the map position of the H-2-associated locus controlling disease susceptibility. Immunogenetics 32 : 337–344.
26. ButterfieldRJ, SudweeksJD, BlankenhornEP, KorngoldR, MariniJC, et al. (1998) New genetic loci that control susceptibility and symptoms of experimental allergic encephalomyelitis in inbred mice. J Immunol 161 : 1860–1867.
27. ButterfieldRJ, BlankenhornEP, RoperRJ, ZacharyJF, DoergeRW, et al. (2000) Identification of genetic loci controlling the characteristics and severity of brain and spinal cord lesions in experimental allergic encephalomyelitis. Am J Pathol 157 : 637–645.
28. TeuscherC, HickeyWF, GraferCM, TungKS (1998) A common immunoregulatory locus controls susceptibility to actively induced experimental allergic encephalomyelitis and experimental allergic orchitis in BALB/c mice. J Immunol 160 : 2751–2756.
29. ShawMH, BoyartchukV, WongS, KaraghiosoffM, RagimbeauJ, et al. (2003) A natural mutation in the Tyk2 pseudokinase domain underlies altered susceptibility of B10.Q/J mice to infection and autoimmunity. Proc Natl Acad Sci U S A 100 : 11594–11599.
30. SpachKM, NoubadeR, McElvanyB, HickeyWF, BlankenhornEP, et al. (2009) A single nucleotide polymorphism in Tyk2 controls susceptibility to experimental allergic encephalomyelitis. J Immunol 182 : 7776–7783.
31. WandstratA, WakelandE (2001) The genetics of complex autoimmune diseases: non-MHC susceptibility genes. Nat Immunol 2 : 802–809.
32. GabrilovichDI, NagarajS (2009) Myeloid-derived suppressor cells as regulators of the immune system. Nat Rev Immunol 9 : 162–174.
33. GeissmannF, ManzMG, JungS, SiewekeMH, MeradM, et al. (2010) Development of monocytes, macrophages, and dendritic cells. Science 327 : 656–661.
34. FuW, WojtkiewiczG, WeisslederR, BenoistC, MathisD (2012) Early window of diabetes determinism in NOD mice, dependent on the complement receptor CRIg, identified by noninvasive imaging. Nat Immunol 13 : 361–368.
35. Moline-VelazquezV, CuervoH, Vila-Del SolV, OrtegaMC, ClementeD, et al. (2011) Myeloid-derived suppressor cells limit the inflammation by promoting T lymphocyte apoptosis in the spinal cord of a murine model of multiple sclerosis. Brain Pathol 21 : 678–691.
36. WeberMS, Prod'hommeT, YoussefS, DunnSE, RundleCD, et al. (2007) Type II monocytes modulate T cell-mediated central nervous system autoimmune disease. Nat Med 13 : 935–943.
37. RicherMJ, LavalleeDJ, ShaninaI, HorwitzMS (2012) Immunomodulation of antigen presenting cells promotes natural regulatory T cells that prevent autoimmune diabetes in NOD mice. PLoS ONE 7: e31153 doi:10.1371/journal.pone.0031153.
38. BernasconiP, CappellettiC, NavoneF, NessiV, BaggiF, et al. (2008) The kinesin superfamily motor protein KIF4 is associated with immune cell activation in idiopathic inflammatory myopathies. J Neuropathol Exp Neurol 67 : 624–632.
39. StagiM, GorlovoyP, LarionovS, TakahashiK, NeumannH (2006) Unloading kinesin transported cargoes from the tubulin track via the inflammatory c-Jun N-terminal kinase pathway. Faseb J 20 : 2573–2575.
40. McCauleyJL, ZuvichRL, BeechamAL, De JagerPL, KonidariI, et al. (2010) Comprehensive follow-up of the first genome-wide association study of multiple sclerosis identifies KIF21B and TMEM39A as susceptibility loci. Hum Mol Genet 19 : 953–962.
41. AlcinaA, VandenbroeckK, OtaeguiD, SaizA, GonzalezJR, et al. (2010) The autoimmune disease-associated KIF5A, CD226 and SH2B3 gene variants confer susceptibility for multiple sclerosis. Genes Immun 11 : 439–445.
42. HirokawaN, NodaY, TanakaY, NiwaS (2009) Kinesin superfamily motor proteins and intracellular transport. Nat Rev Mol Cell Biol 10 : 682–696.
43. NakagawaT, TanakaY, MatsuokaE, KondoS, OkadaY, et al. (1997) Identification and classification of 16 new kinesin superfamily (KIF) proteins in mouse genome. Proc Natl Acad Sci U S A 94 : 9654–9659.
44. NakajimaK, TakeiY, TanakaY, NakagawaT, NakataT, et al. (2002) Molecular motor KIF1C is not essential for mouse survival and motor-dependent retrograde Golgi apparatus-to-endoplasmic reticulum transport. Mol Cell Biol 22 : 866–873.
45. McAllisterRD, SinghY, du BoisWD, PotterM, BoehmT, et al. (2003) Susceptibility to anthrax lethal toxin is controlled by three linked quantitative trait loci. Am J Pathol 163 : 1735–1741.
46. BoilleeS, YamanakaK, LobsigerCS, CopelandNG, JenkinsNA, et al. (2006) Onset and progression in inherited ALS determined by motor neurons and microglia. Science 312 : 1389–1392.
47. WildinRS, GarvinAM, PawarS, LewisDB, AbrahamKM, et al. (1991) Developmental regulation of lck gene expression in T lymphocytes. J Exp Med 173 : 383–393.
48. NoubadeR, MilliganG, ZacharyJF, BlankenhornEP, del RioR, et al. (2007) Histamine receptor H1 is required for TCR-mediated p38 MAPK activation and optimal IFN-gamma production in mice. J Clin Invest 117 : 3507–3518.
49. Affymetrix (2005–2006) GeneChip Expression Analysis Technical Manual.
50. BolstadBM, IrizarryRA, AstrandM, SpeedTP (2003) A comparison of normalization methods for high density oligonucleotide array data based on variance and bias. Bioinformatics 19 : 185–193.
51. IrizarryRA, BolstadBM, CollinF, CopeLM, HobbsB, et al. (2003) Summaries of Affymetrix GeneChip probe level data. Nucleic Acids Res 31: e15.
52. BenjaminiY, DraiD, ElmerG, KafkafiN, GolaniI (2001) Controlling the false discovery rate in behavior genetics research. Behav Brain Res 125 : 279–284.
53. PoppRA, BailiffEG, SkowLC, WhitneyJB3rd (1982) The primary structure of genetic variants of mouse hemoglobin. Biochem Genet 20 : 199–208.
54. WattersJW, DietrichWF (2001) Genetic, physical, and transcript map of the Ltxs1 region of mouse chromosome 11. Genomics 73 : 223–231.
55. RoderickTH, HuttonJJ, RuddleFH (1970) Linkage of esterase-3 and rex on linkage group VII of the mouse. J Hered 61 : 278–279.
Štítky
Genetika Reprodukční medicínaČlánek vyšel v časopise
PLOS Genetics
2012 Číslo 12
Nejčtenější v tomto čísle
- Population Genomics of Sub-Saharan : African Diversity and Non-African Admixture
- Dnmt3a Protects Active Chromosome Domains against Cancer-Associated Hypomethylation
- Excessive Astrocyte-Derived Neurotrophin-3 Contributes to the Abnormal Neuronal Dendritic Development in a Mouse Model of Fragile X Syndrome
- Pre-Disposition and Epigenetics Govern Variation in Bacterial Survival upon Stress