
The Intronic Long Noncoding RNA Recruits PRC2 to the Promoter, Reducing the Expression of and Increasing Cell Proliferation
The down-regulation of the tumor-suppressor gene RASSF1A has been shown to increase cell proliferation in several tumors. RASSF1A expression is regulated through epigenetic events involving the polycomb repressive complex 2 (PRC2); however, the molecular mechanisms modulating the recruitment of this epigenetic modifier to the RASSF1 locus remain largely unknown. Here, we identify and characterize ANRASSF1, an endogenous unspliced long noncoding RNA (lncRNA) that is transcribed from the opposite strand on the RASSF1 gene locus in several cell lines and tissues and binds PRC2. ANRASSF1 is transcribed through RNA polymerase II and is 5′-capped and polyadenylated; it exhibits nuclear localization and has a shorter half-life compared with other lncRNAs that bind PRC2. ANRASSF1 endogenous expression is higher in breast and prostate tumor cell lines compared with non-tumor, and an opposite pattern is observed for RASSF1A. ANRASSF1 ectopic overexpression reduces RASSF1A abundance and increases the proliferation of HeLa cells, whereas ANRASSF1 silencing causes the opposite effects. These changes in ANRASSF1 levels do not affect the RASSF1C isoform abundance. ANRASSF1 overexpression causes a marked increase in both PRC2 occupancy and histone H3K27me3 repressive marks, specifically at the RASSF1A promoter region. No effect of ANRASSF1 overexpression was detected on PRC2 occupancy and histone H3K27me3 at the promoter regions of RASSF1C and the four other neighboring genes, including two well-characterized tumor suppressor genes. Additionally, we demonstrated that ANRASSF1 forms an RNA/DNA hybrid and recruits PRC2 to the RASSF1A promoter. Together, these results demonstrate a novel mechanism of epigenetic repression of the RASSF1A tumor suppressor gene involving antisense unspliced lncRNA, in which ANRASSF1 selectively represses the expression of the RASSF1 isoform overlapping the antisense transcript in a location-specific manner. In a broader perspective, our findings suggest that other non-characterized unspliced intronic lncRNAs transcribed in the human genome might contribute to a location-specific epigenetic modulation of genes.
Published in the journal:
. PLoS Genet 9(8): e32767. doi:10.1371/journal.pgen.1003705
Category:
Research Article
doi:
https://doi.org/10.1371/journal.pgen.1003705
Summary
The down-regulation of the tumor-suppressor gene RASSF1A has been shown to increase cell proliferation in several tumors. RASSF1A expression is regulated through epigenetic events involving the polycomb repressive complex 2 (PRC2); however, the molecular mechanisms modulating the recruitment of this epigenetic modifier to the RASSF1 locus remain largely unknown. Here, we identify and characterize ANRASSF1, an endogenous unspliced long noncoding RNA (lncRNA) that is transcribed from the opposite strand on the RASSF1 gene locus in several cell lines and tissues and binds PRC2. ANRASSF1 is transcribed through RNA polymerase II and is 5′-capped and polyadenylated; it exhibits nuclear localization and has a shorter half-life compared with other lncRNAs that bind PRC2. ANRASSF1 endogenous expression is higher in breast and prostate tumor cell lines compared with non-tumor, and an opposite pattern is observed for RASSF1A. ANRASSF1 ectopic overexpression reduces RASSF1A abundance and increases the proliferation of HeLa cells, whereas ANRASSF1 silencing causes the opposite effects. These changes in ANRASSF1 levels do not affect the RASSF1C isoform abundance. ANRASSF1 overexpression causes a marked increase in both PRC2 occupancy and histone H3K27me3 repressive marks, specifically at the RASSF1A promoter region. No effect of ANRASSF1 overexpression was detected on PRC2 occupancy and histone H3K27me3 at the promoter regions of RASSF1C and the four other neighboring genes, including two well-characterized tumor suppressor genes. Additionally, we demonstrated that ANRASSF1 forms an RNA/DNA hybrid and recruits PRC2 to the RASSF1A promoter. Together, these results demonstrate a novel mechanism of epigenetic repression of the RASSF1A tumor suppressor gene involving antisense unspliced lncRNA, in which ANRASSF1 selectively represses the expression of the RASSF1 isoform overlapping the antisense transcript in a location-specific manner. In a broader perspective, our findings suggest that other non-characterized unspliced intronic lncRNAs transcribed in the human genome might contribute to a location-specific epigenetic modulation of genes.
Introduction
RASSF1A (RAS-association domain family member 1A) is a tumor suppressor gene that modulates a broad range of cellular functions essential for normal growth, such as the maintenance of genomic stability, cell cycle control, the modulation of apoptosis, and cell motility and invasion [1]. RASSF1A is one of seven alternatively spliced isoforms (RASSF1A to G) generated at the gene locus through the differential usage of two promoters or alternative splicing [2], [3]. The biological relevance of only two isoforms, RASSF1A and RASSF1C, has been demonstrated. Both isoforms are ubiquitously expressed in non-tumor tissues, whereas in tumors and tumor cell lines, the expression of RASSF1A is frequently low, leading to increased cell proliferation [3]. RASSF1A promoter CpG island hypermethylation and reduced gene expression are frequently observed in a wide range of cancers [4]–[9]. The epigenetic silencing of RASSF1A requires the HOXB3-mediated induction of DNMT3B DNA methyltransferase expression and the recruitment of the DNMT3B protein to the RASSF1A promoter [10]. The recruitment of DNMT3B and the polycomb repressor complex 2 (PRC2) is dependent on MYC proto-oncogene protein, which is bound to the RASSF1A promoter [10]. Although MYC is required for PRC2 recruitment to the RASSF1A promoter [10], MYC is generally not sufficient to recruit PRC2 [10], [11], and other regulatory factors and mechanisms underlying the recruitment of this epigenetic silencing machinery have not yet been identified.
The human genome encodes thousands of long (>200 nt) noncoding RNAs (lncRNAs) [12], [13] that might function via diverse mechanisms [14]–[16]. Intergenic lncRNAs have been associated with gene silencing through guiding enzymes involved in chromatin remodeling, particularly PRC2, causing the posttranslational modification of histones in target genes [17]–[19]. In addition, recent reports have shown that thousands of lncRNAs are associated with PRC2 and that many of these are sense and antisense intronic lncRNAs [20], [21], not intergenic.
In the present study, we identified a novel unspliced antisense intronic lncRNA, ANRASSF1, which is expressed in the RASSF1 gene locus independently from the protein-coding gene. The modulation of ANRASSF1 abundance through ectopic overexpression or transient knockdown affected the expression level of RASSF1A, with no effect on RASSF1C. We demonstrated that ANRASSF1 formed an lncRNA/DNA hybrid, which mediated the recruitment of SUZ12, a member of PRC2, to the RASSF1A promoter. The recruitment of SUZ12 resulted in a marked increase in the H3K27me3 levels only at the RASSF1A promoter region, without accumulation of the repressive mark either at the RASSF1C promoter or the four neighboring loci. ANRASSF1-mediated gene repression occurred in a highly location-specific manner, as only the RASSF1A isoform, which overlaps the antisense transcript, was affected.
Results
ANRASSF1 is transcribed antisense to the RASSF1A gene
We surveyed the public Expressed Sequence Tags (ESTs) database and identified a long RNA transcript that mapped to an intronic region of the RASSF1 genomic locus. This transcript was represented by a cluster of ESTs covering 580 bp of the genome, which mapped just upstream of the RASSF1C isoform (Figure 1A, light gray rectangle) and overlapped exon 2 of RASSF1A. Indeed, this transcript was one of 67,731 putative unspliced lncRNAs mapping to intronic regions of 74% of all protein-coding genes, which were previously described by our group [22], being part of a genome-wide pervasive lncRNA expression involving between 75 and 90% of the human genome [12], [13], [23].

The ESTs described above originated from non-strand specific cDNA libraries produced from a number of different human tissues, and we used strand-oriented RT-PCR to confirm the expression of this long RNA in several cell lines. Figure 1B shows the expression of an RNA transcribed in the antisense direction relative to protein-coding mRNAs encoded in the RASSF1 locus in nine different cell lines. This transcript will hereafter be referred to as ANRASSF1, for Antisense Intronic Noncoding RASSF1 RNA.
Next, we used the Rapid Amplification of cDNA Ends (RACE) approach to extend both the 5′ and 3′ ends of the ANRASSF1 transcript. The 3′ RACE-PCR product was sequenced, showing a 38-nt extension beyond the existing ESTs, with 5 nt of the extended sequence matching the genome and the additional sequence showing a poly(A) tail of 33 adenines (Figure 1A). We also identified a conserved polyadenylation signal (ATTAAA) [24] 17 nt upstream of the poly(A) tail. Using a combined approach involving 5′ RACE-PCR with primer-walking PCR and sequencing, we extended the transcript 205 nt at the 5′ end (Figure 1A, red box), resulting in a full-length ANRASSF1 transcript of 790 nt. High-throughput strand-specific RNA-seq of poly(A)+ RNA from LNCaP prostate cancer cells showed transcription from the plus strand in the RASSF1 locus (Figure 1C), and the assembly of these RNA-seq reads using the Cufflinks tool generated a consensus sequence mapping to the genomic plus strand in the locus. These data essentially confirmed the length and antisense orientation of ANRASSF1, which were previously identified through strand-specific RT-PCR, RACE-PCR and sequencing. Using the Coding Potential Calculator tool [25], no coding potential was predicted for the full-length ANRASSF1, confirming ANRASSF1 as an lncRNA.
Because ANRASSF1 is represented by an Affymetrix probe set in the HG-U133 Plus2 microarray platform and the entire RASSF1 locus is represented by a different probe set, we performed a meta-analysis of the ANRASSF1 and RASSF1 expression patterns on publicly available microarray data. We identified a statistically significant inverse correlation (Figure 1D) between the expression levels of ANRASSF1 and RASSF1 in HeLa, MDA-MB-231 and MCF-7 cells, which are three cell lines in which we had previously confirmed ANRASSF1 expression using RT-PCR (Figure 1B). In addition, this meta-analysis revealed that in Jurkat cells under mitotic stress (Figure 1E), RASSF1 showed a 1.5-fold increase within the first hour following mitogen stimulation with a phorbol ester and ionomycin; this response was inversely correlated with ANRASSF1 expression. Notably, the expression of RASSF1 and Daxx was described to define a mitotic stress checkpoint that enables cells to exit mitosis and eventually die [26]. Our meta-analysis also detected an inverse correlation between ANRASSF1 and RASSF1 in three other studies using cell lines and human tissue samples (Figure S1). Overall, these data highlight a functional role for ANRASSF1 in the host locus.
Inverse correlation between ANRASSF1 and RASSF1A expression in non-tumor and tumor cell lines
Next, we measured ANRASSF1 and RASSF1A expression in tumor and non-tumor immortalized cell lines obtained from the breast (Figure 2A) and prostate (Figure 2B). Interestingly, we detected the reduced expression of ANRASSF1 in non-tumor cell lines compared with tumors in both tissues, and an opposite pattern for RASSF1A expression, which was higher in non-tumor cells compared with tumor cell lines. Thus, the inverse correlation between ANRASSF1 and RASSF1 expression in the public array datasets was confirmed in the one non-tumor and two tumor cell lines obtained from two different tissues.

ANRASSF1 lncRNA is RNAPII-encoded and nuclear-enriched and has a short half-life
To determine whether ANRASSF1 lncRNA is transcribed through RNA Polymerase II, we treated HeLa cells with α-amanitin at a concentration of 10 µg/mL, which inhibits only RNAPII. Figure S2A shows that ANRASSF1 transcription was abolished in α-amanitin-treated cells.
ANRASSF1 contained a 5′ end methyl-guanosine cap modification, as shown by its resistance to 5′-exonucleolytic digestion in vitro (Figure S2B). To determine ANRASSF1 stability, HeLa cell cultures were treated for 1 to 8 h with the RNA polymerase inhibitor actinomycin D. ANRASSF1 levels decayed with a half-life of ∼50 min following transcriptional inhibition (Figure S2C). For comparison, c-Myc mRNA displayed a half-life of ∼20 min under similar conditions (Figure S2C).
Nuclear and cytoplasmic total RNA fractions were prepared from HeLa cells, and the relative abundance of ANRASSF1 was measured using qPCR. Figure S2D shows that ANRASSF1 was 100-fold enriched in the nuclear fraction relative to the cytoplasm.
A comparison of the expression levels of ANRASSF1 with those of abundant intergenic lncRNAs (lincRNAs), such as MALAT1 [27], HOTAIR [19] and lincRNA SFPQ [18] showed that endogenous ANRASSF1 was much less abundant (approximately 500 - to 1,000-fold lower) than these lincRNAs in HeLa cells (Figure S2E). Similarly, endogenous ANRASSF1 was approximately 500 - to 1,000-fold less abundant than the protein-coding RASSF1A and RASSF1C mRNAs, which are expressed from the same host locus (Figure S2E), demonstrating that ANRASSF1 was expressed at low levels in the cell.
ANRASSF1 is transcribed from an independent promoter
A putative bidirectional promoter region spanning the transcription start-sites of ANRASSF1 and RASSF1C has been predicted in silico [28]. We referred to the region on the genomic plus strand upstream of ANRASSF1 as the “antisense promoter” and the region in the minus strand upstream of RASSF1C as the “sense promoter” (Figure S3A). The activity of both promoters was measured in vitro, and both promoters showed a significant induction of the firefly luciferase reporter relative to the control (p<0.01) (Figure S3B). This result confirmed the presence of a bidirectional promoter, specifically indicating promoter activity upstream of the ANRASSF1 lncRNA, thus supporting an independent antisense transcriptional unit in this locus.
Overexpression of ANRASSF1 negatively modulates the protein-coding RASSF1A mRNA and decreases the RASSF1A protein
The observation of an inverse correlation between ANRASSF1 and RASSF1 expression (Figures 1D, 1E, 2 and S1) prompted us to determine whether ANRASSF1 could act in cis to modulate the expression of the protein-coding gene in the same locus. We overexpressed ANRASSF1 and subsequently measured the levels of the RASSF1 transcript isoforms. When the expression levels of ANRASSF1 were increased to 40-fold compared with the control cells (Figure 3A), RASSF1A expression was significantly decreased to 21% of its endogenous level (Figure 3B). Interestingly, the overexpression of ANRASSF1 did not affect the abundance of the RASSF1C mRNA isoform (Figure 3C).

In parallel, the levels of RASSF1A protein were determined through western blot. Figure 3D shows that RASSF1A was reduced in pCEP4 ANRASSF1-transfected HeLa cell lines compared with control cells. Densitometric analysis of western blots from three replicates of cells overexpressing ANRASSF1 showed a 57% decrease in the levels of RASSF1A protein compared with the normal levels observed in the control cells (Figure 3E).
Overexpression of ANRASSF1 increases the cell proliferation rate and decreases cell death
To determine whether the decrease in RASSF1A protein due to overexpression of ANRASSF1 would result in detectable phenotypic changes, cell-proliferation assays were performed. First, we observed that cells overexpressing ANRASSF1 proliferated at a significantly faster rate than the control cells (Figure 4A), with a significant 22% average increase in the proliferation rate (p<0.03) determined using an MTS assay. We also measured cell population growth by directly counting the number of cells over time in culture in a Neubauer chamber (Figure 4B); the adjusted exponential growth functions (R2 ranging from 0.93 to 0.99 throughout the replicates) showed calculated doubling times of 20.2±1.9 and 25.0±3.7 h for the cells overexpressing ANRASSF1 and the control cells, respectively, with a significant 24% average increase in the cell growth rate (p<0.05) upon ANRASSF1 overexpression (Figure 4B). The 22 to 24% increase in cell proliferation rate observed in the MTS and cell number counting assays upon the increase in ANRASSF1 expression, with a resulting decrease of RASSF1A abundance, is consistent with the tumor suppressor function of this protein. This increase is comparable to the 26% increase in cell proliferation over one day previously observed with RASSF1A siRNA [29].

In addition to reducing cell proliferation, RASSF1A exerts a proapoptotic signaling function [30]. We therefore measured the cell death caused by exposure to UVC light or the cytotoxic anti-cancer drug staurosporine to determine whether the overexpression of ANRASSF1 and the resulting decrease in RASSF1A would affect the course of cell death. Figure 4C shows that UVC irradiation (40 J/m2) caused an important increase in cell death, as shown by the increase in the sub-G1 population of cells, and the overexpression of ANRASSF1 substantially decreased the UVC-induced sub-G1 population, which is indicative of a reduction in cell death. Figure 4D shows the average increase in the sub-G1 population in the control cells (empty pCEP4) exposed to UVC compared with no-UV, as measured in three independent replicas, and a significant decrease in the percentage of the sub-G1 population in cells overexpressing ANRASSF1 after exposure to UVC (t-test p<0.05), which is indicative of reduced cell death in the latter condition compared with the control (empty pCEP4) cell line.
Next, we measured cell death in response to the cytotoxic drug staurosporine (100 nM), a classical initiator of apoptosis by both caspase-dependent and caspase-independent pathways [31], and again tested the effect of ANRASSF1 overexpression on cell death. We employed the xCELLigence platform microelectric assay based on the changing impedance of electrodes in the presence of live cells to examine the drug-induced cytotoxicity over an extended period of time in culture (170 h). Figure 4E shows that after exposure to staurosporine for 96 h, the cells overexpressing ANRASSF1 were considerably more resistant to death, remaining attached to the culture plates, even after 170 h; the measured cell index, which corresponded with the number of live cells attached to the plate (Figure 4E), showed a significant 4.2-fold average increase in cells overexpressing ANRASSF1 compared with the control cells (empty pCEP4) at 170 h in the three biological replicates (p<0.001). These findings are consistent with the proapoptotic signaling function of RASSF1A [30] and indicate that RASSF1A silencing through the overexpression of ANRASSF1 attenuated the cell death signal induced through UVC irradiation or staurosporine treatment.
ANRASSF1 silencing positively modulates the protein-coding RASSF1A message levels
To further document the effect of ANRASSF1 abundance on the expression of RASSF1A, we designed specific siRNAs to silence ANRASSF1. A pool of three different siRNAs targeting ANRASSF1 significantly reduced ANRASSF1 expression to 39% of its endogenous level compared with a scrambled siRNA control (Figure 5A). Concomitantly, we observed a 2.25-fold increase in the relative abundance of RASSF1A mRNA (Figure 5B). The decrease in ANRASSF1 expression did not affect the abundance of the RASSF1C isoform (Figure 5C), which is consistent with the lack of effect of ANRASSF1 overexpression on RASSF1C previously observed.

Next, we performed cell-proliferation assays to determine whether ANRASSF1 knockdown and the consequent increase in the RASSF1A mRNA levels affected the cell proliferation rate. We observed that cells with silenced ANRASSF1 expression proliferated at a significantly slower rate than control cells (Figure 5D), with an average 15% decrease in the proliferation rate compared with control cells (p<0.02).
Accumulation of histone H3K27 trimethylation to the RASSF1A promoter locus is dependent on the level of ANRASSF1 binding to PRC2
We sought to gain mechanistic insight into the involvement of the lncRNA ANRASSF1 in regulating RASSF1A expression. ANRASSF1 has nuclear localization, suggesting that this protein might be involved in the recruitment of other factors (MYC/PRC2) involved in RASSF1A gene silencing through H3K27 trimethylation and/or DNA promoter methylation [10].
First, we examined whether endogenous ANRASSF1 was physically associated with PRC2 using a native non-cross linked RNA immunoprecipitation (RNA-IP) with an antibody specific to SUZ12, a member of the PRC2 complex. Figure 6A shows that the endogenous ANRASSF1 was 5.3-fold enriched with respect to negative control RNA, which was not expected to bind PRC2, namely GAPDH mRNA. The endogenous lincRNA SFPQ, which binds PRC2, as determined with anti-SUZ12 and anti-EZH2 antibodies [18], was used as positive control and showed a 2.8-fold enrichment (Figure 6B).

Using an antibody specific to EZH2, another member of the PRC2 complex (Figure S4), we observed that endogenous ANRASSF1 was enriched in the anti-EZH2 RNA-IP fraction relative to the input compared with the IgG fraction.
Next, we determined whether the PRC2 complex was bound to the promoter region of RASSF1A and if the overexpression of ANRASSF1 affects PRC2 occupancy in this region. We performed chromatin immunoprecipitation (ChIP) using an anti-SUZ12 antibody and observed a significant 8-fold increase of the RASSF1A promoter DNA bound to PRC2 in cells overexpressing ANRASSF1 compared with control cells expressing endogenous levels of ANRASSF1 (Figure 6C). Interestingly, no significant change in PRC2 occupancy upon ANRASSF1 overexpression was observed either at the promoter region of the RASSF1C isoform or the promoter of the four neighboring genes, two on either side at the RASSF1 locus (Figure 6C), including the two well-characterized tumor suppressor genes TUSC2 [32] and NPRL2 [33]. As additional controls, no significant change was detected at either the promoter of GAPDH, a gene not regulated through SUZ12, or the promoter of HOXA9, a gene regulated through SUZ12 [34] and encoded in chromosome 7, away from the RASSF1 locus in chromosome 3. These results indicate a correlation between the higher levels of ANRASSF1 and the higher PRC2 occupancy at the RASSF1A promoter.
PRC2 is a histone-modifying enzyme complex responsible for adding di - and trimethylation marks onto H3K27. We determined whether ANRASSF1 overexpression, which increases PRC2 occupancy, also affected the level of H3K27me3 at the RASSF1A promoter region. Figure 6D shows that there was a 5.1-fold enrichment of the RASSF1A promoter DNA associated with histone H3K27me3 when ANRASSF1 was overexpressed compared with control cells with endogenous levels of ANRASSF1, confirming that H3K27 trimethylation in the RASSF1A promoter is dependent on the level of ANRASSF1 binding to PRC2. No significant changes in H3K27me3 were observed at either the promoter region of RASSF1C or the promoter region of the four other genes in the vicinity of RASSF1 (Figure 6D). In addition, no change was detected at the promoter region of HOXA9. These results suggest highly location-specific epigenetic modulation.
Because DNA methylation of the RASSF1A promoter involves PRC2 and DNMT3B [10], we examined whether the increased recruitment of PRC2 through ANRASSF1 overexpression also affected DNMT3B occupancy at the RASSF1A promoter or DNA methylation at the locus. Figure 6E shows that the DNMT3B occupancy at the RASSF1A promoter is not affected by ANRASSF1 overexpression in HeLa cells. A methylation-dependent endonuclease assay showed no significant effect on the DNA methylation at the promoter region of RASSF1A in cells overexpressing ANRASSF1 compared with the control (Figure 6F).
ANRASSF1 is bound to DNA and required for the PRC2 occupancy at the RASSF1A promoter
Recent reports have shown that lincRNAs, such as lncRNACCND1 [35] and Mistral [36], bind to DNA and recruit proteins that act at the promoter regions of neighboring protein-coding genes to regulate their expression. We determined whether ANRASSF1 might act in a similar manner through binding to DNA and recruiting the PRC2 complex in cis to the promoter of RASSF1A. For this purpose, we treated permeabilized HeLa cells with RNase H to deplete endogenous ANRASSF1 associated with DNA, followed by ChIP using an anti-SUZ12 antibody. First, we measured the endogenous ANRASSF1 levels in cells treated either with RNase inhibitor (Figure 7A, black bar) or RNase H (Figure 7A, red bar). With RNase H treatment, which digests RNA/DNA hybrids, the ANRASSF1 level was reduced to 13%, suggesting that ANRASSF1 is part of an RNA/DNA hybrid. Alpha-tubulin RNA, which was used as a control in this study, was only digested by RNase A (Figure 7B, blue bar), not RNase H (Figure 7B, red bar), as anticipated for an RNA that is not expected to form RNA/DNA hybrids. In parallel, we measured the PRC2 occupancy at the RASSF1A and RASSF1C promoter regions and observed that the maximum occupancy was obtained in the presence of RNase inhibitor (Figure 7C and 7D, black bars). Treatment with RNase H resulted in an almost total release of PRC2 from the RASSF1A promoter region (Figure 7C, red bar), while a low PRC2 occupancy at the RASSF1C promoter region (Figure 7D, black bar) and no significant reduction upon RNase H or RNase A treatment was observed (Figure 7D, red and blue bars); these data indicate that the PRC2 occupancy at the RASSF1A promoter region — not the RASSF1C promoter region — is driven by ANRASSF1.

We also performed an RNase-ChIP assay using an anti-DNMT3B antibody, and no differences in the occupancy at the RASSF1A or RASSF1C promoter regions were detected under RNase H or RNase A treatments (Figure 7E and 7F). This result indicates that the DNMT3B occupancy at the RASSF1 locus is not driven by ANRASSF1; consistent with the observation described above, the DNMT3B occupancy at the RASSF1A promoter was not affected through ANRASSF1 overexpression (Figure 6E).
Finally, a negative control RNase-ChIP with anti-RNA Pol II, a factor whose occupancy at the promoters of RASSF1A and RASSF1C is not expected to be affected by RNase H treatment, was included; treatment with RNase H or RNase A did not change the RASSF1A or RASSF1C promoter occupancy by RNA Pol II (Figure 7G and 7H), ruling out the notion that the effect on PRC2 would result from the toxic effect of RNase treatment on the cells.
Notably, in cells treated with RNase A, which digests single-stranded RNA (ssRNA), we observed both a reduction in the endogenous ANRASSF1 (Figure 7A, blue bar) and the PRC2 occupancy at the RASSF1A promoter (Figure 7C, blue bar); however, the reduction was considerably smaller than that obtained with RNase H treatment (see Figure 7A and 7C, red bars), suggesting that the ssRNA in the nucleoplasm was in rapid equilibrium with the RNA/DNA hybrids and that a shift from hybrids to single-strand occurred as the hybrid was digested. Alternatively, there could be two distinct populations of ssRNA and RNA-DNA hybrids, and both could play a role in the association of PRC2 with chromatin.
A similar pattern of RNase H digestion and PRC2 occupancy at the RASSF1A promoter was observed in cells overexpressing ANRASSF1 (Figure S5). Notably, the amount of ANRASSF1 under overexpression conditions was 40-fold higher than that endogenously expressed (see Figure 3A); therefore, the similar percentage of ANRASSF1 depletion achieved through RNase H treatment (Figure S5B) indicates that the absolute amount of the remaining ANRASSF1 was also approximately 40-fold higher in overexpressing cells, resulting in a smaller reduction of PRC2 binding at the RASSF1A promoter in overexpressing cells treated with RNase H (45% reduction with respect to the inhibitor, Figure S5A) compared with cells with endogenous lncRNA treated with RNase H (90% reduction with respect to the inhibitor, Figure 7C).
RNAi was employed to determine whether the reduction of PRC2 occupancy at the RASSF1A promoter is specifically associated with ANRASSF1 expression. The knockdown of ANRASSF1 to 40% of the endogenous level (data not shown) caused a 55% reduction in PRC2 occupancy at the RASSF1A promoter (Figure 8A). Similarly, Palakurthy et al. [10] knocked down EZH2 expression using RNAi and observed an increase in the expression of RASSF1A. Taken together, these results indicate that the recruitment of PRC2 complex to the promoter of RASSF1A specifically relies on the association of PRC2 with an ANRASSF1/DNA hybrid structure.

In parallel, we also measured the DNMT3B occupancy and levels of DNA methylation at the RASSF1A promoter (Figure 8B and 8C); neither condition was affected by ANRASSF1 knockdown, which is consistent with our observations of a lack of effect on DNMT3B occupancy when ANRASSF1 was either overexpressed or digested by RNase.
Discussion
Some of the features identified for ANRASSF1, such as the presence of a 5′ cap, transcription through RNAPII, nuclear enrichment and binding to PRC2, are shared with other lncRNAs [18], [37]. However, the ANRASSF1 half-life is short (∼50 min) compared with other moderately stable lncRNAs that exert epigenetic roles, such as Air, Kcnq1ot1 and Xist, which have half-lives of 2.1, 3.4 and 4.6 h, respectively [38].
ANRASSF1 is an unspliced intronic lncRNA and a member of a poorly characterized class of RNAs, as intronic unspliced RNAs are occasionally suspected as technical artifacts or transcriptional noise [39]. Notably, the intronic ANRASSF1 in HeLa cells showed considerably lower expression levels compared with the well-studied intergenic lncRNAs (Figure S2). Nevertheless, changes in ANRASSF1 abundance through ectopic overexpression or siRNA-mediated knockdown have specifically affected RASSF1A gene expression through PRC2 recruitment. Most importantly, the changes in ANRASSF1 abundance did not affect the expression of RASSF1C, another mRNA isoform expressed in the RASSF1 locus under a different promoter, or the levels of H3K27me3 and PRC2 recruitment to the RASSF1C promoter and the promoters of neighboring genes in the RASSF1 locus, including two other well-characterized tumor suppressor genes, namely TUSC2 [32] and NPRL2 [33]. These data suggest a highly location-specific epigenetic regulation at the histone level that is driven by lncRNA ANRASSF1.
DNA methylation of the RASSF1A promoter involves PRC2 and DNMT3B DNA-methyl transferase in lung carcinoma cell lines that have high HOX3B expression [10]. We observed a limited, non-significant effect on DNA methylation at the RASSF1A promoter when the PRC2 occupancy was changed through ANRASSF1 overexpression or knockdown in HeLa cells. Other factors, such as HOXB3 expression and DNMT3B occupancy at the RASSF1A promoter, are involved in DNA methylation [10], and the observed limited increase in DNA methylation in HeLa cells overexpressing ANRASSF1 might reflect the eventual limited availability of these factors in HeLa cells. Indeed, the promoter region of RASSF1A in HeLa cells is hypomethylated [3].
Recently, many intronic RNA sequences capable of binding the PRC2 core component EZH2 have been detected in human cancer cells [20]. These authors characterized an EZH2-bound intronic unspliced RNA for the methyltransferase gene SMYD3 in more detail and observed that EZH2 binds to sense intronic ncRNA either at the pre-mRNA stage or after splicing and intron removal [20]. The overexpression of sense ncRNA from the SMYD3 locus caused the epigenetic in cis regulation of SMYD3 and a decrease in cell proliferation [20]. Different from ANRASSF1, this intronic unspliced lncRNA is not derived from an independent transcriptional unit in the locus.
Another example of intronic unspliced lncRNA recruiting PRC2 is Kcnq1ot1, which is transcribed from the Kcnq1 locus. The lncRNA Kcnq1ot1 regulates the expression of ten genes at the Kcnq1 imprinted cluster [40] through a mechanism clearly distinct from the location-specific cis-acting regulation of the RASSF1A isoform observed here.
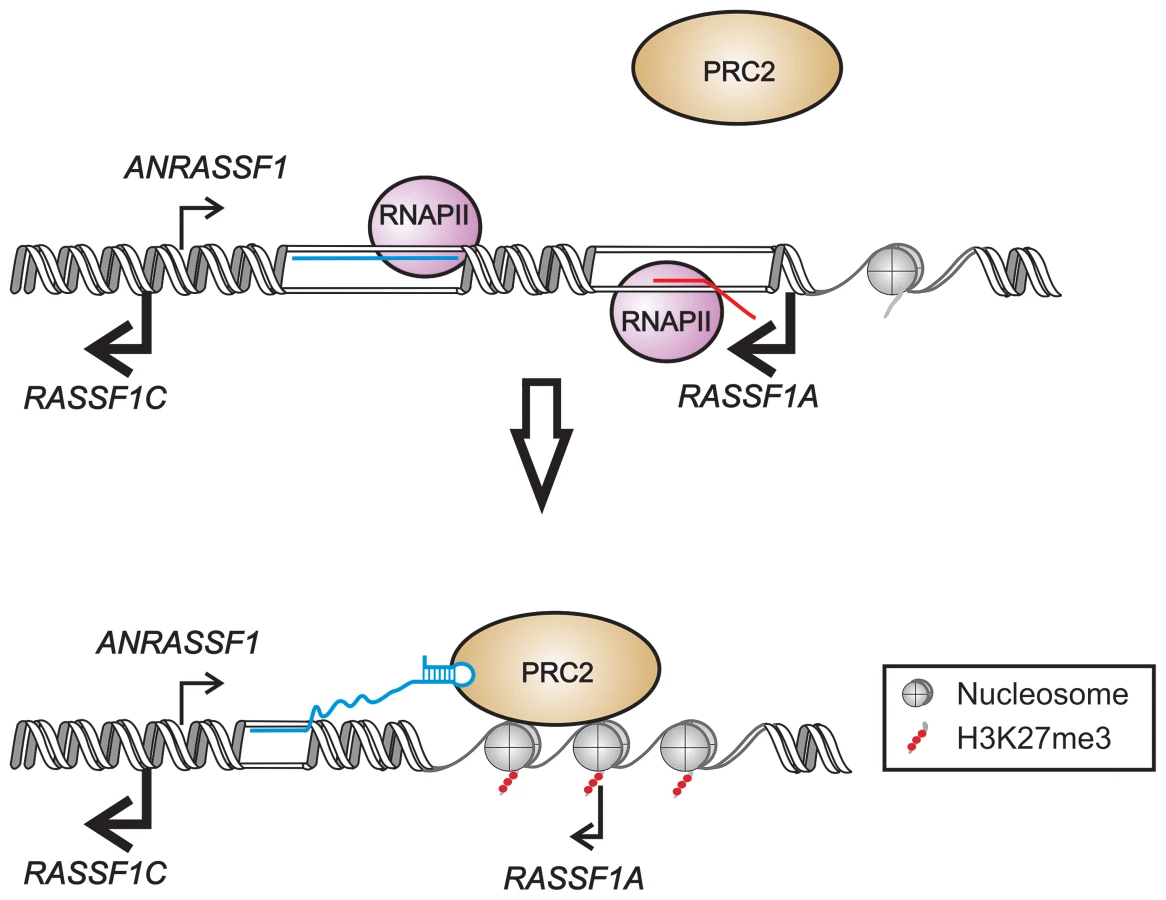
In the present study, we demonstrated that the unspliced intronic ANRASSF1 binds to PRC2 and is required for PRC2 occupancy at the RASSF1A promoter region. We postulate an in cis mechanism (Figure 9) by which the interaction of ANRASSF1 with both DNA at its transcription site and PRC2 induces the recruitment of PRC2 to the RASSF1A and not the RASSF1C promoter. In turn, PRC2 recruitment induces the accumulation of the repressive mark H3K27me3, which culminates in the transcriptional down-regulation of only the RASSF1A isoform (Figure 9). This model, which involves a lncRNA/DNA hybrid, would be analogous to that of the intergenic lncRNA Mistral; however, different from the model proposed here, the intergenic lncRNA Mistral mediates the activation of HOXA6 and HOXA7 transcription in trans [36]. The MLL1 SET domain is involved in recognizing and binding the Mistral/DNA hybrid, thus triggering dynamic changes in the chromosome conformation [36] that involve the formation of a loop in the DNA at the promoter of the HOXA6 and HOXA7 neighboring genes. A loop conformation at the RASSF1A promoter, similar to that proposed for the Mistral locus, could be the subject of further investigation.
ANRASSF1 is one of the thousands of unspliced lncRNAs, named TIN and PIN RNAs, transcribed from the intronic regions of 74% of the protein-coding genes in the human genome [22], [41]. The formation of an RNA/DNA hybrid at the transcription locus could result in a highly location-specific effect for a number of these unspliced intronic lncRNAs. Indeed, 141 lncRNAs map to the intronic regions of 127 protein-coding genes and are associated with chromatin, as identified through chromatin-RNA isolation and high-throughput sequencing [42]; of these, 52% are TIN/PIN RNAs [42]. We hypothesize that other non-characterized unspliced intronic lncRNAs transcribed in the human genome might contribute to a diverse location-specific epigenetic modulation at the loci where they are transcribed [43].
There is increasing evidence that lncRNAs are involved in a number of human diseases [44]–[46], particularly in cancer [46]–[50]. Taken together, our results reveal a novel mechanism for epigenetic regulation at the RASSF1 locus that involves the antisense unspliced lncRNA ANRASSF1, suggesting an inverse correlation between ANRASSF1 and RASSF1A expression in both tumor and non-tumor cell lines. Further studies on the potential involvement of ANRASSF1 expression in tumorigenesis are warranted. These results could be the tip of the iceberg of an epigenetic modulation mechanism driven through unspliced intronic lncRNAs that might act at highly gene-specific loci in the human genome.
Materials and Methods
Cell lines and RNA extraction
All cell lines were obtained from the American Type Culture Collection (ATCC) and grown as recommended in media supplemented with 10% fetal bovine serum and 1% penicillin/streptomycin (Gibco). Total RNA was extracted using Trizol (Invitrogen) and purified using the RNAspin Mini kit (GE Healthcare) according to the manufacturer's instructions, except for an extended 1 h treatment with DNase I. Total RNA was quantified on a NanoDrop ND-1000 Spectrophotometer (NanoDrop Technologies). Total RNA integrity was assessed using an Agilent 2100 Bioanalyzer (Agilent Technologies).
RACE and primer-walking PCR
For RACE-PCR, we used a commercial Human Colon Marathon-Ready cDNA library (Clontech) prepared from poly(A) RNA and Advantage 2 polymerase (Clontech) according to the manufacturer's instructions. Primer-walking PCR, using the sequence obtained from the in silico prediction of the transcriptional start site (TSS), was performed as described in the supporting information (Protocol S1). All primers are listed in Table S1. The PCR products were sequenced using the Sanger method. The ANRASSF1 full-length sequence has been deposited in GenBank under accession number KC330992.
Strand specific RT–PCR
Orientation-specific RT-PCR was performed with 1.5 µg total RNA using a gene-specific primer complementary to the antisense or sense strand of ANRASSF1 according to the recommendations of Super Script III kit protocol (Invitrogen). Subsequently, PCR was performed using the internal primer pair indicated in Figure 1B. The primers are listed in Table S1. To control for DNA contamination in the RNA sample, reverse transcription with no RT-primer was performed, followed by PCR.
Reverse transcription and quantitative real-time PCR (RT-qPCR)
Oligo-dT-primed reverse transcription (RT) was performed using 1 µg of total RNA according to the Super Script III kit protocol (Invitrogen). The relative levels of the ANRASSF1 and RASSF1 isoforms and other lncRNAs were determined through quantitative real-time PCR (qPCR) (primers are shown in Table S2) with Power SYBR Green (Applied Biosystems) using the 7500 Real Time PCR System (Applied Biosystems). The levels of these transcripts were normalized to the level of tubulin and represented as a fold-change using the delta Ct method [51].
RNA-seq
Poly(A)+-RNA was extracted from LNCaP cells in culture using the FastTrack MAG Maxi mRNA Isolation Kit (Invitrogen) according to the manufacturer's instructions with the following modifications: treatment with 25 U of amplification grade DNase I (Invitrogen) for 1 h at room temperature. RNA was quantified using the Quant-iT RiboGreen RNA Reagent (Invitrogen) and assessed for integrity through electrophoresis with the Bioanalyzer RNA Pico LabChip (Agilent Technologies). Poly(A)+-RNA from three biological replicates was processed for Illumina sequencing using the standard protocol for strand-oriented paired-end 75-nt read sequencing, and a total of ∼430 million reads were obtained and mapped with TopHat [52] to the hg19 version of the human genome, followed by an ab-initio assembly using the Cufflinks tool [53], with the default parameters.
Meta-analysis of the Affymetrix microarray expression data
A meta-analysis was performed using the publicly available microarray expression data from the Affymetrix HG-U133 Plus2 platform. The purification strategy, RNA processing method and hybridization strategy have been described in the original publications. The expression and sample annotation data were downloaded from the NCBI GEO website: GSE5823 [54], GSE11118 [55], GSE10879 [56], GSE12056 [57] and GSE13471 [58]. A Pearson correlation analysis between the expression signals of probe sets 240278_at (ANRASSF1) and 204346_s_at (RASSF1 entire locus) was used in each study.
ANRASSF1 overexpression and silencing
For overexpression, the ANRASSF1 cDNA was amplified through PCR (primers in Table S1), inserted into the pCEP4 expression vector (Invitrogen) to generate pCEP4 ANRASSF1 and subsequently sequenced. The cells were transfected with a linearized pCEP4 ANRASSF1 or a linearized empty vector (NheI) using FuGENE 6 Transfection Reagent (Roche). After transfection, the resistant cells were selected using 100 µg/mL hygromycin B (Invitrogen). For silencing, the HeLa cells were plated on 60-mm plates in medium without FBS. Twenty-four hours after plating, a pool of three distinct 25-mer siRNAs (5 nM each, final concentration) targeting ANRASSF1 or a pool of three 25-mer scrambled siRNAs (Invitrogen) (Table S3) were transfected using Lipofectamine RNAimax (Invitrogen). The total RNA was extracted at 48 h after transfection. Alternatively, 120 nM of a modified 20-mer oligo (Table S3) was used for ANRASSF1 silencing in the ChIP assays, which were performed at 24 h after transfection using Lipofectamine RNAimax (Invitrogen).
Western blotting
The cells were washed with PBS, lysed on ice in 20 mM imidazole (pH 7.2) containing 1 mM EDTA and 250 mM sucrose with complete protease inhibitor cocktail (Roche) and sonicated. The protein content in the lysates was determined using the BCA protein assay (Bio-Rad). Equal protein amounts (40 µg) were resolved through SDS-PAGE. The primary antibodies were anti-RASSF1A (Abcam – ab23950) and anti-actin (Millipore – mab1501); and secondary antibodies were labeled with Alexa Fluor 680 (Invitrogen). The signals were detected using an Odyssey Infrared Imaging System (LI-COR Biosciences). The signal intensities were quantified using Odyssey Application Software v3 (LI-COR Biosciences).
Cell proliferation assay
HeLa cells transfected with empty pCEP4 or pCEP4 ANRASSF1 were seeded onto 96-well plates. Each pair of biological replicates was seeded onto the same plate. Cell proliferation was evaluated in an MTS assay by measuring formazan absorbance at 24 and 48 h using the CellTiter 96 Aqueous One Solution Cell Proliferation Assay (Promega) in a SpectraMax Paradigm (Molecular Devices). Three independent replicate transfections were tested. The proliferation coefficient was defined as the ratio between the average measurements at 24 and 48 h. For the RNAi assay, HeLa cells were seeded onto 96-well plates in media without FBS. The transfections were performed at 24 h after the seeding, and the cells were evaluated for proliferation at 24 and 48 h, as described above.
Population doubling time
To measure the effect of ANRASSF1 overexpression on the cellular proliferation phenotype, 2×10⁴ cells overexpressing ANRASSF1 or control cells were seeded onto a 6-well plate. The cells were trypsinized every 24 h for 5 days and counted on a Neubauer chamber. The adjustment of exponential functions to the curves and statistical analyses were performed using GraphPad Prism software.
Analyses of the sub-G1 population after UV irradiation
To measure the UV-induced sub-G1 population, which is indicative of cell death, plates containing pre-seeded cells at 70% confluence were washed with PBS and irradiated with 40 J/m2 UVC light with a germicidal lamp (primary emission at 254 nm) at a rate of 1.0 J.m−2.s−1, as measured with a VLX 3W radiometer (Vilber Lourmat). After 48 h, the supernatant and the attached cells were collected and fixed with 70% ethanol. Staining with propidium iodide (PI) was performed at room temperature for 1 h in PBS solution containing 20 µg/mL PI (Sigma-Aldrich), 200 µg/mL RNase A (Invitrogen) and 0.1% Triton X-100 (Sigma-Aldrich). These samples were loaded onto a Guava PCA-96 System cytometer (Millipore), and the analyses were performed using CytoSoft software (Millipore).
Staurosporine-induced cytotoxicity assay
The cytotoxicity induced through staurosporine treatment was evaluated with a real time cytotoxicity assay using the xCELLigence system (Roche). Briefly, 2×10³ cells overexpressing ANRASSF1 or control cells were seeded in triplicate onto the wells of a 96-well E-plate (Roche). After 18 h, these samples were treated with 100 nM staurosporine (Sigma) or mock-treated with the same concentration of DMSO (zero time). Thereafter, the impedance was continuously measured according to the manufacturer's instructions and as previously described [59]. Three independent biological replicate experiments were performed, each with technical triplicates.
RNA Immunoprecipitation (RIP)
Native, non-cross linked RIP was performed using the Magna RIP RNA-Binding Protein Immunoprecipitation Kit (Millipore) according to the manufacturer's instructions. The following antibodies were used from Millipore: Normal Mouse IgG (12-371) and anti-SUZ12 (03-179); and Abcam: anti-EZH2 (ab3748). The RNAs were extracted using Trizol, treated with TURBO DNase (Ambion) at 37°C for 30 min, purified using an RNeasy Micro Kit (Qiagen) and quantified with RiboGreen (Invitrogen). All RIP assays were performed in biological triplicate and were detected by RT-qPCR (primers in Table S2).
Chromatin Immunoprecipitation (ChIP)
ChIP was performed using the EZ-Magna ChIP Chromatin Immunoprecipitation Kit (Millipore). The following antibodies were used from Millipore: normal mouse IgG (12-371), normal rabbit IgG (12-370) and anti-SUZ12 (03-179); and Abcam: anti-H3K27me3 (ab6002), anti-H3 (ab1791) and anti-DNMT3B (ab2851). The DNA was detected through qPCR (primers in Table S2).
RNase ChIP
Permeabilization of HeLa cells and RNase treatment were performed as previously described [36]. After the RNase treatment, an aliquot (70% vol) was processed as described above in the ChIP protocol using the following antibodies from Millipore: normal mouse IgG (12-371), anti-SUZ12 (03-179) and anti-RNA Pol II clone CTD4H8 (05-623B); and Abcam: anti-DNMT3B (ab2851). The remaining aliquot (30% vol) was processed as described in the RNA extraction protocol and analyzed through RT-qPCR (the primers are listed in Table S2).
DNA methylation assay
DNA was extracted using phenol/chloroform and Proteinase K using a previously published method [60] and fragmented through sonication. A 1-µg sample of this DNA was treated with 100 U of methylation-dependent McrBC endonuclease (New England Biolabs) at 37°C for 16 h. The amount of RASSF1A promoter DNA was measured using qPCR (primers in Table S2). As a control, an assay with no endonuclease was run in parallel. Three biological replicates were tested.
Supporting Information
Zdroje
1. DonningerH, VosMD, ClarkGJ (2007) The RASSF1A tumor suppressor. J Cell Sci 120 : 3163–3172.
2. DammannR, SchagdarsurenginU, StrunnikovaM, RastetterM, SeidelC, et al. (2003) Epigenetic inactivation of the Ras-association domain family 1 (RASSF1A) gene and its function in human carcinogenesis. Histol Histopathol 18 : 665–677.
3. DammannR, LiC, YoonJH, ChinPL, BatesS, et al. (2000) Epigenetic inactivation of a RAS association domain family protein from the lung tumour suppressor locus 3p21.3. Nat Genet 25 : 315–319.
4. AgathanggelouA, CooperWN, LatifF (2005) Role of the Ras-association domain family 1 tumor suppressor gene in human cancers. Cancer Res 65 : 3497–3508.
5. AminKS, BanerjeePP (2012) The cellular functions of RASSF1A and its inactivation in prostate cancer. J Carcinog 11 : 3.
6. AvruchJ, XavierR, BardeesyN, ZhangXF, PraskovaM, et al. (2009) Rassf family of tumor suppressor polypeptides. J Biol Chem 284 : 11001–11005.
7. FernandesMS, CarneiroF, OliveiraC, SerucaR (2012) Colorectal cancer and RASSF family - A special emphasis on RASSF1A. Int J Cancer 132 (2) 251–8 doi: 10.1002/ijc.27696
8. JiangY, CuiL, ChenWD, ShenSH, DingLD (2012) The prognostic role of RASSF1A promoter methylation in breast cancer: a meta-analysis of published data. PLoS One 7: e36780.
9. HoqueMO, BraitM, RosenbaumE, PoetaML, PalP, et al. (2010) Genetic and epigenetic analysis of erbB signaling pathway genes in lung cancer. J Thorac Oncol 5 : 1887–1893.
10. PalakurthyRK, WajapeyeeN, SantraMK, GazinC, LinL, et al. (2009) Epigenetic silencing of the RASSF1A tumor suppressor gene through HOXB3-mediated induction of DNMT3B expression. Mol Cell 36 : 219–230.
11. GoodliffeJM, WieschausE, ColeMD (2005) Polycomb mediates Myc autorepression and its transcriptional control of many loci in Drosophila. Genes Dev 19 : 2941–2946.
12. BirneyE, StamatoyannopoulosJA, DuttaA, GuigoR, GingerasTR, et al. (2007) Identification and analysis of functional elements in 1% of the human genome by the ENCODE pilot project. Nature 447 : 799–816.
13. KapranovP, ChengJ, DikeS, NixDA, DuttaguptaR, et al. (2007) RNA maps reveal new RNA classes and a possible function for pervasive transcription. Science 316 : 1484–1488.
14. WangX, SongX, GlassCK, RosenfeldMG (2011) The long arm of long noncoding RNAs: roles as sensors regulating gene transcriptional programs. Cold Spring Harb Perspect Biol 3: a003756.
15. KhalilAM, RinnJL (2011) RNA-protein interactions in human health and disease. Semin Cell Dev Biol 22 : 359–365.
16. MattickJS (2012) RNA driving the epigenetic bus. EMBO J 31 : 515–516.
17. GuttmanM, DonagheyJ, CareyBW, GarberM, GrenierJK, et al. (2011) lincRNAs act in the circuitry controlling pluripotency and differentiation. Nature 477 : 295–300.
18. KhalilAM, GuttmanM, HuarteM, GarberM, RajA, et al. (2009) Many human large intergenic noncoding RNAs associate with chromatin-modifying complexes and affect gene expression. Proc Natl Acad Sci U S A 106 : 11667–11672.
19. RinnJL, KerteszM, WangJK, SquazzoSL, XuX, et al. (2007) Functional demarcation of active and silent chromatin domains in human HOX loci by noncoding RNAs. Cell 129 : 1311–1323.
20. GuilS, SolerM, PortelaA, CarrereJ, FonallerasE, et al. (2012) Intronic RNAs mediate EZH2 regulation of epigenetic targets. Nat Struct Mol Biol 19 : 664–670.
21. ZhaoJ, OhsumiTK, KungJT, OgawaY, GrauDJ, et al. (2010) Genome-wide identification of polycomb-associated RNAs by RIP-seq. Mol Cell 40 : 939–953.
22. NakayaHI, AmaralPP, LouroR, LopesA, FachelAA, et al. (2007) Genome mapping and expression analyses of human intronic noncoding RNAs reveal tissue-specific patterns and enrichment in genes related to regulation of transcription. Genome Biol 8: R43.
23. DjebaliS, DavisCA, MerkelA, DobinA, LassmannT, et al. (2012) Landscape of transcription in human cells. Nature 489 : 101–108.
24. ColganDF, ManleyJL (1997) Mechanism and regulation of mRNA polyadenylation. Genes Dev 11 : 2755–2766.
25. KongL, ZhangY, YeZQ, LiuXQ, ZhaoSQ, et al. (2007) CPC: assess the protein-coding potential of transcripts using sequence features and support vector machine. Nucleic Acids Res 35: W345–349.
26. GiovinazziS, LindsayCR, MorozovVM, Escobar-CabreraE, SummersMK, et al. (2012) Regulation of mitosis and taxane response by Daxx and Rassf1. Oncogene 31 : 13–26.
27. JiP, DiederichsS, WangW, BoingS, MetzgerR, et al. (2003) MALAT-1, a novel noncoding RNA, and thymosin beta4 predict metastasis and survival in early-stage non-small cell lung cancer. Oncogene 22 : 8031–8041.
28. DavuluriRV, GrosseI, ZhangMQ (2001) Computational identification of promoters and first exons in the human genome. Nat Genet 29 : 412–417.
29. CalipelA, AbonnetV, NicoleO, MascarelliF, CouplandSE, et al. (2011) Status of RASSF1A in uveal melanocytes and melanoma cells. Mol Cancer Res 9 : 1187–1198.
30. MatallanasD, RomanoD, YeeK, MeisslK, KucerovaL, et al. (2007) RASSF1A elicits apoptosis through an MST2 pathway directing proapoptotic transcription by the p73 tumor suppressor protein. Mol Cell 27 : 962–975.
31. ZhangXD, GillespieSK, HerseyP (2004) Staurosporine induces apoptosis of melanoma by both caspase-dependent and -independent apoptotic pathways. Molecular Cancer Therapeutics 3 : 187–197.
32. UnoF, SasakiJ, NishizakiM, CarboniG, XuK, et al. (2004) Myristoylation of the fus1 protein is required for tumor suppression in human lung cancer cells. Cancer Res 64 : 2969–2976.
33. KurataA, KatayamaR, WatanabeT, TsuruoT, FujitaN (2008) TUSC4/NPRL2, a novel PDK1-interacting protein, inhibits PDK1 tyrosine phosphorylation and its downstream signaling. Cancer Sci 99 : 1827–1834.
34. CaoR, ZhangY (2004) SUZ12 is required for both the histone methyltransferase activity and the silencing function of the EED-EZH2 complex. Mol Cell 15 : 57–67.
35. WangX, AraiS, SongX, ReichartD, DuK, et al. (2008) Induced ncRNAs allosterically modify RNA-binding proteins in cis to inhibit transcription. Nature 454 : 126–130.
36. BertaniS, SauerS, BolotinE, SauerF (2011) The noncoding RNA Mistral activates Hoxa6 and Hoxa7 expression and stem cell differentiation by recruiting MLL1 to chromatin. Mol Cell 43 : 1040–1046.
37. GuttmanM, AmitI, GarberM, FrenchC, LinMF, et al. (2009) Chromatin signature reveals over a thousand highly conserved large non-coding RNAs in mammals. Nature 458 : 223–227.
38. RedrupL, BrancoMR, PerdeauxER, KruegerC, LewisA, et al. (2009) The long noncoding RNA Kcnq1ot1 organises a lineage-specific nuclear domain for epigenetic gene silencing. Development 136 : 525–530.
39. RinnJL, ChangHY (2012) Genome Regulation by Long Noncoding RNAs. Annu Rev Biochem 81 : 145–166.
40. PandeyRR, MondalT, MohammadF, EnrothS, RedrupL, et al. (2008) Kcnq1ot1 antisense noncoding RNA mediates lineage-specific transcriptional silencing through chromatin-level regulation. Mol Cell 32 : 232–246.
41. EngelhardtJ, StadlerPF (2012) Hidden treasures in unspliced EST data. Theory Biosci 131 : 49–57.
42. MondalT, RasmussenM, PandeyGK, IsakssonA, KanduriC (2010) Characterization of the RNA content of chromatin. Genome Res 20 : 899–907.
43. LouroR, SmirnovaAS, Verjovski-AlmeidaS (2009) Long intronic noncoding RNA transcription: expression noise or expression choice? Genomics 93 : 291–298.
44. WapinskiO, ChangHY (2011) Long noncoding RNAs and human disease. Trends Cell Biol 21 : 354–361.
45. TaftRJ, PangKC, MercerTR, DingerM, MattickJS (2010) Non-coding RNAs: regulators of disease. J Pathol 220 : 126–139.
46. EstellerM (2011) Non-coding RNAs in human disease. Nat Rev Genet 12 : 861–874.
47. SpizzoR, AlmeidaMI, ColombattiA, CalinGA (2012) Long non-coding RNAs and cancer: a new frontier of translational research? Oncogene 31 : 4577–4587.
48. PrensnerJR, ChinnaiyanAM (2011) The emergence of lncRNAs in cancer biology. Cancer Discov 1 : 391–407.
49. ReisEM, Verjovski-AlmeidaS (2012) Perspectives of Long Non-Coding RNAs in Cancer Diagnostics. Front Genet 3 : 32.
50. GutschnerT, DiederichsS (2012) The Hallmarks of Cancer: A long non-coding RNA point of view. RNA Biol 9 : 703–719.
51. PfafflMW (2001) A new mathematical model for relative quantification in real-time RT-PCR. Nucleic Acids Res 29: e45.
52. TrapnellC, PachterL, SalzbergSL (2009) TopHat: discovering splice junctions with RNA-Seq. Bioinformatics 25 : 1105–1111.
53. TrapnellC, WilliamsBA, PerteaG, MortazaviA, KwanG, et al. (2010) Transcript assembly and quantification by RNA-Seq reveals unannotated transcripts and isoform switching during cell differentiation. Nat Biotechnol 28 : 511–515.
54. CappellenD, SchlangeT, BauerM, MaurerF, HynesNE (2007) Novel c-MYC target genes mediate differential effects on cell proliferation and migration. EMBO Rep 8 : 70–76.
55. ByunJS, WongMM, CuiW, IdelmanG, LiQ, et al. (2009) Dynamic bookmarking of primary response genes by p300 and RNA polymerase II complexes. Proc Natl Acad Sci U S A 106 : 19286–19291.
56. Lewis-WambiJS, CunliffeHE, KimHR, WillisAL, JordanVC (2008) Overexpression of CEACAM6 promotes migration and invasion of oestrogen-deprived breast cancer cells. Eur J Cancer 44 : 1770–1779.
57. PellegriniM, ChengJC, VoutilaJ, JudelsonD, TaylorJ, et al. (2008) Expression profile of CREB knockdown in myeloid leukemia cells. BMC Cancer 8 : 264.
58. IrizarryRA, Ladd-AcostaC, WenB, WuZ, MontanoC, et al. (2009) The human colon cancer methylome shows similar hypo - and hypermethylation at conserved tissue-specific CpG island shores. Nat Genet 41 : 178–186.
59. MoraesMC, de AndradeAQ, CarvalhoH, GuechevaT, AgnolettoMH, et al. (2012) Both XPA and DNA polymerase eta are necessary for the repair of doxorubicin-induced DNA lesions. Cancer Lett 314 : 108–118.
60. Sambrook J, Russell DW (2001) Molecular cloning : a laboratory manual. Cold Spring Harbor, N.Y.: Cold Spring Harbor Laboratory Press.
Štítky
Genetika Reprodukční medicínaČlánek vyšel v časopise
PLOS Genetics
2013 Číslo 8
Nejčtenější v tomto čísle
- Chromosomal Copy Number Variation, Selection and Uneven Rates of Recombination Reveal Cryptic Genome Diversity Linked to Pathogenicity
- Genome-Wide DNA Methylation Analysis of Systemic Lupus Erythematosus Reveals Persistent Hypomethylation of Interferon Genes and Compositional Changes to CD4+ T-cell Populations
- Associations of Mitochondrial Haplogroups B4 and E with Biliary Atresia and Differential Susceptibility to Hydrophobic Bile Acid
- A Role for CF1A 3′ End Processing Complex in Promoter-Associated Transcription