
The Transcriptome of the Human Pathogen at Single-Nucleotide Resolution
The genome of Trypanosoma brucei, the causative agent of African trypanosomiasis, was published five years ago, yet identification of all genes and their transcripts remains to be accomplished. Annotation is challenged by the organization of genes transcribed by RNA polymerase II (Pol II) into long unidirectional gene clusters with no knowledge of how transcription is initiated. Here we report a single-nucleotide resolution genomic map of the T. brucei transcriptome, adding 1,114 new transcripts, including 103 non-coding RNAs, confirming and correcting many of the annotated features and revealing an extensive heterogeneity of 5′ and 3′ ends. Some of the new transcripts encode polypeptides that are either conserved in T. cruzi and Leishmania major or were previously detected in mass spectrometry analyses. High-throughput RNA sequencing (RNA-Seq) was sensitive enough to detect transcripts at putative Pol II transcription initiation sites. Our results, as well as recent data from the literature, indicate that transcription initiation is not solely restricted to regions at the beginning of gene clusters, but may occur at internal sites. We also provide evidence that transcription at all putative initiation sites in T. brucei is bidirectional, a recently recognized fundamental property of eukaryotic promoters. Our results have implications for gene expression patterns in other important human pathogens with similar genome organization (Trypanosoma cruzi, Leishmania sp.) and revealed heterogeneity in pre-mRNA processing that could potentially contribute to the survival and success of the parasite population in the insect vector and the mammalian host.
Published in the journal:
. PLoS Pathog 6(9): e32767. doi:10.1371/journal.ppat.1001090
Category:
Research Article
doi:
https://doi.org/10.1371/journal.ppat.1001090
Summary
The genome of Trypanosoma brucei, the causative agent of African trypanosomiasis, was published five years ago, yet identification of all genes and their transcripts remains to be accomplished. Annotation is challenged by the organization of genes transcribed by RNA polymerase II (Pol II) into long unidirectional gene clusters with no knowledge of how transcription is initiated. Here we report a single-nucleotide resolution genomic map of the T. brucei transcriptome, adding 1,114 new transcripts, including 103 non-coding RNAs, confirming and correcting many of the annotated features and revealing an extensive heterogeneity of 5′ and 3′ ends. Some of the new transcripts encode polypeptides that are either conserved in T. cruzi and Leishmania major or were previously detected in mass spectrometry analyses. High-throughput RNA sequencing (RNA-Seq) was sensitive enough to detect transcripts at putative Pol II transcription initiation sites. Our results, as well as recent data from the literature, indicate that transcription initiation is not solely restricted to regions at the beginning of gene clusters, but may occur at internal sites. We also provide evidence that transcription at all putative initiation sites in T. brucei is bidirectional, a recently recognized fundamental property of eukaryotic promoters. Our results have implications for gene expression patterns in other important human pathogens with similar genome organization (Trypanosoma cruzi, Leishmania sp.) and revealed heterogeneity in pre-mRNA processing that could potentially contribute to the survival and success of the parasite population in the insect vector and the mammalian host.
Introduction
One of the milestones towards an understanding and possible treatment of human African trypanosomiasis was the publication of the genome sequence of its causative agent, the protozoan parasite Trypanosoma brucei [1]. The availability of the potential coding capacity provided a first opportunity to comprehensively annotate the T. brucei genome. This initial analysis of the 11 megabase-sized chromosomes predicted 9,068 protein-coding genes, including about 900 pseudogenes. As of April 2010, the catalogue of annotated protein-coding genes has increased to 10,533 (TriTrypDB) [2], yet a major challenge remains to identify all authentic genes, including their boundaries. Such information is central to determining the timing and regulation of gene expression in different developmental stages and the identification of functional elements.
The genomes of T. brucei and related trypanosomatids are organized into long unidirectional gene clusters that are transcribed by RNA polymerase II (Pol II) into polycistronic primary transcripts [3]–[6]. However, the sites and mechanism of transcription initiation and termination for protein-coding genes are largely unknown. Individual mRNAs are matured by coupled trans-splicing and polyadenylation [7], [8]. In trans-splicing, the spliced leader RNA (SL RNA) donates the 39-nt SL sequence that is attached to the 5′ end of all mRNAs and provides the 5′ cap structure for the mRNA [9]. This intermolecular splicing mechanism is an ancient trait in eukaryotes and is found in many protozoa, nematodes, chordates and other organisms [10] and involves molecular mechanisms similar to cis-splicing [11]. The sequence signals that determine the trans-splice acceptor site appear to consist only of AG dinucleotide at the site for exon junction preceded by a polypyrimidine tract of varying length [8], [11]–[13]. Additional nucleotides downstream of the splice site appear to modulate the efficiency of trans-splicing [12], [14], however, only a few cases have been studied. Trans-splicing is spatially and temporally coupled to polyadenylation of the upstream mRNA in the polycistron [7], [8], [15]. Poly(A) tail addition has been shown to occur at one of several closely spaced positions with a possible preference for A residues, based on a limited set of cDNAs [13]. Computational approaches have been used to predict trans-splice and polyadenylation sites in T. brucei [13], [16] and when we started this study, there were no comprehensive studies of bona fide pre-mRNA processing sites in trypanosomatids. Thus, the emergence of next-generation sequencing technologies offered a unique opportunity to provide a complete catalogue of 5′ and 3′ end processing sites and to validate the annotated features of the T. brucei genome at the transcript level. In the current study, as well as in a recent publication by Siegel et al. [17], high-throughput RNA sequencing (RNA-Seq) was used to generate a T. brucei transcriptome map at single-nucleotide resolution.
Results
Data sets obtained by RNA-Seq
To map transcribed regions in T. brucei on a genome-wide scale, we used the RNA-Seq approach [18]. Starting with poly(A)+ RNA isolated from insect-form (culture-form adapted) T. brucei rhodesiense YTat 1.1 [19], double-stranded cDNA was generated conventionally with either random hexadeoxynucleotide or oligo(dT) primers (Figure 1A). We sequenced four libraries, namely two biological samples, each random-primed and oligo(dT)-primed (RNA-Seq data from this study have been submitted to the NCBI Sequence Read Archive - SRA at http://www.ncbi.nlm.nih.gov/Traces/sra/sra.cgi - under accession no. SRA012290). Pair-wise comparison of all sets resulted in Pearson correlation coefficients exceeding 0.99 (Figure S1), thus giving us a total of 30,860,548 sequence reads (Table 1). 25,245,618 reads (82%) aligned to the reference T. brucei brucei TREU 927 genome [1] by allowing up to two mismatches in the first 28 nucleotides (Table 1) with 16,651,856 reads (54%) mapping to a unique region in the genome. As expected based on similar approaches in yeast [20], this strategy resulted in an enrichment of RNA-Seq tags towards the 3′ end of transcripts (Figure 1B). To complement this bias, we took advantage of the unique structure of trypanosome mRNAs and devised a modified procedure for RNA-Seq. Briefly, total RNA was depleted of rRNAs by treatment with Terminator exonuclease, first-strand cDNA synthesis was performed with random hexamers and we then used the SL sequence present at the 5′ end of all trypanosome mRNAs to generate double-stranded cDNA with an SL-specific primer (Figure 1A). Three technical replicates were sequenced (Pearson correlation coefficients of 0.9) resulting in 33,338,202 total reads with 31,794,274 reads (95%) aligning to the genome (Table 1) with a clear preference for the 5′ end of transcripts (Figure 1B). Even though our RNA-Seq tags were obtained from a closely related Trypanosoma subspecies, overall 89% of the sequences aligned to the reference T. brucei brucei TREU 927 genome (Table 1). Furthermore, none of the tags aligned to the gene coding for the Tn10 transposase (Figure S2), which is present in the genome sequence assembly, but is the result of an artifact of BAC construction and thus is not a part of the genome [1].


Mining RNA-Seq data for gene boundaries and RNA levels
To map 5′ - and 3′-end boundaries of trypanosome transcripts, we inspected the aligned data for regions of rapid changes in the abundance of RNA-Seq tags. In addition, our annotation was aided by the availability of end tags, i.e. 2,434,466 SL - and 328,881 poly(A)-containing reads (Table 1). This strategy allowed the precise mapping of both ends of 8,960 mRNA molecules with representative examples shown in Figure 1B. 898 previously annotated genes had very few reads and thus we were unable to precisely define their transcript boundaries. Most genes in this group are subtelomeric variant surface glycoprotein genes and pseudogenes (620), expression site-associated genes and pseudogenes (104), as well as unlikely ORFs, sequence orphans and conserved proteins (174). Our 5′-end mapping identified 532 genes (5.9% of all genes) with misannotated translation start codons (Figure 1C, Figure S3 and listed in Table S1) and RT-PCR experimentally confirmed that the ORFs of two genes on chromosome VIII were indeed shorter than currently annotated (Figure S3C). Furthermore, 805 annotated genes (not included in the total number of genes) did not produce a transcript of their own (Table S2), but were often part of the 5′UTR or 3′UTR of a transcript from a neighboring gene (Figure 1D and Figure S4), which we corroborated by Northern blot analysis for two such scenarios (Figure S4C).
We identified 441 genes that have unambiguous alternative processing in the 5′UTR (47 genes) or 3′UTR (394 genes), thus generating a full-length transcript, as well as a shorter ORF-containing and a putative non-coding transcript (Figures 1E and S5 and listed in Table S3). For instance, Tb927.4.4370 and Tb927.4.4490 fall into this category and by Northern blot analysis three distinct transcripts, as predicted by RNA-Seq, are easily detectable (Figure S5C). The functional significance of the UTR-internal transcripts remains to be investigated, since they have limited coding potential (Figure S6E) and it was inconclusive whether one such transcript derived from the 3′UTR of Tb927.4.4370 was associated with polyribosomes (Figure S6B).
The genome assembly of T. brucei lists four putative introns with two being experimentally validated [21], [22]. Using the program TopHat [23], which aims to identify splice junctions, and confirmed by manual inspection, we only detected the experimentally validated introns in the genes for poly(A) polymerase (Tb927.3.3160) and an ATP-dependent DEAD/H RNA helicase (Tb927.8.1510) and found no evidence for additional introns in the T. brucei genome (data not shown) in line with a similar conclusion by Siegel et al. [17].
Our data also shed light on the synthesis of annotated small nucleolar RNAs (snoRNAs), whose genes are always oriented in the same direction as neighboring protein coding genes and are known to be transcribed by Pol II [24], [25]. It appeared that snoRNAs are initially produced as long precursors with mRNA features, i.e. SL at the 5′ end and a poly(A) tail at the 3′ end, and these precursors may contain one or more snoRNA sequences. We noticed 27, 9 and 5 instances where snoRNAs mapped in 3′UTRs, predicted ORFs and 5′UTRs, respectively (Figure S7). Particularly intriguing is the scenario where 7 snoRNAs are embedded in the ORF of Tb927.3.1900 (Figure S7C), since these snoRNAs are expressed [25] and the predicted protein was detected in two separate proteomic analyses [26], [27]. This unusual organization will need to be investigated further.
The above mapping of gene boundaries provided a platform to delineate and measure 5′ and 3′UTRs (Tables S4 and S5). The median length of 5′UTRs in T. brucei is 130 nt with a range from 39, with the SL abutting the initiation codon, to ∼2,500 nt (Figure 2A), whereas a similar analysis of 3′UTRs revealed a median length of 388 nt with a range of 10 to ∼6,000 nt (Figure 2B). The median lengths are in agreement with those described in Siegel et al. [17] of 128 nt and 400 nt for the 5′ and 3′UTRs, respectively. It is important to point out that in this study the 39-nt SL was included in the 5′UTR length calculation, whereas Siegel et al. opted to exclude the SL from their analysis [17].

Furthermore, by taking advantage of the quantitative nature of RNA-Seq [18], we were able to estimate RNA levels in the insect-form T. brucei rhodesiense YTat 1.1 strain (Table S6). We determined the signal in a 500-bp window immediately downstream of the first trans-splice site and, using the measured PGKB mRNA level as a reference point [28], we estimated that 75% of the genes generate between 1 and 10 mRNA molecules per cell (Figure S8). Our copy number estimates (median is 3 mRNAs per cell) for cultured procyclic T. brucei are comparable to data obtained for yeast [29], [30] and mammals [31].
Novel coding and non-coding RNAs
We detected 1,114 new transcripts (12% of total) not originating from a previously annotated ORF (Table S7). They are trans-spliced and polyadenylated and the range of size and expression level closely resembles that of transcripts mapped to annotated ORFs (Figures 1F, 2 and S9 and Table S7). Setting a lower limit of 25 amino acids, 1,011 transcripts have the potential to encode one or more ORF with a considerable number having a predicted signal peptide (4.2%). In particular, 27 newly identified transcripts contain ORFs that are conserved and annotated in T. cruzi and/or Leishmania major (Table S8) and an additional 23 new transcripts encode potential polypeptides that are conserved, but not annotated in T. cruzi and/or L. major (Table S9). For instance, three novel transcripts on chromosome VIII, clearly detectable by Northern blot analysis, encode ribosomal protein L41 and two newly mapped transcripts on chromosome XI encode polypeptides that are conserved, but not annotated in T. cruzi and L. major (Figure S9). Tb10.NT.122 is a novel transcript on chromosome X with the longest predicted ORF encoding 32 amino acids. This transcript co-sedimented with polyribosomes on a sucrose density gradient and shifted to lighter fractions under conditions where translation was inhibited (Figure S6C), indicating a likely association with the translational apparatus. Finally, by searching the proteome data set of Panigrahi et al. that did not map to annotated genes [32], we identified 19 novel transcripts where the predicted ORF had one or more matches with peptides identified by mass spectrometry (Table S10), thus providing evidence that at least some of these new proteins are made.
Of the 1,114 novel transcripts, 9.2% (103) did not contain ORFs 25 amino acids or longer and ranged in size from 154 nt to 2,229 nt (Table S11). Although some of these transcripts might potentially code for a peptide, since the shortest verified coding sequence in eukaryotes is 33 nt, i.e. 11 amino acids [33], [34], it is worth noting that the six largest transcripts, each longer than 1,000 nt, have no coding potential at all (Table S11).
Heterogeneity of RNA processing sites
The depth of our coverage of 5′ end tags (Table 1) allowed us to expose a genome-wide picture of trans-splice sites, which turned out to be quite promiscuous (Figure 3A). Out of the 8,592 transcripts with at least 10 SL tags at the primary site, only 926 (11%) had a single site for SL addition, whereas 5,327 transcripts (62%) had between two and four 3′ trans-splice sites and 2,339 transcripts (27%) had five or more sites (Figures 3A and B). Additional sites were mainly located downstream of the primary site (Figure 3A) and occasionally mapped within the 5′ region of ORFs (Table S12). To validate this unexpected result, we first inspected trans-splice site usage at the α-tubulin gene (Figure S10). The most prominent site mapped by RNA-Seq coincided with the site identified by previous analysis of cDNAs, but minor sites were also evident. Next, we selected four genes representing the spectrum of heterogeneity and cDNAs generated by RT-PCR reproduced the multiple or highly homogenous SL addition sites seen by RNA-Seq (Figure S11).
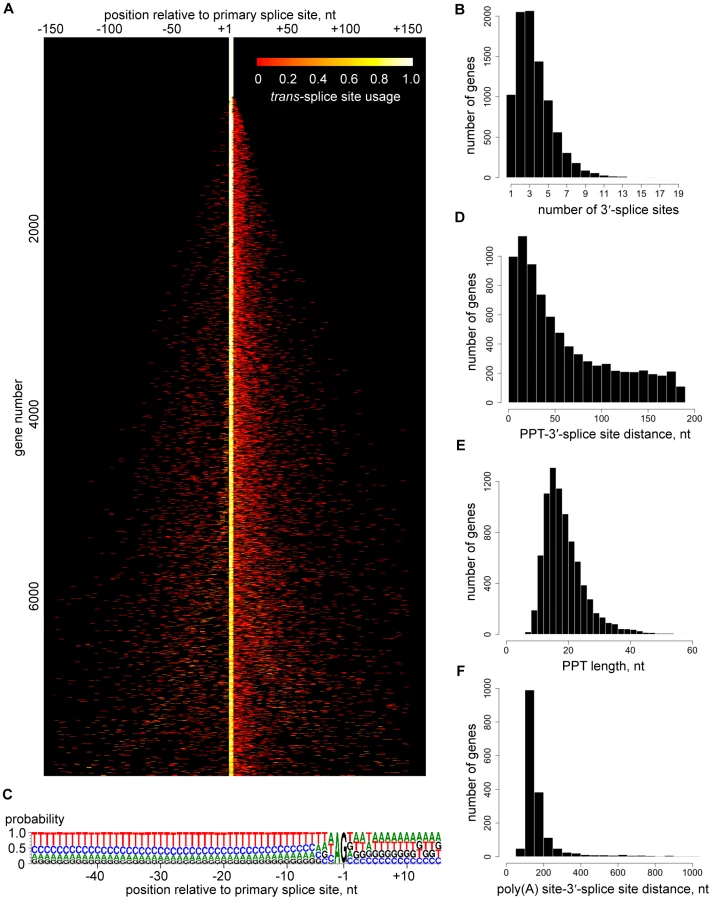
We were unable to identify any significant difference in the sequence signatures surrounding homogeneous and heterogeneous splice sites (data not shown) and there was only a very limited correlation between splice site heterogeneity and abundance of the corresponding transcript (data not shown). The only highly conserved sequence signals that appeared to define a 3′-trans-splice site in T. brucei are the well-known AG dinucleotide immediately upstream and the polypyrimidine tract (PPT) further upstream of the splice site, as well as the exclusion of G residues at position -3 (Figure 3C), which has been suspected previously [12]. An AG dinucleotide was found at 98% of the major splice sites, whereas minor sites had an AG in 75% of the cases (Figure 3C and Table S4). At present we do not know whether this observation is of functional significance. Since two major sites with an apparent AA or GG dinucleotide in the 927 genome reference strain turned out to have bona fide AG splice acceptor sites in our strain used for RNA-Seq (data not shown), we cannot exclude the possibility that many of these variant non-AG sites are due to strain differences. The PPT starts 0 to ∼200 nt (median is 43) upstream of the splice site (Figures 3C and 3D), its median length is 18 nt with a range from 7 to 79 nt (Figure 3E) and its composition showed a clear preference for Ts over Cs (Figure 3C), in agreement with a comprehensive mutagenesis study [12]. The median distance between the trans-splice site and the upstream polyadenylation site is 142 nt and in 50% of the cases is between 123 and 178 nt (Figure 3F), highlighting the tight spatial coupling of the two RNA processing events [7], [8].
Polyadenylation sites (PAS) in T. brucei transcripts appeared even more heterogeneous than trans-splice sites (Figure 4A and Table S13). A representative example is shown in Figure S10, where the processing sites in between the β and α-tubulin genes are summarized. The most prominent RNA-Seq sites correlated with experimental data [8], but this methodology also revealed an unanticipated extent of heterogeneity. The heterogeneity in 3′-end formation was not too surprising, since it is known that a poly(A) tail can be added at any one of several closely spaced positions [8], [13]. Polyadenylation occurs preferentially at an A residue (before or after; our data cannot distinguish) in the transcript that is often followed by a second A, and our results showed a preference for T-rich sequence in the vicinity of the site for poly(A) tail addition (Figure 4B).

RNA-Seq tags map putative Pol II transcription initiation sites
An intriguing observation was the presence of a limited number of polyadenylated transcripts that appeared to be significantly underrepresented or even absent in our SL library data sets. In particular, these transcripts mapped closely to regions in the genome previously identified as putative Pol II transcription initiation sites [4], [35], [36], namely strand-switch regions of divergent transcription units, the beginning of Pol II transcription units that neighbor tRNA genes, shown previously to be strong stops for Pol II [37], as well as a few other regions within transcription units (Figures 5A, B and C). Such transcripts can be detected as heterogeneous species by Northern blotting (Figure 5D) and a large fraction of them appeared to be uncapped and have a single phosphate at their 5′ end, as judged by their susceptibility to degradation by Terminator exonuclease (a 5′ monophosphate-dependent enzyme) and alleviation of this susceptibility by a preceding phosphatase treatment (compare lanes 2, 8 and 12 in Figure 5E). In contrast, at most suspected ends of Pol II transcription units, we detected transcripts of extremely low abundance, i.e. less than one molecule per cell, that possess a SL sequence, but lack poly(A) tails, as judged by their absence in our poly(A)-enriched libraries (data not shown). [The transcripts without SL sequence or a poly(A) tail were not included in the total number of genes or in the number of novel transcripts.] Transcripts present near putative Pol II start sites lacking the SL but containing a poly(A) tail, as well as those with an SL but missing the poly(A) tail at possible Pol II termination sites, are best explained by the known coupling of trans-splicing and polyadenylation [7], [8]. For example, trans-splicing of the first mRNA in a polycistronic transcript will by default result in the polyadenylation of the upstream RNA and thus generate the transcripts we detected.

The SL-lacking RNAs described above could represent remnants of primary Pol II transcripts, i.e. RNA fragments from the very 5′ end of long polycistronic precursors that have either been processed by an unknown mechanism to expose a 5′-monophosphate or have been subjected to trimming of their triphosphate ends to a 5′-monophosphate. To explore this possibility, we generated and sequenced a cDNA library enriched for 5′-triphosphate RNA ends, the hallmark of a 5′ end generated by an RNA polymerase (Figure S12). The validity of our protocol was underscored by correctly mapping the transcription initiation site of the EP1 procyclin gene (Figure 6). Corroborating our hypothesis, RNA-Seq tags were again enriched in regions of the genome implicated to be sites for transcription initiation by Pol II (Figure 7A). In particular, this enrichment was observed at all sites suspected to act as Pol II promoters based on the accumulation of specifically modified and variant histones [36], i.e. primarily at every divergent transcription unit (Figure 7B and Table S14), at regions located at the beginning of transcription units in proximity to tRNA genes (Figure 7C and Table S14), as well as at internal sites within transcription units (Figure 7D and Table S14). One common theme of all regions was that they showed enrichment of not only sense, but also antisense 5′-triphosphate RNA-derived reads (in contrast to a Pol I transcription unit, Figure 6), suggesting that these putative Pol II transcription initiation sites are intrinsically bi-directional.


Discussion
The current annotation of the T. brucei genome relied heavily on bioinformatic approaches, since to date a mere 5,133 ESTs are available. Thus, our initial goal in the work presented here was to map gene boundaries at the transcript level and to provide experimental support for annotated features. We used RNA-Seq to generate a T. brucei transcriptome map at single-nucleotide resolution and confirmed many of the gene models, but also uncovered numerous cases of misannotated translation initiation codons, annotated ORFs not producing a distinct transcript and an abundance of novel transcripts, including ones which appear to be non-coding. Remarkably, we were also able to map, on a genome-wide scale, putative Pol II transcription start sites in T. brucei (summarized in Table S14). Our results corroborate a recent study where it was shown that such chromosome locations are marked by specifically modified and variant histones [35], [36]. In addition, we detected both sense and antisense transcription originating from these genome loci, with sense transcripts at higher levels than antisense (Figure 7). This finding matches a scenario described for mammalian CpG promoters [38]–[40], where transcription is divergent and initiates over a broad genomic region. Moreover, our RNA-Seq data for 5′-triphosphate-enriched RNAs showed reads mapping throughout Pol II transcription units in the sense and antisense orientation (Figure S13) and thus, we cannot exclude the possibility that these are actual transcription initiation sites similar to the ones described in exons/3′ UTRs in mammals [38].
One of the major benefits of RNA-Seq is its capability to accurately determine transcript boundaries. Our mapping of conventional 5′ and 3′ ends of T. brucei mRNAs revealed an abundant heterogeneity in trans-splice and polyadenylation sites. Whereas the heterogeneity of poly(A)-addition sites was somewhat anticipated [8], [13] and to a lesser extent this scenario has been observed as local heterogeneity of polyadenylation positions in yeast [20] and mammals [41], [42], the degree of variability we encountered for trans-splice sites was quite unexpected. Although trans - and cis-splicing are mechanistically related, our finding highlights a fundamental difference between these two processes. Cis-splicing occurs predominantly within ORFs [43] and, thus, is subjected to evolutionary pressure to maintain an intact coding sequence. This apparent accuracy of intron excision is likely accompanied by rapid destruction of aberrantly spliced mRNAs by the nonsense-mediated decay pathway [44]. In contrast, trans-splicing mainly takes place upstream of ORFs and appears to follow more relaxed rules for the selection of a nucleotide for the second trans-esterification reaction of splicing. As a consequence, the observed heterogeneity in T. brucei of both trans-splicing and polyadenylation generates a collection of mRNAs with the same coding potential, but with UTRs (3′ or 5′) of varying length, sometimes in the order of hundreds of nucleotides. This fluidity in generating mRNA ends is quite unusual, particularly in an organism where the regulation of gene expression has been attributed to occur mainly at the post-transcriptional level [3], [6]. Importantly, the degree of heterogeneity of both trans-splicing and polyadenylation varies and different genes exhibit RNA processing patterns spanning from one extreme - a single detectable processing site - to the other, where no single site is used preferentially (Figure 8).

Overall, our data set is in good agreement with that of Siegel et al. [17]. The overlap between the mapped trans-splice sites is excellent with most genes having a very high correlation (Figure S14A). There is a weak overlap between the polyadenylation sites (Figure S14B). This is most likely a reflection of the inherent difficulty to identify PAS due to the pervasive heterogeneity (Figure 4) and the prevalence of low-complexity sequences in the 3′UTR. Thus, our stringent filtering only yielded 2,081 PAS assignments with confidence (Figure 4). Finally, the mRNA abundance comparison (for the 6,728 transcripts present in both studies) is good with a Pearson correlation coefficient of 0.697 (Figure S15), considering the different T. brucei subspecies, as well as differences in culture conditions, mRNA isolation procedures, RNA-Seq cDNA library preparation protocols and methods of estimating the abundance.
Evidence and theorization over the past decade has resulted in a widespread appreciation of the benefits of stochastic models of gene expression over purely deterministic ones [45]–[47]. We estimate that 75% of T. brucei genes are expressed at levels between 1 and 10 mRNAs per procyclic cell (Figure S8). In addition, it is evident from our data and corroborated by Siegel et al. [17] that the majority of genes produce different transcript forms created by heterogeneity in trans-splicing and polyadenylation and bearing or lacking 5′ and/or 3′ UTR sequences that could influence the efficiency of RNA stability and/or translation. The possibility for regulation of pre-mRNA processing site choice clearly exists, however it remains to be seen whether alternative splicing or polyadenylation are part of a regulated process. Since transcription is one of the main intrinsic noise sources [47] and Pol II transcription in trypanosomatids appears to be uniform across individual polycistronic transcription units (and likely the entire Pol II transcriptome), heterogeneity in the sites for pre-mRNA processing provides an additional source of intrinsic stochasticity to compensate for the uniformity in transcription. Interestingly, it appears that heterogeneity of trans-splicing is a specific characteristic of trypanosomatids, since it was not described in the transcriptome analysis of the nematode Caenorhabditis elegans [48], an organism with prevalent trans-splicing in which most trans-spliced genes are individually transcribed [49]. Our results have implications for gene expression patterns in other important human pathogens and point to heterogeneity in pre-mRNA processing (rather than transcription) as the main intrinsic source of stochasticity in gene expression for these protozoan parasites.
Methods
3′ end-enriched libraries
Total RNA was treated with RQ1 RNase-free DNase I and subjected to two rounds of poly(A)+ selection. First strand cDNA synthesis was initiated with random hexadeoxynucleotide primers or 5′-T15VN-3′ oligonucleotide. After incubation with RNase H and E. coli DNA polymerase I, double-stranded cDNA was fragmented with DNase I and cDNA fragments corresponding in size to about 200 bp were size-selected on an agarose gel. The cDNA ends were repaired, a single dA was added at the 3′ ends and genomic adapters (Illumina, Inc. All rights reserved.) were added. Libraries were enriched by limited PCR and purified on an agarose gel.
5′ end-enriched libraries
Total RNA was treated with Terminator 5′-monophosphate-dependent exonuclease, followed by DNase I and first strand cDNA synthesis was initiated with random primers. Second strand cDNA synthesis was primed with the SL Primer (5′-GCTATTATTAGAACAGTTTCTGTACTATATTG-3′) and platinum Pfx DNA polymerase. cDNA was further processed as described above.
5′-triphosphate-end-enriched libraries
Total RNA was subjected to two rounds of poly(A)+ selection and treated with Terminator 5′-phosphate-dependent exonuclease. Next, the RNA was treated with RNA 5′-polyphosphatase and a 5′ adapter with a BpuE I restriction site (5′-GCACCATATAACCGCTTCCrUrUrGrArG-3′) was ligated to the available 5′-monophosphate ends. Following first strand cDNA synthesis as described above, double-starnded cDNA was generated with a BpuE I Primer (5′-GCACCATATAACCGCTTCCTTGAG-3′) and Pfx DNA polymerase. DNA fragments larger than 100 bp were gel purified, digested with BpuE I in the presence of S-adenosylmethionine. The DNA was separated on an agarose gel and several gel segments spanning the ∼130 bp size range were excised and processed for Illumina sequencing.
Enzyme assays for RNA 5′-end analysis
Reactions with 5′-end-modifying enzymes were performed in a volume of 40 µL with 14 µg total RNA with 40 U RNA 5′-polyphosphatase, 40 U tobacco acid pyrophosphatase, 10 U T4 polynucleotide kinase plus 1 mM ATP, or 1 U alkaline phosphatase. After the appropriate incubation, reactions were divided into two tubes and one aliquot was treated with 1 U Terminator 5′-phosphate-dependent exonuclease and the second aliquot served as a control. Reverse transcription with random hexamers was performed and the resulting cDNA was used as a template for PCR with forward and reverse primers specific for the transcripts of interest.
Processing of 5′ end reads
Over 2.5 million reads from the SL-primed library contained the entire splice-leader sequence at their 5′ ends. This sequence was removed, leaving 43 nucleotides, and the first 28 nucleotides were aligned to the genome reference, with a maximum of 2 allowed mismatches and one alignment reported per read. Unless indicated, all read manipulations, as well as the genome-wide site analyses, were performed with custom scripts written either in Perl or for a combination of the R statistical software with the bioinformatics-centric Bioconductor tools installed.
Processing of 3′ end reads
Reads consisting primarily of A or T nucleotides (more than 31 out of 35 total nucleotides) were removed from the 3′ end-enriched libraries. Next, contiguous A or T stretches, 5–15 letters long, were trimmed off the 5′ or 3′ ends of the sequences, respectively. Trimmed reads, ranging in length from 15–30 nucleotides, represented putative 3′ end-reads and were aligned to the genome reference. In order to distinguish poly(A) tails from RNA transcribed from contiguous As in the genome, alignments were only considered to represent polyadenylation sites, if the end-read contained a longer stretch of A's than was present in the genome.
Analysis of 5′-triphosphate-end-enriched libraries
Preparation of the 5′-triphosphate-end-enriched library produced two sets of reads, categorized by the position of the 14-nt sequence representing the 5′ transcript end (the “end-sequence”). The first set, corresponding to the top strand contained the 24 nt adapter (GCACCATATAACCGCTTCCTTGAG) at the beginning of the read, followed by the end-sequence, spanning nucleotides 25 through 38. The second set contained reverse complement of the end-sequence in the left-most 14 nt, followed by the same reverse complement of the 24 nt adapter. These 14 nt end sequences were extracted from the two sets of reads, and the second set was reverse complemented, to produce the end-reads. Alignment to the genome was with no mismatches allowed, and one alignment reported per read.
Alignment and interactive analysis of RNA-Seq data
Sequence reads obtained from the Illumina GA2 platform, ranging from 35–75 nucleotides in length, were aligned to the eleven major chromosomes in the T. brucei genome sequence, version 4 (genedb.org). All alignments were conducted with Bowtie [50]. Alignments were only considered if they contained fewer than two mismatches in the first 28 nucleotides of the alignment. For transcript-end analyses, end-reads were first identified then trimmed before alignment. Reads reporting multiple alignments were retained and aligned pseudo-randomly (according to Bowtie's default method). Processed RNA-Seq reads, including end-tags, were loaded into a customized, local installation of the Generic Genome Browser [51] for interactive annotation and analysis of transcript ends and novel transcriptome features.
Measurement of transcript abundance
A relative measure of transcript abundance was derived from the number of reads (not including end-reads) that aligned within a 500-nucleotide window, extending into the gene from the 5′ end of the transcript for the SL-library and from the 3′ end for the poly(A) library.
Polypyrimidine tract calculations
The polypyrimidine tract was identified as the longest stretch of pyrimidines separated by no more than one purine in a 200 nt window upstream of the splice site with the maximal number of reads.
Transcript-end calculations
We eliminated from the analysis transcripts in which the maximal number of reads per splice site was less than 10. We developed a metric, dispersion, to capture and summarize the positional information about the splice sites of each gene. Essentially, dispersion is the weighted average of the distance between each site to the most popular site:
Assume a gene has N splice sites. Define ci as the number of reads of site i and ri as the position of the site. Denote and let i* represent the splice site with the maximal number of reads. The splicing dispersion is then defined as:
Similarly, the average 5′ UTR length is the weighted average of the distance of all splice sites from the start codon. Symbolically:
if the position of the start codon is rs, the average 5′UTR is:
For UTR analyses, except where noted, splice sites downstream of the annotated start codon are not included in the sum (and C is the sum only over splice sites upstream of the start codon). Misannotated or unannotated transcripts were not considered for this analysis. We used a similar approach for analysis of polyadenylation sites, 3′UTRs.
Additional methods can be found in Supporting Information S1.
Supporting Information
Zdroje
1. BerrimanM
GhedinE
Hertz-FowlerC
BlandinG
RenauldH
2005 The genome of the African trypanosome Trypanosoma brucei. Science 309 416 422
2. AslettM
AurrecoecheaC
BerrimanM
BrestelliJ
BrunkBP
2010 TriTrypDB: a functional genomic resource for the Trypanosomatidae. Nucleic Acids Res 38 D457 462
3. ClaytonCE
2002 Life without transcriptional control? From fly to man and back again. EMBO J 21 1881 1888
4. Martinez-CalvilloS
YanS
NguyenD
FoxM
StuartK
2003 Transcription of Leishmania major Friedlin chromosome 1 initiates in both directions within a single region. Mol Cell 11 1291 1299
5. Martinez-CalvilloS
NguyenD
StuartK
MylerPJ
2004 Transcription initiation and termination on Leishmania major chromosome 3. Eukaryot Cell 3 506 517
6. PalencharJB
BellofattoV
2006 Gene transcription in trypanosomes. Mol Biochem Parasitol 146 135 141
7. LeBowitzJH
SmithHQ
RuscheL
BeverleySM
1993 Coupling of poly(A) site selection and trans-splicing in Leishmania. Genes Dev 7 996 1007
8. MatthewsKR
TschudiC
UlluE
1994 A common pyrimidine-rich motif governs trans-splicing and polyadenylation of tubulin polycistronic pre-mRNA in trypanosomes. Genes Dev 8 491 501
9. PerryKL
WatkinsKP
AgabianN
1987 Trypanosome mRNAs have unusual “cap 4” structures acquired by addition of a spliced leader. Proc Natl Acad Sci U S A 84 8190 8194
10. HastingsKE
2005 SL trans-splicing: easy come or easy go? Trends Genet 21 240 247
11. LiangXH
HaritanA
UlielS
MichaeliS
2003 Trans and cis splicing in trypanosomatids: mechanism, factors, and regulation. Eukaryot Cell 2 830 840
12. SiegelTN
TanKS
CrossGA
2005 Systematic study of sequence motifs for RNA trans splicing in Trypanosoma brucei. Mol Cell Biol 25 9586 9594
13. BenzC
NilssonD
AnderssonB
ClaytonC
GuilbrideDL
2005 Messenger RNA processing sites in Trypanosoma brucei. Mol Biochem Parasitol 143 125 134
14. Lopez-EstranoC
TschudiC
UlluE
1998 Exonic sequences in the 5′ untranslated region of alpha-tubulin mRNA modulate trans splicing in Trypanosoma brucei. Mol Cell Biol 18 4620 4628
15. UlluE
MatthewsKR
TschudiC
1993 Temporal order of RNA-processing reactions in trypanosomes: rapid trans splicing precedes polyadenylation of newly synthesized tubulin transcripts. Mol Cell Biol 13 720 725
16. GopalS
AwadallaS
GaasterlandT
CrossGA
2005 A computational investigation of kinetoplastid trans-splicing. Genome Biol 6 R95
17. SiegelTN
HekstraDR
WangX
DewellS
CrossGA
2010 Genome-wide analysis of mRNA abundance in two life-cycle stages of Trypanosoma brucei and identification of splicing and polyadenylation sites. Nucleic Acids Res In press
18. WangZ
GersteinM
SnyderM
2009 RNA-Seq: a revolutionary tool for transcriptomics. Nat Rev Genet 10 57 63
19. RubenL
EgwuaguC
PattonCL
1983 African trypanosomes contain calmodulin which is distinct from host calmodulin. Biochim Biophys Acta 758 104 113
20. NagalakshmiU
WangZ
WaernK
ShouC
RahaD
2008 The transcriptional landscape of the yeast genome defined by RNA sequencing. Science 320 1344 1349
21. IvensAC
PeacockCS
WortheyEA
MurphyL
AggarwalG
2005 The genome of the kinetoplastid parasite, Leishmania major. Science 309 436 442
22. MairG
ShiH
LiH
DjikengA
AvilesHO
2000 A new twist in trypanosome RNA metabolism: cis-splicing of pre-mRNA. RNA 6 163 169
23. TrapnellC
PachterL
SalzbergSL
2009 TopHat: discovering splice junctions with RNA-Seq. Bioinformatics 25 1105 1111
24. DunbarDA
ChenAA
WormsleyS
BasergaSJ
2000 The genes for small nucleolar RNAs in Trypanosoma brucei are organized in clusters and are transcribed as a polycistronic RNA. Nucleic Acids Res 28 2855 2861
25. LiangXH
UlielS
HuryA
BarthS
DonigerT
2005 A genome-wide analysis of C/D and H/ACA-like small nucleolar RNAs in Trypanosoma brucei reveals a trypanosome-specific pattern of rRNA modification. RNA 11 619 645
26. BridgesDJ
PittAR
HanrahanO
BrennanK
VoorheisHP
2008 Characterisation of the plasma membrane subproteome of bloodstream form Trypanosoma brucei. Proteomics 8 83 99
27. BroadheadR
DaweHR
FarrH
GriffithsS
HartSR
2006 Flagellar motility is required for the viability of the bloodstream trypanosome. Nature 440 224 227
28. HaanstraJR
StewartM
LuuVD
van TuijlA
WesterhoffHV
2008 Control and regulation of gene expression: quantitative analysis of the expression of phosphoglycerate kinase in bloodstream form Trypanosoma brucei. J Biol Chem 283 2495 2507
29. VelculescuVE
ZhangL
ZhouW
VogelsteinJ
BasraiMA
1997 Characterization of the yeast transcriptome. Cell 88 243 251
30. HolstegeFC
JenningsEG
WyrickJJ
LeeTI
HengartnerCJ
1998 Dissecting the regulatory circuitry of a eukaryotic genome. Cell 95 717 728
31. CarterMG
SharovAA
VanBurenV
DudekulaDB
CarmackCE
2005 Transcript copy number estimation using a mouse whole-genome oligonucleotide microarray. Genome Biol 6 R61
32. PanigrahiAK
OgataY
ZikovaA
AnupamaA
DalleyRA
2009 A comprehensive analysis of Trypanosoma brucei mitochondrial proteome. Proteomics 9 434 450
33. KondoT
HashimotoY
KatoK
InagakiS
HayashiS
2007 Small peptide regulators of actin-based cell morphogenesis encoded by a polycistronic mRNA. Nat Cell Biol 9 660 665
34. GalindoMI
PueyoJI
FouixS
BishopSA
CousoJP
2007 Peptides encoded by short ORFs control development and define a new eukaryotic gene family. PLoS Biol 5 e106
35. ThomasS
GreenA
SturmNR
CampbellDA
MylerPJ
2009 Histone acetylations mark origins of polycistronic transcription in Leishmania major. BMC Genomics 10 152
36. SiegelTN
HekstraDR
KempLE
FigueiredoLM
LowellJE
2009 Four histone variants mark the boundaries of polycistronic transcription units in Trypanosoma brucei. Genes Dev 23 1063 1076
37. MarchettiMA
TschudiC
SilvaE
UlluE
1998 Physical and transcriptional analysis of the Trypanosoma brucei genome reveals a typical eukaryotic arrangement with close interspersionof RNA polymerase II - and III-transcribed genes. Nucleic Acids Res 26 3591 3598
38. CarninciP
SandelinA
LenhardB
KatayamaS
ShimokawaK
2006 Genome-wide analysis of mammalian promoter architecture and evolution. Nat Genet 38 626 635
39. SeilaAC
CalabreseJM
LevineSS
YeoGW
RahlPB
2008 Divergent transcription from active promoters. Science 322 1849 1851
40. CoreLJ
WaterfallJJ
LisJT
2008 Nascent RNA sequencing reveals widespread pausing and divergent initiation at human promoters. Science 322 1845 1848
41. PauwsE
van KampenAH
van de GraafSA
de VijlderJJ
Ris-StalpersC
2001 Heterogeneity in polyadenylation cleavage sites in mammalian mRNA sequences: implications for SAGE analysis. Nucleic Acids Res 29 1690 1694
42. PickrellJK
MarioniJC
PaiAA
DegnerJF
EngelhardtBE
2010 Understanding mechanisms underlying human gene expression variation with RNA sequencing. Nature 464 768 772
43. RoySW
GilbertW
2006 The evolution of spliceosomal introns: patterns, puzzles and progress. Nat Rev Genet 7 211 221
44. ContiE
IzaurraldeE
2005 Nonsense-mediated mRNA decay: molecular insights and mechanistic variations across species. Curr Opin Cell Biol 17 316 325
45. KaernM
ElstonTC
BlakeWJ
CollinsJJ
2005 Stochasticity in gene expression: from theories to phenotypes. Nat Rev Genet 6 451 464
46. KarlebachG
ShamirR
2008 Modelling and analysis of gene regulatory networks. Nat Rev Mol Cell Biol 9 770 780
47. LarsonDR
SingerRH
ZenklusenD
2009 A single molecule view of gene expression. Trends Cell Biol 19 630 637
48. HillierLW
ReinkeV
GreenP
HirstM
MarraMA
2009 Massively parallel sequencing of the polyadenylated transcriptome of C. elegans. Genome Res 19 657 666
49. Consortium CeS 1998 Genome sequence of the nematode C. elegans: a platform for investigating biology. Science 282 2012 2018
50. LangmeadB
TrapnellC
PopM
SalzbergSL
2009 Ultrafast and memory-efficient alignment of short DNA sequences to the human genome. Genome Biol 10 R25
51. SteinLD
MungallC
ShuS
CaudyM
MangoneM
2002 The generic genome browser: a building block for a model organism system database. Genome Res 12 1599 1610
52. BrownSD
HuangJ
Van der PloegLH
1992 The promoter for the procyclic acidic repetitive protein (PARP) genes of Trypanosoma brucei shares features with RNA polymerase I promoters. Mol Cell Biol 12 2644 2652
53. PaysE
CoqueletH
TebabiP
PaysA
JefferiesD
1990 Trypanosoma brucei: constitutive activity of the VSG and procyclin gene promoters. EMBO J 9 3145 3151
54. BendtsenJD
NielsenH
von HeijneG
BrunakS
2004 Improved prediction of signal peptides: SignalP 3.0. J Mol Biol 340 783 795
Štítky
Hygiena a epidemiologie Infekční lékařství LaboratořČlánek vyšel v časopise
PLOS Pathogens
2010 Číslo 9
- Farmakovigilanční studie perorálních antivirotik indikovaných v léčbě COVID-19
- Jak souvisí postcovidový syndrom s poškozením mozku?
- Měli bychom postcovidový syndrom léčit antidepresivy?
- 10 bodů k očkování proti COVID-19: stanovisko České společnosti alergologie a klinické imunologie ČLS JEP
Nejčtenější v tomto čísle
- Structure of the Extracellular Portion of CD46 Provides Insights into Its Interactions with Complement Proteins and Pathogens
- The Length of Vesicular Stomatitis Virus Particles Dictates a Need for Actin Assembly during Clathrin-Dependent Endocytosis
- Inhibition of TIR Domain Signaling by TcpC: MyD88-Dependent and Independent Effects on Virulence
- The Coevolution of Virulence: Tolerance in Perspective