
A Genome-Wide Screen for Interactions Reveals a New Locus on 4p15 Modifying the Effect of Waist-to-Hip Ratio on Total Cholesterol
Recent genome-wide association (GWA) studies described 95 loci controlling serum lipid levels. These common variants explain ∼25% of the heritability of the phenotypes. To date, no unbiased screen for gene–environment interactions for circulating lipids has been reported. We screened for variants that modify the relationship between known epidemiological risk factors and circulating lipid levels in a meta-analysis of genome-wide association (GWA) data from 18 population-based cohorts with European ancestry (maximum N = 32,225). We collected 8 further cohorts (N = 17,102) for replication, and rs6448771 on 4p15 demonstrated genome-wide significant interaction with waist-to-hip-ratio (WHR) on total cholesterol (TC) with a combined P-value of 4.79×10⁻⁹. There were two potential candidate genes in the region, PCDH7 and CCKAR, with differential expression levels for rs6448771 genotypes in adipose tissue. The effect of WHR on TC was strongest for individuals carrying two copies of G allele, for whom a one standard deviation (sd) difference in WHR corresponds to 0.19 sd difference in TC concentration, while for A allele homozygous the difference was 0.12 sd. Our findings may open up possibilities for targeted intervention strategies for people characterized by specific genomic profiles. However, more refined measures of both body-fat distribution and metabolic measures are needed to understand how their joint dynamics are modified by the newly found locus.
Published in the journal:
. PLoS Genet 7(10): e32767. doi:10.1371/journal.pgen.1002333
Category:
Research Article
doi:
https://doi.org/10.1371/journal.pgen.1002333
Summary
Recent genome-wide association (GWA) studies described 95 loci controlling serum lipid levels. These common variants explain ∼25% of the heritability of the phenotypes. To date, no unbiased screen for gene–environment interactions for circulating lipids has been reported. We screened for variants that modify the relationship between known epidemiological risk factors and circulating lipid levels in a meta-analysis of genome-wide association (GWA) data from 18 population-based cohorts with European ancestry (maximum N = 32,225). We collected 8 further cohorts (N = 17,102) for replication, and rs6448771 on 4p15 demonstrated genome-wide significant interaction with waist-to-hip-ratio (WHR) on total cholesterol (TC) with a combined P-value of 4.79×10⁻⁹. There were two potential candidate genes in the region, PCDH7 and CCKAR, with differential expression levels for rs6448771 genotypes in adipose tissue. The effect of WHR on TC was strongest for individuals carrying two copies of G allele, for whom a one standard deviation (sd) difference in WHR corresponds to 0.19 sd difference in TC concentration, while for A allele homozygous the difference was 0.12 sd. Our findings may open up possibilities for targeted intervention strategies for people characterized by specific genomic profiles. However, more refined measures of both body-fat distribution and metabolic measures are needed to understand how their joint dynamics are modified by the newly found locus.
Introduction
Serum lipids are important determinants of cardiovascular disease and related morbidity [1]. The heritability of circulating lipid levels is estimated to be 40%–60% and recent genome-wide association (GWA) studies implicated a total of 95 loci associated with serum high-density lipoprotein cholesterol (HDL-C), low-density lipoprotein cholesterol (LDL-C), total cholesterol (TC), and triglyceride (TG) levels [2]. Currently identified common variants explain 10%–12% of the total variation in lipid levels, corresponding to ∼25% of the trait heritability [2].
Epidemiological risk factors, such as alcohol consumption, smoking, physical activity, diet and body composition are known to affect lipid levels [3]–[5]. These risk factors also show moderate to high heritabilities, and over 120 loci with genome-wide significant association have been identified (http://www.genome.gov/26525384). To better understand the biological processes modifying lipid levels, several twin studies [6]–[8] and candidate gene studies [9]–[14] have tested for interactions between genes and epidemiological risk factors.
Interactions between genes and modifiable risk factors might help us develop new lifestyle interventions targeted to susceptible individuals based on their genetic information. The effects of genetic loci and risk factors have been studied widely separately, but to date no GWA studies for interactions on lipids have been reported.
Results
We conducted a genome-wide screen for interactions between 2.5 million genetic markers and sex, lifestyle factors (smoking and alcohol consumption), and body composition (BMI and WHR) in association to serum lipid levels (TC, TG, HDL-C, and LDL-C) in 18 population-based cohorts (max N = 32,225; Table S1A, Text S1). We defined interaction as a departure from a linear statistical model allowing for the additive main effects of both the SNP and the epidemiological risk factor.
18 SNPs with suggestive interactions for at least one of the trait – epidemiological factor combinations (P-value for the interaction <10−6) in stage 1 analyses were taken forward to stage 2 analysis in eight additional cohorts (max N = 14,889; Table S1B, Text S1). In inverse variance meta-analyses combining the results from stage 1 and stage 2 (Table S2), the interaction between rs6448771 in chromosome 4p15 and WHR on TC (Figure 1) was statistically genome-wide significant (stage 1 and 2 combined P = 9.08×10⁻⁹). This interaction was tested in stage 3 in two further cohorts (N = 7,813; Table S1C, Text S1), which showed an effect to the same direction. After combining results from all three stages (total N = 43,903), the P-value for interaction was 4.79×10⁻⁹. The association between WHR and TC was strongest for individuals carrying two G alleles of rs6448771, for whom a one standard deviation (sd) difference in WHR corresponds to 0.19 sd difference (confidence interval 0.13–0.25) in TC concentration, while for individuals homozygous for the A allele the difference was 0.12 sd (confidence interval 0.09–0.16) (Table S3A, Figure S1). The effect corresponds to 0.5% and 0.2% of the total variance explained in a cohort of young individuals (YFS, mean age = 37.6) and an old cohort (HBCS, mean age = 61.49), respectively. Additionally, when looking at the effect of the SNP on TC in WHR tertiles, the estimates differed in a way that the estimated SNP effect is higher for the individuals with higher WHR (Table S3B). The SNP did not have a direct effect on either TC or WHR (P = 0.46 and P = 0.51, respectively, Figure 1). The SNP rs6448771 is located 249 kb downstream of the protocadherin 7 (PCDH7) gene.

Since the polymorphisms associated with complex phenotypes often influence gene expression, we examined whether individuals carrying different genotypes of rs6448771 have variation in their transcript profiles. As WHR reflects adipose tissue function, we selected 54 individuals from Finnish dyslipidemic families with available fat biopsies and GWA data. We used linear regression to find genes that were differentially expressed in adipose tissue depending on the rs6448771 genotype. We found two potential candidate genes with nominally significant cis-eQTL effects, PCDH7 (P = 0.027, distance from the rs6448771 250 kb) and CCKAR (P = 0.017, distance from the SNP 4.9 Mb). The region with CCKAR has previously been linked with obesity [15]. Additionally, using Ingenuity software (IPA), we conducted a pathway analysis for genes with eQTL P-value<0.01 (both trans - and cis-eQTLs). Among other diverse IPA-defined biological functions, there was an eQTL association enrichment among genes belonging to the ‘degradation of phosphatidylcholine’ (3 genes out of 6, P = 6.64×10⁻⁵, Benjamini-Hochberg corrected P = 0.0138) and ‘degradation of phosphatidic acid’ (4 genes out of 8, P = 4.71×10⁻⁴, B-H corrected P = 0.0349) functions, which are members of broader defined IPA categories “Lipid Metabolism” and “Carbohydrate Metabolism”. These pathways were up-regulated in individuals carrying the G allele of rs6448771, possibly indicating a role for rs6448771 in lipid and carbohydrate metabolism.
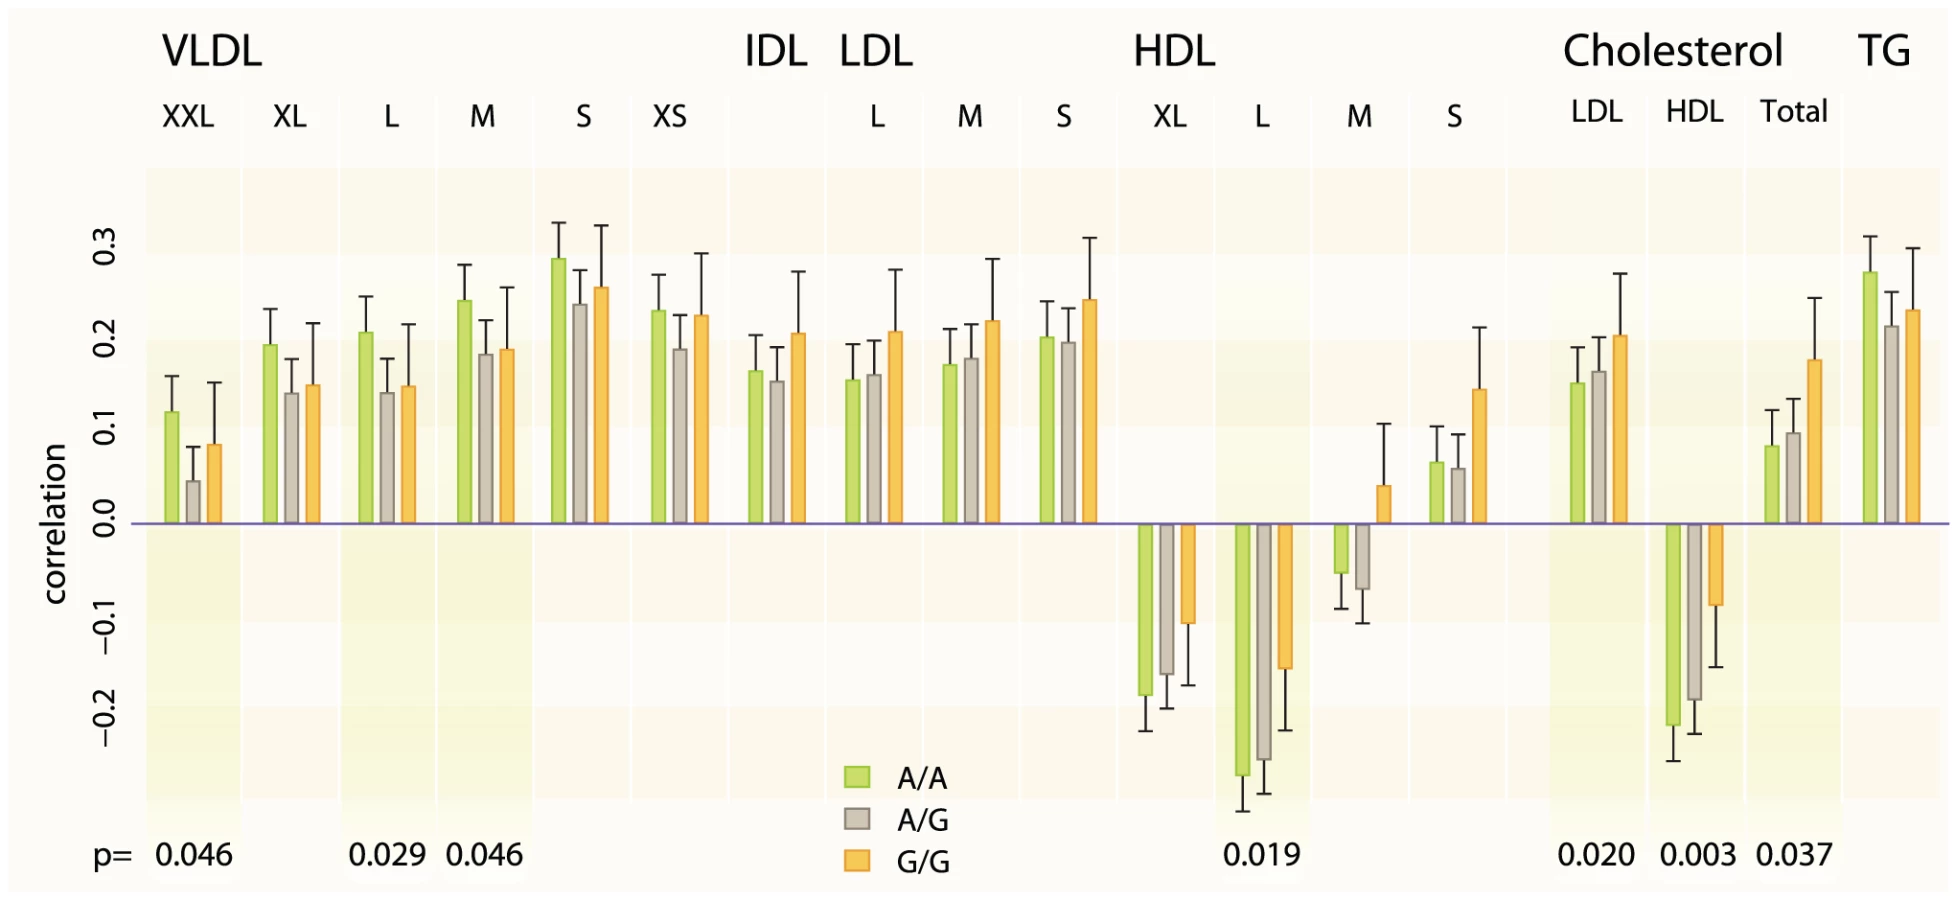
The associated SNP also shows evidence for interactions with WHR on LDL-C (effect estimate for the interaction = 0.03, P = 0.0016) and HDL-C (effect estimate = 0.02, P = 0.029) in our stage 1 meta-analysis and after adjusting for TC no residual interaction effect on LDL-C and a little on HDL-C remains (P = 0.834 and P = 0.131 respectively) when testing in data subset. Therefore we tested the SNP – WHR interaction also on a range of lipoprotein subclasses measured using NMR metabonomics platform [16] available in two cohorts (NFBC1966, N = 4624 mean age = 31.0; YFS, N = 1889, mean age = 37.6). The results show that the SNP has a positive interaction effect on large HDL particle concentration (combined effect for the interaction = 0.538, P = 0.0186) and a negative effect on large very-low-density lipoprotein (VLDL) particles (combined effect = −0.466, P = 0.0291) and total triglycerides (combined effect = −0.454, P = 0.0343) (Figure 2).
Discussion
Our genome-wide scan for interactions between SNP markers and traditional epidemiological risk factors in population-based random samples found a genome-wide significant locus, rs6448771, modifying the relationship between WHR and TC. The effect of WHR is estimated to be 64% stronger for individuals carrying two copies of the G allele than for individuals carrying two A alleles. The interaction explains around half a percent of the TC variance that is in par with the main effects of the strongest previously identified TC SNPs individually. This SNP also shows similar interaction effects on a cascade of more detailed lipid fractions suggesting broad involvement in lipid metabolism, which was also suggested by our eQTL association enrichment analysis with adipose tissue expression data.
The eQTL analysis pointed towards two potential candidate genes in the region. The first one of these was protocadherin 7 (PCDH7) gene, which produces a protein that is thought to function in cell-cell recognition and adhesion. The other candidate gene, cholecystokinin A receptor (CCKAR) regulates satiety and release of beta-endorphin and dopamine in the central and peripheral nervous system. It has been previously shown that rats with no expressed CCKARs developed obesity, hyperglycemia and type 2 diabetes [17]. To test whether our eQTL finding was adipose tissue specific, we ran the eQTL analysis for PCDH7 and CCKAR in another dataset with genome wide expression data from blood leukocytes (N = 518) available. CCKAR could not be tested due to its negligible expression in blood leukocytes, and no association was found for the PCDH7 (P-value = 0.284) gene most likely indicating an adipose tissue specific eQTL for PCDH7 as a function of rs6448771.
One interesting aspect of this study, given our large sample size, is that only one signal achieved genome-wide significance, where previously published lipid GWA studies have found close to a hundred. Although power to detect interaction is typically lower than for main effects, especially for rare exposures and SNPs, several of the exposures considered here (such as WHR, BMI, and gender) were common and available for a large proportion of the study sample. This suggests that the contribution of two-way G×E interactions to lipid levels, at least for the risk factors we examined, is rather small, or that our current measures of risk factors may not be robust enough for identifying interactions. More specific measures of both phenotypes and interacting risk factors would give better statistical power in future screens of G×E interactions.
Our findings allow us to draw several conclusions. First, to our knowledge, this is the first time an interaction between a genetic loci and a risk factor has been identified in a genome-wide scan using a stringent statistical threshold for genome-wide significance. Second, in our samples, rs6448771 modified the relationship between WHR and TC, but was not associated with either WHR or TC alone. This observation suggests that genome-wide screens for interactions may be complementary to the current large-scale GWAS efforts for finding main effects. Third, in addition to careful harmonization of both risk factor data and phenotypes, large sample sizes are needed to identify interactions. In our study, 43,903 samples were combined to robustly identify the interaction. Our data, however, suggest that the contribution of G×E interaction using current phenotypes appears limited. Finally, from clinical point of view, the interaction may open up possibilities for targeted intervention strategies for people characterized by specific genomic profiles but more refined measures of both body-fat distribution and metabolic measures are needed to understand how their joint dynamics are modified by the newly found locus.
Materials and Methods
Participating studies
18 studies, with a combined sample size of over 30,000 individuals, participated in the discovery phase of this analysis; 8 studies were available for replication with over 14,000 individuals. In the discovery stage, only population-based cohorts not ascertained on the basis of phenotype, with a wide variety of well-defined epidemiological measures available, were included. In the replication datasets, the NTR cohort was selected on the basis of low risk for depression and the Genmets samples were selected for metabolic syndrome. In further replication of rs6448771, the EPIC cases were ascertained by BMI. Descriptive statistics for these populations are detailed in Table S1A (discovery), S1B (replication) and S1C (further replication). Brief descriptions of the cohorts are provided in the Text S1 section “Short descriptions of the cohorts”.
Phenotype determination
Individuals were excluded from analysis if they were not of European descent or were receiving lipid-lowering medication at the time of sampling. TC, HDL-C, and TG concentrations were measured from serum or plasma extracted from whole blood, typically using standard enzymatic methods. LDL-C was either directly measured or estimated using the Friedewald Equation (LDL-C = TC – HDL-C – 0.45×TG for individuals with TG≤4.52 mmol/l, samples with TG level higher than 4.52 were discarded in the calculation of LDL-C) [18].
Covariates and epidemiological risk factors were ascertained at the same time that blood was drawn for lipid measurements. BMI was defined as weight in kilograms divided by the square of height in meters. Waist circumference was measured at the mid-point between the lower border of the ribs and the iliac crest; hip circumference was measured at the widest point over the buttocks. Waist-to-hip ratio was defined as the ratio of waist and hip circumferences. Alcohol consumption and smoking habits were determined via interviews and/or questionnaires. Both behaviors were coded as dichotomous (abbreviations: ALC for drinker/abstainer and SMO for current smoker/current non-smoker) and semi-quantitative traits. Semi-quantitative alcohol usage (ALCq) was based on daily consumption in grams (0 : 0 g/day; 1: >0 and ≤10 g/day; 2: >10 and ≤20 g/day; 3: >20 and ≤40 g/day; 4: >40 g/day). Semi-quantitative smoking (SMOq) was assessed based on the number of cigarettes per day (0 : 0 cigarettes/day; 1: >0 and ≤10 cigarettes/day; 2: >10 and ≤20 cigarettes/day; 3: >20 and ≤30 cigarettes/day; 4: >30 cigarettes/day).
Genotyping and imputations
Affymetrix, Illumina or Perlegen arrays were used for genotyping in the discovery cohorts. Each study filtered both individuals and SNPs to ensure robustness for genetic analysis. After quality control, these data were used to impute genotypes for approximately 2.5 million autosomal SNPs based on the LD patterns observed in the HapMap 2 CEU samples. Imputed genotypes were coded as dosages, fractional values between 0 and 2 reflecting the estimated number of copies of a given allele for a given SNP for each individual. Cohort specific details concerning quality control filters, imputation reference sets and imputation software are described in Table S4.
In silico replication
Replication cohorts utilized genome-wide imputed data, as described above, where available. Details on the genotyping methods implemented in the replication samples are described in Table S4.
Serum NMR metabonomics, lipoprotein subclasses
Proton NMR spectroscopy was used to measure lipid, lipoprotein subclass and particle concentrations in native serum samples. NMR methods have been previously described in detail [16], [19]. Serum concentrations of total triglycerides (TG), total cholesterol (TC) together with LDL-C and HDL-C were determined. In addition, total lipid and particle concentrations in 14 lipoprotein subclasses were measured. The measurements of these subclasses have been validated against high-performance liquid chromatography [20]. The subclasses were as follows: chylomicrons and largest VLDL particles (particle diameters from approx 75 nm upwards), five different VLDL subclasses: very large VLDL (average particle diameter 64.0 nm), large VLDL (53.6 nm), medium-size VLDL (44.5 nm), small VLDL (36.8 nm), and very small VLDL (31.3 nm); intermediate-density lipoprotein (IDL) (28.6 nm); three LDL subclasses: large LDL (25.5 nm), medium-size LDL (23.0 nm), and small LDL (18.7 nm); and four HDL subclasses: very large HDL (14.3 nm), large HDL (12.1 nm), medium size HDL (10.9 nm), and small HDL (8.7 nm).
Statistical methods
Triglyceride concentrations were natural log transformed prior to analysis. BMI and WHR were transformed to normality using inverse-normal transformation of ranks. For analyses where sex was the epidemiological variable of interest, the phenotypes were defined as the rank-inverse normal transformed residuals resulting from the regression of the lipid measurement on age and age2. For the other analyses, the phenotypes were defined as the inverse normal transformed residuals resulting from the regression of the lipid measurement on age, age2, and sex.
Associations between the transformed residuals and epidemiological risk factors/SNPs were tested using linear regression models under the assumption of an additive (allelic trend) model of genotypic effect. The models regressed phenotypes on epidemiological factor, SNP, and epidemiological factor×SNP termsand tested if the effect for E×SNP was 0 using 1 df Wald tests. In family-based cohorts, linear mixed modeling was implemented to control for relatedness among samples [21]. Analysis software used by the individual cohorts is described in Table S1A and S1B.
The interaction terms from the regression analyses were meta-analyzed using inverse variance weighted fixed-effects models [22]. Prior to meta-analysis, genomic control correction factors (λGC) [23], calculated from all imputed SNPs, were applied on a per-study basis to correct for residual bias possibly caused by population sub-structure. Meta-analyses were performed by two independent analysts using METAL (http://www.sph.umich.edu/csg/abecasis/Metal/index.html) and the R [24] package MetABEL (part of the GenABEL suite, http://www.genabel.org/). All results were concordant, reflecting a robust analysis. Results were selected for in silico replication if the meta-analysis P-value was less than 10−6. Results passing the threshold of suggestive genome-wide association (P-value ≤5×10⁻⁷) were selected for further replication by direct genotyping.
The commonly accepted genome wide level of significance (5×10⁻⁸) reflects the estimated testing burden of one million independent SNPs in samples of European ancestry [25]. To address the multiple testing arising from testing interactions with multiple risk factors, we set the genome wide significance threshold to 5×10⁻⁸/3 = 1.67×10⁻⁸ corresponding to three principal components explaining 97.8% of the total variation of the risk factors (Table S5).
Pathway analysis
The functional analyses were generated through the use of Ingenuity Pathways Analysis (Ingenuity Systems, www.ingenuity.com).” The Functional Analysis identified the biological functions and/or diseases that were most significant to the data set. Molecules which met the P-value cutoff of 0.01 for the rs6448771 – expression association in dataset of 54 Finnish individuals with both genotype and adipose tissue expression data, and were associated with biological functions and/or diseases in Ingenuity's Knowledge Base were considered for the analysis. Right-tailed Fisher's exact test was used to calculate a P-value determining the probability that each biological function and/or disease assigned to that data set is due to chance alone and Benjamini-Hochberg multiple test correction [26] was applied.
Supporting Information
Zdroje
1. CooneyMCooneyHDudinaAGrahamI 2010 Assesment of cardiovascular risk. Curr Hypertens Rep 12 384 393
2. TeslovichTMusunuruKSmithAEdmondsonAStylianouI 2010 Biological, clinical and population relevance of 95 loci for blood lipids. Nature 466 707 713
3. GazianoJMansonJ 1996 Diet and heart disease. The role of fat, alcohol, and antioxidants. Cardiol Clin 14 69 83
4. BullenC 2008 Impact of tobacco smoking and smoking cessation on cardiovascular risk and disease. Expert Rev Cardiovasc Ther 6 883 895
5. KrausWSlentzC 2009 Exercise training, lipid regulation, and insulin action: a tangled web of cause and effect. Obesity (Silver Spring) 17 Suppl 3 S21 26
6. CzerwinskiSMahaneyMRainwaterDVandebergJMacCluerJ 2004 Gene by smoking interaction: evidence for effects on low-density lipoprotein size and plasma levels of triglyceride and high-density lipoprotein cholesterol. Hum Biol 76 863 876
7. GreenfieldJSamarasKJenkinsAKellyPSpectorT 2004 Do gene-environment interactions influence fasting plasma lipids? A study of twins. Eur J Clin Invest 34 590 598
8. WangXDingXSuSSpectorTManginoM 2009 Heritability of insulin sensitivity and lipid profile depend on BMI: evidence for gene-obesity interaction. Diabetologia 52 2578 2584
9. SentíMAuboCBoschM 1998 The relationship between smoking and triglyceride-rich lipoproteins is modulated by genetic variation in the glycoprotein IIIa gene. Metabolism 47 1040 1041
10. SentíMElosuaRTomásMSalaJMasiáR 2001 Physical activity modulates the combined effect of a common variant of the lipoprotein lipase gene and smoking on serum triglyceride levels and high-density lipoprotein cholesterol in men. Hum Genet 109 385 392
11. JunyentMTuckerKSmithCGarcia-RiosAMatteiJ 2009 The effects of ABCG5/G8 polymorphisms on plasma HDL cholesterol concentrations depend on smoking habit in the Boston Puerto Rican Health Study. J Lipid Res 50 565 573
12. CorbexMPoirierOFumeronFBetoulleDEvansA 2000 Extensive association analysis between the CETP gene and coronary heart disease phenotypes reveals several putative functional polymorphisms and gene-environment interaction. Genet Epidemiol 19 64 80
13. Brand-HerrmannSKuznetsovaTWiechertAStolarzKTikhonoffV 2005 Alcohol intake modulates the genetic association between HDL cholesterol and the PPARgamma2 Pro12Ala polymorphism. J Lipid Res 46 913 919
14. Marques-VidalPBongardVRuidavetsJFauvelJHanaire-BroutinH 2003 Obesity and alcohol modulate the effect of apolipoprotein E polymorphism on lipids and insulin. Obes Res 11 1200 1206
15. AryaRDuggiralaRJenkinsonCAlmasyLBlangeroJ 2004 Evidence of a novel quantitative-trait locus for obesity on chromosome 4p in Mexican Americans. Am J Hum Genet 74 272 282
16. InouyeMKettunenJSoininenPSilanderKRipattiS 2010 Metabonomic, transcriptomic, and genomic variation of a population cohort. Mol Syst Biol Dec 21 441
17. MoranTKatzLPlata-SalamanCSchwartzG 1998 Disordered food intake and obesity in rats lacking cholecystokinin A receptors. Am J Physiol 273 R618 R625
18. FriedewaldWLevyRFredricksonD 1972 Estimation of the concentration of low-density lipoprotein cholesterol in plasma, without use of the preparative ultracentrifuge. Clin Chem 18 499 502
19. SoininenPKangasAWürtzPTukiainenTTynkkynenT 2009 High-throughput serum NMR metabonomics for cost-effective holistic studies on systemic metabolism. Analyst 134 1781 1785
20. OkazakiMUsuiSIshigamiMSakaiNNakamuraT 2005 Identification of unique lipoprotein subclasses for visceral obesity by component analysis of cholesterol profile in high-performance liquid chromatography. Thromb Vasc Biol 25 578 584
21. AulchenkoYStruchalinMvan DuijnC 2010 ProbABEL package for genome-wide association analysis of imputed data. BMC Bioinformatics 16 134
22. de BakkerPFerreiraMJiaXNealeBRaychaudhuriS 2008 Practical aspects of imputation-driven meta-analysis of genome-wide association studies. Hum Mol Genet 17 R122 128
23. DevlinBRoederKWassermanL 2001 Genomic control, a new approach to genetic-based association studies. Theor Popul Biol 600 155 166
24. R Development Core Team: R: A language and environment for statistical computing, Access date: 2010 Dec 13, http://R-project.org
25. Pe'erIYelenskyRAltshulerDDalyM 2008 Estimation of the multiple testing burden for genomewide association studies of nearly all common variants. Genet Epidemiol 32 381 385
26. BenjaminiYHochbergY 1995 Controlling the false discovery rate: a practical and powerful approach to multiple testing. J Roy Static Soc Ser B 57 289 300
Štítky
Genetika Reprodukční medicínaČlánek vyšel v časopise
PLOS Genetics
2011 Číslo 10
Nejčtenější v tomto čísle
- The Glycobiome Reveals Mechanisms of Pentose and Hexose Co-Utilization in Bacteria
- Global Mapping of Cell Type–Specific Open Chromatin by FAIRE-seq Reveals the Regulatory Role of the NFI Family in Adipocyte Differentiation
- Genetic Determinants of Serum Testosterone Concentrations in Men
- MicroRNA Expression and Regulation in Human, Chimpanzee, and Macaque Brains