
Positional Cloning of a Type 2 Diabetes Quantitative Trait Locus; , a Negative Regulator of Insulin Secretion
We previously mapped a type 2 diabetes (T2D) locus on chromosome 16 (Chr 16) in an F2 intercross from the BTBR T (+) tf (BTBR) Lepob/ob and C57BL/6 (B6) Lepob/ob mouse strains. Introgression of BTBR Chr 16 into B6 mice resulted in a consomic mouse with reduced fasting plasma insulin and elevated glucose levels. We derived a panel of sub-congenic mice and narrowed the diabetes susceptibility locus to a 1.6 Mb region. Introgression of this 1.6 Mb fragment of the BTBR Chr 16 into lean B6 mice (B6.16BT36–38) replicated the phenotypes of the consomic mice. Pancreatic islets from the B6.16BT36–38 mice were defective in the second phase of the insulin secretion, suggesting that the 1.6 Mb region encodes a regulator of insulin secretion. Within this region, syntaxin-binding protein 5-like (Stxbp5l) or tomosyn-2 was the only gene with an expression difference and a non-synonymous coding single nucleotide polymorphism (SNP) between the B6 and BTBR alleles. Overexpression of the b-tomosyn-2 isoform in the pancreatic β-cell line, INS1 (832/13), resulted in an inhibition of insulin secretion in response to 3 mM 8-bromo cAMP at 7 mM glucose. In vitro binding experiments showed that tomosyn-2 binds recombinant syntaxin-1A and syntaxin-4, key proteins that are involved in insulin secretion via formation of the SNARE complex. The B6 form of tomosyn-2 is more susceptible to proteasomal degradation than the BTBR form, establishing a functional role for the coding SNP in tomosyn-2. We conclude that tomosyn-2 is the major gene responsible for the T2D Chr 16 quantitative trait locus (QTL) we mapped in our mouse cross. Our findings suggest that tomosyn-2 is a key negative regulator of insulin secretion.
Published in the journal:
. PLoS Genet 7(10): e32767. doi:10.1371/journal.pgen.1002323
Category:
Research Article
doi:
https://doi.org/10.1371/journal.pgen.1002323
Summary
We previously mapped a type 2 diabetes (T2D) locus on chromosome 16 (Chr 16) in an F2 intercross from the BTBR T (+) tf (BTBR) Lepob/ob and C57BL/6 (B6) Lepob/ob mouse strains. Introgression of BTBR Chr 16 into B6 mice resulted in a consomic mouse with reduced fasting plasma insulin and elevated glucose levels. We derived a panel of sub-congenic mice and narrowed the diabetes susceptibility locus to a 1.6 Mb region. Introgression of this 1.6 Mb fragment of the BTBR Chr 16 into lean B6 mice (B6.16BT36–38) replicated the phenotypes of the consomic mice. Pancreatic islets from the B6.16BT36–38 mice were defective in the second phase of the insulin secretion, suggesting that the 1.6 Mb region encodes a regulator of insulin secretion. Within this region, syntaxin-binding protein 5-like (Stxbp5l) or tomosyn-2 was the only gene with an expression difference and a non-synonymous coding single nucleotide polymorphism (SNP) between the B6 and BTBR alleles. Overexpression of the b-tomosyn-2 isoform in the pancreatic β-cell line, INS1 (832/13), resulted in an inhibition of insulin secretion in response to 3 mM 8-bromo cAMP at 7 mM glucose. In vitro binding experiments showed that tomosyn-2 binds recombinant syntaxin-1A and syntaxin-4, key proteins that are involved in insulin secretion via formation of the SNARE complex. The B6 form of tomosyn-2 is more susceptible to proteasomal degradation than the BTBR form, establishing a functional role for the coding SNP in tomosyn-2. We conclude that tomosyn-2 is the major gene responsible for the T2D Chr 16 quantitative trait locus (QTL) we mapped in our mouse cross. Our findings suggest that tomosyn-2 is a key negative regulator of insulin secretion.
Introduction
Genetic factors are estimated to contribute approximately 50% towards the risk of developing type 2 diabetes (T2D) [1]. Recent genome-wide association studies have identified a number of “diabetes genes”, gene loci that act in an additive manner and conspire with obesity to augment the risk of T2D. Nearly all of these genes affect β-cell function and/or the maintenance of β-cell mass. Thus, it appears that diet and obesity place demands on β-cells for insulin by causing insulin resistance, but the genetic bottleneck that can lead to T2D involves genes that affect the capacity of pancreatic β-cells to meet the increased insulin demand.
Mouse intercrosses provide high power to detect linkage of gene loci to physiological traits related to obesity and diabetes. The mapping resolution of these intercrosses is typically not fine enough to identify individual genes. However, by generating panels of congenic strains carrying meiotic recombinations within disease loci, it is possible to map the genes underlying those loci with high resolution. We recently reported the positional cloning of a T2D gene, Sorcs1, to sub-genetic resolution using this approach [2]. Several other genes have been identified using a similar approach; Zfp69, which encodes a transcription factor involved in regulating glucose levels, was identified as the gene underlying a diabetes susceptibility locus on mouse chromosome 4 [3]. Similarly, Lisch-like was identified as the gene underlying a T2D locus on chromosome 1 and was shown to be involved in regulating β-cell mass and plasma glucose levels [4].
Borrowing from microbial genetics, mouse genetic studies employ a powerful tool for increasing the sensitivity to detect heritable phenotypes. This involves sensitized screens wherein a severe stressor provokes phenotypes that would otherwise be silent. The stressor need not be a normal feature in human disease pathogenesis to evoke phenotypes of great relevance to disease. For example, the apoE-deficient mouse is the most widely used animal model of atherosclerosis even though apoE deficiency is extremely rare in humans [5]. Similarly, a mutation in the Leptin gene (Lepob) promotes morbid obesity in mice (Lepob/ob) and evokes dysregulation of many pathways, enabling a greater understanding of their regulatory mechanisms [6], [7].
Using the Lepob mutation as a stressor, we found that the BTBR T (+) (BTBR) mouse strain develops severe T2D, whereas the C57BL/6 (B6) strain has moderate hyperglycemia and expands its β-cell mass [8], [9]. In an F2 intercross derived from these two strains, we identified a T2D susceptibility locus on chromosome 16 (Chr 16) [9]. In the present study, we developed a panel of congenic strains that enabled us to narrow this locus to just 0.94 Mb. Lean congenic mice that contain this genomic region derived from the BTBR strain have elevated glucose and reduced insulin levels. Islets from these mice show deficiencies in insulin secretion. Within this small interval, we identified a novel diabetes susceptibility gene, Syntaxin binding protein 5 like (Stxbp5l), also known as Tomosyn-2. We showed that the tomosyn-2 protein is an inhibitor of insulin secretion.
Results
Chr 16 consomic mice have increased fasting plasma glucose and reduced insulin levels
We previously identified a fasting plasma glucose locus on Chr 16 from a Lepob/ob F2 intercross derived from the B6 and BTBR mouse strains [9]. This locus acts in a fully dominant fashion on plasma glucose and a semi-dominant fashion on fasting plasma insulin [9]. The LOD peak on Chr 16 of the fasting glucose locus from the F2 intercross is located at approximately 36–38 Mb (Figure 1A). To determine if the Chr 16 locus could act autonomously to affect T2D susceptibility, we derived a chromosome substitution (i.e. consomic) mouse strain by introgression of Chr 16 from BTBR into B6 ob/ob mice (B6.16BT Lepob/ob). The fasting plasma glucose levels of the resulting consomic mice were significantly elevated at 4, 6, 8, and 10 weeks compared to control (B6.16B6 Lepob/ob) mice and accounted for a major proportion of the plasma glucose phenotype of the parental BTBR strain. Fasting plasma insulin levels were reduced at 8 and 10-weeks in B6.16BT Lepob/ob mice compared to B6.16B6 Lepob/ob mice (Figure 1B and 1C). These data suggested that the hyperglycemia caused by BTBR Chr 16 substitution is due to reduction in insulin levels. The data also indicate that the locus on Chr 16 acts autonomously (i.e. in the absence of BTBR alleles on other chromosomes) to affect glucose and insulin levels.

Congenic mice with a 1.6 Mb fragment of the BTBR Chr 16 have an insulin secretion defect
To assess whether the B6.16BT Lepob/ob mice have a defect in insulin secretion, we isolated pancreatic islets from 10-week old B6.16BT Lepob/ob mice and measured fractional insulin secretion in response to high glucose (16.7 mM). We observed a ∼50% reduction in fractional insulin secretion in the B6.16BT Lepob/ob islets relative to control mice (B6.16B6 Lepob/ob) (Figure 2, left graph).

To avoid the metabolic complexities that are attributed to the leptin mutation in the Lepob/ob mice [10], we performed experiments in lean mice. Islets isolated from the congenic B6.16BT and B6.16B6 lean mice were treated with 8-bromo cAMP (3 mM) at sub-maximal glucose (11.1 mM); this combination of secretagogues was used for phenotyping lean congenic mice because it evoked more insulin secretion from lean islets than glucose alone. We observed ∼40% reduction in fractional insulin secretion in islets isolated from the lean B6.16BT mice relative to the lean control B6.16B6 mice (Figure 2, right graph). The data show that the insulin secretion defect, although initially mapped in a screen of F2 mice sensitized by the Lepob mutation, manifests itself independent of leptin deficiency.
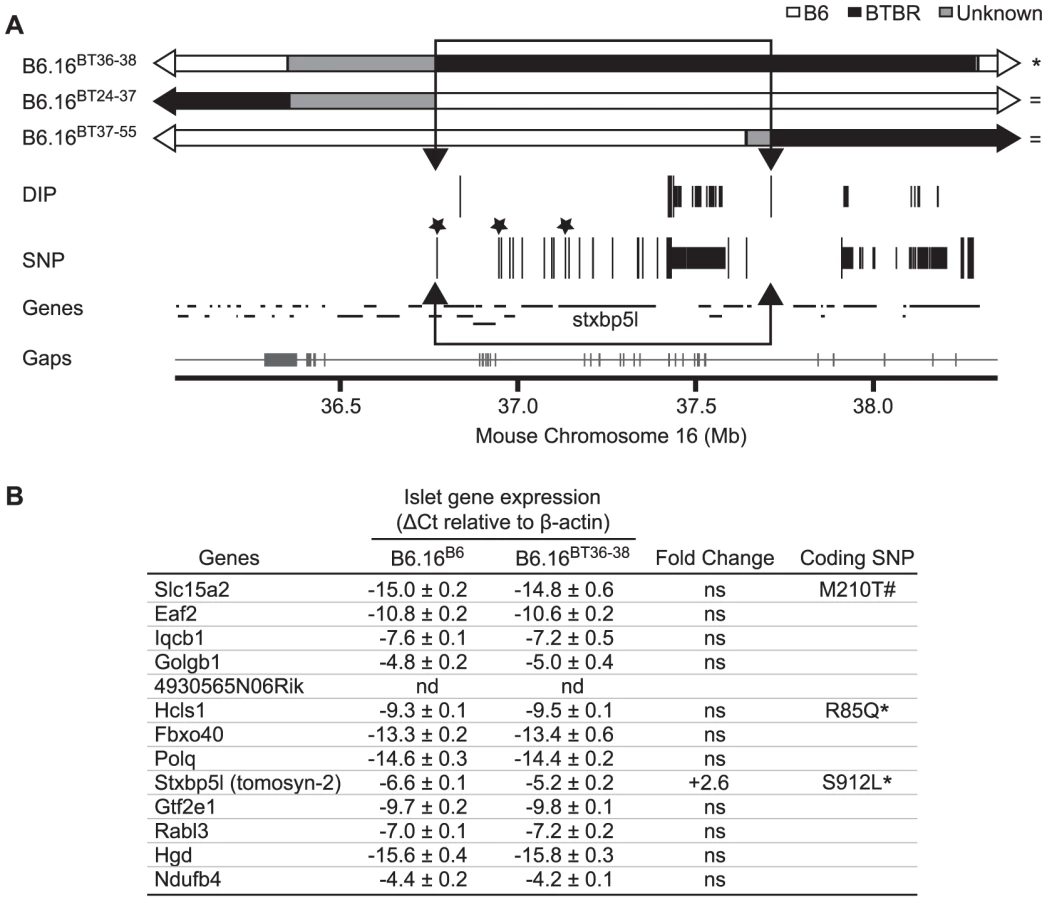
To investigate the region of the BTBR Chr 16 that confers the insulin secretion defect, a panel of lean congenic mouse strains was generated from the B6.16BT mice, each containing a small introgressed region from the BTBR Chr 16 in the B6 background (Figure 3, left panel). The B6/BTBR boundaries for each congenic strain were determined via microsatellite marker, single nucleotide polymorphism (SNP) sequencing or deletion/insertion polymorphism (DIP) sequencing (Dataset S1). By phenotyping each strain, we were able to fine-map the location of the gene responsible for the insulin secretion defect.

Islets were isolated from each lean congenic mouse strain and fractional insulin secretion was determined in the presence of 3 mM 8-bromo cAMP at sub-maximal 11 mM glucose. The islets isolated from the lean congenic mice that carry the 2 Mb Chr 16 derived from the BTBR strain (B6.16BT36–38) were defective in insulin secretion when compared to islets isolated from congenic mice B6.16B6, B6.16BT37–55, or B6.16BT24–37 (Figure 3, right panel). The overlapping region of BTBR Chr 16 represented by congenic strains, B6.16 BT36–38 and B6.16 BT37–55 enabled us to further narrow the region to 1.6 Mb. Islets isolated from congenic mice, B6.16BT24–55, B6.16BT24–47, or B6.16BT24–38, which contained the 1.6 Mb region derived from the BTBR strain, also displayed a reduced level of insulin secretion, indicating that this 1.6 Mb region contains a gene responsible for regulating insulin secretion.
The 1.6 Mb region of the BTBR Chr 16 is sufficient to increase plasma glucose levels
We next determined the effect of introgression of the BT36–38 region of Chr 16 into B6 mice on susceptibility to obesity-induced diabetes. Plasma insulin and glucose levels were determined in random-fed 10-week B6.16BT36–38 and control B6.16B6 Lepob/ob congenic mice. We observed a ∼40% reduction in plasma insulin levels in the B6.16BT36–38 Lepob/ob compared to B6.16B6 Lepob/ob mice (Figure 4A). The reduction in plasma insulin was accompanied by an increase in plasma glucose by ∼100 mg/dL (Figure 4C).

Although not nearly as dramatic as in the Lepob/ob mice, lean congenic mice with the 36–38 Mb BTBR insert had a significant reduction in plasma insulin and increase in plasma glucose (Figure 4B and 4D, respectively). Detection of this very small rise in plasma glucose required a very large sample size (n = 80) to achieve statistical significance. Clearly, we would not have found this modest phenotype in a screen of lean mice, showing that severe stressors like the Lepob mutation are required to identify subtle allelic variation in QTLs that contribute to T2D risk.
Reduced insulin secretion in islets from lean B6.16BT36–38 mice
Insulin secretion from pancreatic β-cells is biphasic. The first phase represents a brief but rapid secretion from pre-docked insulin granules in response to an initial depolarization of the plasma membrane. Non-nutrient secretagogues like KCl predominantly invoke the first phase of insulin secretion. The second phase of insulin secretion is associated with metabolic signals derived from the metabolism of fuel-based insulin secretagogues like glucose. Glucose affects both the first and second phase of insulin secretion. Briefly, glucose oxidation increases the ATP/ADP ratio, resulting in the closure of ATP-sensitive KATP channels. This causes depolarization of the plasma membrane and influx of Ca2+ via L-type voltage-dependent calcium channels. Glucose promotes the second phase of insulin secretion without causing a further increase in intracellular Ca2+ levels. Diazoxide inhibits closure of the K+ channels, therefore adding this drug along with 16.7 mM glucose will result only in the glucose-induced second phase of insulin secretion and eliminates any glucose induction of the first phase of insulin secretion [11]–[13].
To determine which phase of insulin secretion is defective in our lean congenic B6.16BT36–38 mice, we carried out perifusion studies of isolated islets. Islets were perifused in Krebs-Henseleit Ringer bicarbonate (KRB) buffer at the rate of 1 ml/min. The perfusate was sampled every 30 sec, and the secreted insulin was measured by ELISA. After an initial 60 min equilibration period in KRB containing 1.7 mM glucose, islets were perifused for 10 min in KRB containing 40 mM KCl and 250 µM diazoxide to elicit first phase of insulin secretion. After 10 min, the islets were perifused for an additional 30 min in KRB containing 16.7 mM glucose with 40 mM KCl and 250 µM diazoxide to evoke the second phase of insulin secretion. The peak of the first phase of insulin secretion from B6.16B6 islets was observed within 1–2 min of KCl treatment. Following the first peak, the more sustained second phase of insulin secretion was observed for an additional 30 min, mimicking the well-studied biphasic kinetics of insulin secretion [14].
Islets from B6.16BT36–38 lean mice secreted ∼40% less insulin during the second phase than islets from the B6.16 B6 mice, as determined by calculating the area under the curve (AUC) (Figure 5A, 5B). There was also a small, but statistically significant reduction of first-phase insulin secretion (p = 0.044) (Figure 5A, 5B).

To complement the perifusion experiments, static insulin secretion experiments were performed in islets isolated from the B6.16BT36–38 and control B6.16B6 lean mice. Isolated islets were incubated for 45 min in KRB containing 1.7 mM glucose. Following a 45-min incubation, the islets were treated with 40 mM KCl in KRB containing 1.7 mM glucose. No difference in fractional insulin secretion was observed in response to KCl (Figure 6C, left panel). However, we observed a significant decrease in fractional insulin secretion between islets from the B6.16BT36–38 lean mice and those from the control B6.16B6 lean mice in response to 15 mM arginine, 3 mM 8-bromo cAMP in KRB containing 11 mM glucose, and 16.7 mM glucose alone (Figure 5C, middle and right panels).
Sequencing and alignment of overlapping congenic mouse strains narrowed the Chr 16 locus to 0.94 Mb
To further narrow the 1.6 Mb region of BTBR Chr 16 responsible for the phenotype, we used Agilent's SureSelect Target Enrichment to capture DNA from 35.35 Mb to 38.65 Mb on mouse Chr 16. 55,336 RNA baits were designed using the Agilent eArray and were used to enrich for our region from tail DNA of the B6, BTBR, B6.16BT36–38, B6.16BT24–37and B6.16BT24–38 mice. DNA was sequenced by Next Generation Sequencing using an Illumina GA IIx sequencer at the UW-Madison Biotechnology Center. Using CLC Genomics 4.0.3 Software, we were able to identify 470 SNPs; 3 non-synonymous coding SNPs and 46 DIPs between the B6 and BTBR DNA (Figure 6A). 83 SNPs and 8 DIPs were further confirmed by manual base reading to confirm the accuracy of the software (listed in Dataset S2). Using this sequence and known overlapping regions derived from the BTBR strain in the sub-congenic strains exhibiting normal insulin secretion (B6.16BT24–37, B6.16BT37–55), we were able to narrow the region responsible for the insulin secretion defect to 0.94 Mb containing 13 genes (Figure 6B).
To identify the gene(s) responsible for the insulin secretion defect, each candidate gene in the 0.94 Mb region was scored for the difference in mRNA abundance between the islets B6.16B6 and B6.16BT36–38 islets, the presence of non-synonymous coding SNPs, and similarity to a protein that have a functional role in exocytosis. Tomosyn-2 or Stxbp5l (syntaxin binding protein 5-like) quickly emerged as the top candidate gene. The mRNA abundance of tomosyn-2 was elevated 2.6 fold in the B6.16BT36–38 lean mice compared to control B6.16B6 mice (Figure 7A). Tomosyn-2 has a coding SNP (Ser-912→Leu). Eight other SNPs were also identified in the introns and additional SNPs were identified in the intergenic regions 5′ and 3′ of the gene (Dataset S1, Table S1). The tomosyn-2 protein shares 95% identity in the C-terminal soluble NSF (N-ethylmaleimide-sensitive factor) attachment protein receptor (SNARE) domain with several syntaxin-binding proteins. Finally, a related protein, tomosyn-1, has been shown to inhibit insulin secretion [15].

Increased expression of tomosyn-2 in islets of the B6.16BT36–38 lean mice
To understand the role of tomosyn-2 in the regulation of insulin secretion, the expression of tomosyn-2 was determined in key metabolic tissues; islet, liver, brain, cerebellum, kidney, adrenal, adipose (perigonadal), heart, skeletal muscle (gastrocnemius, soleus, and quadriceps) of the lean B6.16BT36–38 and B6.16B6 mice. The mRNA expression of tomosyn-2 in islets of the lean B6.16BT36–38 mice was ∼2.6-fold higher than in islets from the B6.16B6 mice (Figure 7A). No allele-dependent difference in the tomosyn-2 expression was observed in liver, brain, cerebellum, kidney, adrenal, gastrocnemius, adipose, heart, soleus, and quadriceps between the lean B6.16BT36–38 and B6.16B6 mice.
Four tomosyn-2 isoforms have been identified in mice: xb-, b, s, and m-tomosyn-2. We determined the relative expression of the tomosyn-2 isoforms in islets of the lean B6.16BT36–38 and B6.16B6 mice. We found that the b-tomosyn-2 isoform is the most abundant isoform in mouse islets. This was confirmed by RT-PCR with a primer pair that simultaneously amplified all of the tomosyn-2 isoforms (data not shown). The relative expression of b-tomosyn-2 and s-tomosyn-2 mRNA was ∼6-fold higher in islets of the lean B6.16BT36–38 mice than in lean B6.16B6 mice (Figure 7B). We observed no significant difference between the two-congenic mouse strains in the expression of xb- and m-tomosyn-2 isoforms. Together, the data indicate that increased expression of tomosyn-2 may be responsible for the insulin secretion defect observed in the lean B6.16BT36–38 mice.
Tomosyn-2 inhibits insulin secretion in pancreatic β-cells
To investigate the role of tomosyn-2 in insulin secretion, we investigated the effect of overexpressing b-tomosyn-2 in the pancreatic β-cell line, INS1 (832/13). The cells were transfected with GFP or b-tomosyn-2 expression plasmids. After 36 h, the cells were incubated in KRB containing 1.5 mM glucose for 2 h. Following the low glucose incubation, the cells were incubated for additional 10 min or 2 h in 3 mM 8-bromo cAMP at 7 mM glucose. Overexpressing b-tomosyn-2 decreased insulin secretion by ∼40% vs. GFP expressing cells at both 10 min and 2 h (Figure 8A). No inhibition in fractional insulin secretion was observed at low glucose (1.5 mM) (data not shown).

To determine if b-tomosyn-2 binds to syntaxin-1A and syntaxin-4, key t-SNARE proteins involved in the fusion of insulin granules to the plasma membrane, in vitro binding experiments were performed using GST fused syntaxin-1A and syntaxin-4 recombinant proteins (soluble, lacking transmembrane domains) by pull-down assays using glutathione beads. All isoforms of tomosyn-2 bound to GST-syntaxin-1A and GST-syntaxin-4 (Figure 8B). The quantitation for the amount of bound tomosyn-2 isoforms as a fraction of total is shown in Figure 8C. Tomosyn-1 was used as a positive control for binding. The GST tag did not pull down tomosyn-1 or tomosyn-2, confirming that the interaction between tomosyn-2 and syntaixn-1A and -4 is specific. Together, these data suggests that the mechanism by which b-tomosyn-2 inhibits insulin secretion involves binding to the syntaxin proteins. This suggests the possibility that tomosyn-2, like tomosyn-1, inhibits insulin secretion by preventing the binding of VAMP2 to syntaxin-1A and syntaxin-4.
The B6 allelic product of B-tomosyn-2 is susceptible to proteasomal degradation
We have shown that tomosyn-2 is a negative regulator of insulin secretion and also binds to syntaxin-1A and syntaxin-4. To investigate the possibility that the serine-912leucine SNP in tomosyn-2 affects its stability, HEK293T cells were transfected with empty vector (mock), b-tomosyn-2 (Serine-912), or b-tomosyn-2 (Leucine-912). After 16 h, the cells were treated with or without the proteasomal inhibitor, MG132 (100 µM) for 6 h. The MG132 treatment rescued the B6 allelic form of the protein, b-tomosyn-2 (serine-912), from proteasomal degradation by ∼50% (Figure 9A and 9B). However, the BTBR allelic form of the protein, b-tomosyn-2 (leucine-912) was not resistant to MG132 treatment, suggesting that an increased stability of the tomosyn-2 protein might be responsible for the attenuation in insulin secretion from islets of the BTBR mice.

Discussion
Our pursuit of genes conferring susceptibility to obesity-induced T2D focuses on two mouse strains that differ in diabetes susceptibility. BTBR mice, when made obese with the Leptinob mutation, are susceptible to T2D, whereas B6 mice with the same mutation are relatively diabetes resistant [16], [17]. The diabetes susceptibility of the obese BTBR mice has multiple causes, including an insulin secretion defect and a failure to increase β-cell mass. As early as 4 weeks of age, islets from the obese B6, but not BTBR mice have an increase in expression of a module of cell cycle genes whereas the obese BTBR mice fail to induce the expression of this module [16].
Through genetic mapping in an F2 intercross, we identified a strong QTL on Chr 16 wherein the BTBR allele is linked to increased glucose levels. In complex trait genetics, it is often the case that gene loci do not act autonomously, but must act along with specific alleles at other loci to exert their phenotypic effects [18]–[20]. To determine if the Chr 16 locus acts autonomously, we derived a chromosome substitution strain. Substitution of Chr 16 in the B6 strain with Chr 16 from the BTBR strain led to a ∼100 mg/dl increase in glucose and a ∼50% decrease in plasma insulin. This established that a locus on Chr 16 acts autonomously and is sufficient to account for a major part of the diabetes phenotype of the BTBR mouse strain.
QTL mapping in an F2 intercross does not provide the resolution required to identify individual genes. To narrow the interval, we derived a panel of interval-specific congenic strains. The strains were phenotyped on the basis of insulin secretion from isolated islets, a far more robust phenotype than fasting glucose or insulin levels. This enabled us to narrow the position of the QTL to <1 Mb, containing just thirteen genes. Of these thirteen genes, tomosyn-2 was the only gene that had both altered mRNA abundance and a coding SNP (S912L).
Recent studies by Williams et al. show that tomosyn-2 inhibits exocytosis in PC12 cells [21]. Our experiments establish a role for tomosyn-2 in insulin secretion. When we overexpressed tomosyn-2 in the pancreatic β-cell line INS1 (832/13), insulin secretion in response to 8-bromo cAMP at sub-maximal glucose was attenuated. In vitro GST-pull-down experiments showed that tomosyn-2 has the ability to bind t-SNARE proteins, syntaxin-1A and syntaxin-4. Syntaxin-1A is involved in the first phase and syntaxin-4 is involved in regulating both the first and second phase of insulin secretion [22]. These results establish that tomosyn-2, like its homologue, tomosyn-1, inhibits insulin secretion [23]. The fact that allelic variation in tomosyn-2 is sufficient to produce this phenotype suggests that tomosyn-1 cannot compensate for this deficiency, implying that their functions may not completely overlap.
The mRNA abundance of tomosyn-2 was increased in the congenic mouse strains expressing the BTBR allele. It is difficult to determine if this difference in expression level is sufficient to produce the difference in insulin secretion in islets of the two mouse strains because it would require accurately titrating the gene dosage (and the amount of protein product) in a null background.
Sequence analysis revealed a SNP in tomosyn-2 (S912L). We utilized a recent study showing that the proteasome inhibitor MG132 increases the abundance of tomosyn-2 [21]. We found that the S912L SNP abolishes the ability of MG132 to rescue tomosyn-2 from proteasomal degradation, thus establishing a functional role for the S912L SNP. Therefore, the decreased insulin secretion associated with the BTBR allele might be the result of increased stability of the tomosyn-2 protein as a consequence of the SNP at amino acid 912. We also indentified SNPs in the introns and the intergenic regions 5′ and 3′ of the tomosyn-2 gene (Figure 7). The intronic SNPs may regulate the stability of the tomosyn-2 mRNA and the intergenic SNPs might affect the level of transcription of the gene.
To investigate the role of the S912L SNP in pancreatic islets, we conducted perifusion experiments. Our perifusion experiments demonstrated that islets from the B6.16BT36–38 congenic mice were defective in the 2nd phase of insulin secretion. Our results suggest that tomosyn-2 is likely to be responsive to metabolic signals. With static incubation experiments, we tested various insulin secretagogues. Islets with the BTBR allele of tomosyn-2 were clearly less responsive to cAMP or arginine at sub-maximal glucose. These secretagogues are involved in both phases of insulin secretion, but the exact mechanisms by which they stimulate the 2nd phase of insulin secretion are not fully understood. The involvement of tomosyn-2 provides a plausible new target for the actions of these secretagogues.
We show that tomosyn-2, similar to tomosyn-1, binds to syntaxin-1A and syntaxin-4 [24]–[27]. Recent studies suggest that the binding to syntaxin is necessary but not sufficient for tomosyn-2′s inhibition of insulin secretion [21].
Our studies suggest that tomosyn-2 imposes a critical brake on insulin secretion. This is particularly important during fasting when inappropriate insulin secretion could cause life-threatening hypoglycemia. We hypothesize that under fasting conditions when glucose levels are low, tomosyn-2 blocks exocytosis and prevents hypoglycemia.
In mice, the two tomosyn genes, tomosyn-1 and tomosyn-2, encode seven alternatively spliced variants [23]. Tomosyn-1 contains three distinct isoforms (s, m, and b), whereas tomosyn-2 has four different spliced variants (s, m, b, and xb). The spliced exons encode the hypervariable region (HVR), which in tomosyn-1 has been shown to be subject to SUMOylation and PKA-mediated phosphorylation [21], [28]. The amino acid sequences of tomosyn-1 and tomosyn-2 are quite similar in the N-terminal WD40 repeats and C-terminal VAMP-like domain (VLD) [23]. Tomosyn-1 was identified in neurons as a syntaxin-1-binding protein that sequesters t-SNAREs on the plasma membrane by forming a “dead end”, nonfusogenic SNARE complex, resulting in inhibition of the formation of the SNARE complex [24], [26]. Deletion of the tomosyn-1 gene in C.elegans or in mice resulted in enhanced asynchronous neurotransmitter release [29], [30]. Gain of function studies demonstrated that tomosyn-1 is responsible for inhibiting exocytosis of dense core granules in primary adrenal chromaffin cells [27], PC12 cells [25], and pancreatic β-cells [15]. Moreover, in vitro biochemical evidence further supports the conclusion that tomosyn-1 inhibits the formation of the SNARE complex [31], [32].
The Ca2-independent inhibitory effects of the tomosyn-1 have been attributed to the VLD. More recently, Yamamoto et al demonstrated that in the presence of Ca2+, tomosyn-1, via the N-terminal WD40 domain, binds to synaptotagmin and inhibits SNARE complex-mediated neurotransmitter release [26], [30], [33], [34]. Together, the evidence is accumulating for tomosyn-1 as a negative regulator of exocytosis in both the stimulated and unstimulated states.
Insulin resistant animals compensate for their insulin resistance and maintain normal glucose levels by increasing insulin secretion. Our studies show that mutations in tomosyn-2 that increase its inhibitory activity can create a bottleneck and in the presence of obesity-induced insulin resistance, tip the balance towards T2D. However, it is also possible that tomosyn-2 plays an important role in regulating insulin secretion during daily starve/feed cycles by preventing inappropriate insulin secretion during fasting.
Tomosyn-2 may regulate exocytosis by modulating the formation of the SNARE complex in tissues other than islets. We observed significant tomosyn-2 expression in brain, cerebellum, islets, kidney, liver, and gastrocnemius (Figure 7). Therefore it is possible that tomosyn-2, like tomosyn-1, may have an important regulatory role in tissues where regulation of the SNARE complex can be limiting for an important transport process; e.g. insulin-mediated GLUT4 translocation in adipocytes [35] and transport of LDL-derived cholesterol from the trans-Golgi network to the endoplasmic reticulum in hepatocytes [36]. Thus, this tomosyn-2 could be playing a critical role in regulating vesicle trafficking in other tissues.
In summary, we have identified tomosyn-2 as a gene underlying a T2D susceptibility QTL on Chr 16. We show that tomosyn-2 is a negative regulator of insulin secretion. We identified a SNP in tomosyn-2 that affects the stability of the protein and thus suggest a molecular mechanism by which allelic variation in this gene increases diabetes susceptibility. Future studies will focus on the pathways that link nutrient sensing with the role of tomosyn-2 in the regulation of insulin secretion.
Materials and Methods
Materials
The enzymatic glucose reagent was purchased from Thermo Scientific. Insulin in lean mice was measured using a radioimmunoassy kit from Linco Research (St. Charles, MO). In Lepob/ob mice, insulin was measured with an in-house ELISA using an anti-insulin antibody from Fitzgerald Industries (Acton, MA). The mouse anti-myc antibody and Z-Leu-Leu-Leu-al (MG132) were purchased from Sigma-Aldrich, USA. The mouse secondary antibodies were purchase from Cell Signaling Technology (Boston, MA). Glutathione 4B Sepharose beads were purchased from GE Healthcare, USA.
Animals and breeding strategy
The C57BL/6 (B6) and BTBR T+ tf (BTBR) mice were intercrossed and were crossed to generate F1 mice. The B6.16B6 and B6.16BT mice were created by backcrossing the F1 mice to B6 using microsatellite markers to select for BTBR (or B6 in the case of B6.16B6) homozygosity on mouse chromosome 16 in an otherwise B6 background. The B6.16BT mice were further backcrossed to B6 with marker assisted selection to create congenic strains. Further identification of the B6/BTBR genetic boundaries were determined by SNP sequencing for some of the congenic strains (listed in Dataset S2. The Lepob mutation was introgressed into all strains using Lepob/+ mice as breeders [37]. All mice were maintained at the Department of Biochemistry, University of Wisconsin-Madison animal care facility on a 12 h dark-light cycle (6 PM to 6 AM). The mice were fed Purina Formulab Chow 5008 and water ad libitum. The mice were kept in accordance with the University of Wisconsin-Madison Research Animals Resource Center and the NIH guidelines for care and use of laboratory animals.
Plasma measurements
For plasma glucose and insulin measurements, blood was taken from the retro orbital sinus from random fed mice at 8 AM or from fasting mice at 12 PM (fasted at 8 AM). For both Lepob/ob and lean mice, glucose was measured via glucose oxidase method (Thermo Scientific). For Lepob/ob mice, insulin was measured via ELISA using a matched rat insulin antibody pair (Fitzgerald Industries International Inc.). For lean mice, insulin was measured by Linco Sensitive rat insulin radioimmunoassay.
Islet isolation and insulin secretion assays
Intact pancreatic islets were isolated from mice using a collagenase digestion procedure [38]. Static insulin secretion assays were performed on preparations consisting of three islets incubated with various secretagogues [38]. For perifusion insulin secretion assays, approximately 100 medium sized islets were washed three times, placed in a sterile Petri dish, and incubated overnight in culture media (RPMI 1640, with 11.1mM glucose, antibiotics and 10% heat inactivated fetal bovine serum). The following day, 50 islets were washed and transferred in 100 µl of Krebs Ringer Buffer (KRB) to the Swinnex filter holder (Millipore). The islets were sandwiched between two layers of Bio-Gel P-2 bead (Bio-Rad) solution (200 mg beads/ml in KRB; bottom layer, 150 µl and top layer, 300 µl). The Swinnex filter holder was attached in-line with a Minipuls 3 pump (Gilson) and a FC 204 Fraction Collector (Gilson). Islets were perifused at the rate of 1ml/min and samples were collected at 30 sec intervals. Islet insulin content and secretion were determined by ELISA.
Next generation sequencing
Tail DNA was extracted from B6, BTBR, B6.16BT36–38, B6.16BT24–37and B6.16BT24–38 mice using the QIAGEN Puregene Core Kit. RNA baits were designed using Agilent eArray and used for Agilent SureSelect Target Enrichment to capture sequence from a 35.35 to 38.65 Mb region on mouse chromosome 16. Target enrichment was followed by DNA amplification and confirmation of enrichment using SNP sequencing inside and outside of the target region. DNA was sequenced by Next Generation Sequencing using an Illumina GA IIx sequencer at the University of Wisconsin-Madison Biotechnology Center. CLC Genomics 4.0.3 Software was used to identify SNPs and DIPs between B6 and BTBR sequence. For some SNPs and DIPs an additional visual base calling confirmation step was used to test the accuracy of the software (listed in Dataset S1).
Isolation and quantitation of total RNA
RNA from islets, kidney, and liver was extracted using the QIAGEN RNeasy Plus Kit. RNA from epididymal fat pads, brain, cerebellum, and adrenal glands was extracted using QIAGEN RNeasy Lipid Kit. RNA from heart, soleus, gastrocnemius and quadriceps was extracted using QIAGEN RNeasy Fibrous Tissue Kit. Following extraction, RNA was used for cDNA synthesis (Applied Biosystems). The mRNA abundance was determined by quantitative PCR using FastStart SYBR Green (Roche) and gene expression was represented by comparative ΔCT method.
Plasmids
MMLV-based retroviral vector (RVV, 3051) (gift from Dr. Bill Sugden, University of Wisconsin, Madison) containing a MCS-IRES GFP was used to generate b-tomosyn-2-RVV construct for expression studies. The pcDNA3-m-tomosyn-1, pCR-Script-xb, -b, -m, and s-tomosyn-2 constructs were generously provided by Dr. Alexander Groffen, Virije Universiteit, Netherlands. We corrected a mutation (AG) at nucleotide 3245 of the b-Tomosyn-2 cDNA. The tomosyn-1 or tomosyn-2 cDNA from these vectors were used for subsequent subcloning. The b-tomosyn-2-RVV construct was generated by subcloning the b-tomosyn-2 cDNA with 5′-BspDI and 3′-NotI overhangs into the compatible 5′-BstBI and 3′-NotI ends of the RVV vector. For binding studies, the tomosyn-2-pcDNA/TO/myc-His was generated by subcloning a PCR-amplified tomosyn-2 cDNA in to 5′-BamHI and 3′-XhoI sites of the pcDNA4/TO/myc-His C vector (Invitrogen). The following primers that were used to amplify tomosyn-2 cDNA with the restriction sites for cloning, a partial KOZAK, and a 3′-precision protease cleavage site are: forward (5′-TTAAAGGATCCGCCACCATGAAGAAGTTTAATTTCCG) and reverse (5′-ATATCTCGAGGGGCCCCTGGAACAGAACTTCCAGGAACTGGTACCACTTCTTATCCT). Similar subcloning strategy was used for generating m-tomosyn-1-pcDNA/TO/myc-His construct. The primers used are as follows: forward (5′-CGAGACCGGATCCGCCACCATGAGGAAATTCAACATC) and reverse (5′-ATATCTCGAGCCCCTGGAACAGAACTTCCAGGAACTGGTACCACTTCTTATCTTTG) primes. The pGEX-4T1-syntaxin-4 construct encoding soluble GST-syntaxin-4 (1-273) fusion protein was generated as previously described [39]. The pGEX-2T1-syntaxin construct (1-265) was a generous gift from Dr. Tom Martin, University of Wisconsin, Madison. All constructs were verified by sequencing.
Cell culture, transient transfection, and insulin secretion measurements
The glucose responsive rat β-cell line, INS1 (832/13, a gift from Dr. Chris Newgard, Duke University) was cultured in RPMI 1640 medium containing 11 mM glucose supplemented with 10% heat inactivated fetal bovine serum, 2 mM L-glutamine, 1 mM sodium pyruvate, 10 mM HEPES, 100 Units/ml of antibiotic-antimycotic, and 50 µM β-mercaptoethanol. Approximately 100,000 cells/well were plated in a 96-well plate. The following day, INS1 (832/13) cells at 80–90% confluency were transfected with 0.4 µg of plasmid DNA using Lipofectamine 2000 (Invitrogen). After 36 h of incubation, cells were washed once with 200 µl and incubated for 2 h in 100 µl of modified Krebs-Henseleit Ringer bicarbonate buffer (KRB: 118.41 mM NaCl, 4.69 mM KCl, 1.18 mM MgSO4, 1.18 mM KH2PO4, 25 mM NaHCO3, 20 mM HEPES, 2.52 mM CaCl2, pH 7.4, and 0.2% BSA) containing 1.5 mM glucose. After 2 h, cells were stimulated for 2 h in 100 µl of KRB buffer containing 7 mM glucose + 3 mM 8-bromo-cAMP. The incubation buffer was collected to determine the amount of insulin secreted under varying conditions. The cells were lysed (lysis buffer: 1 M Tris-HCl, pH 8.0, 1 M NaCl, 0.5 M NaF, 200 mM Na3VO4, 2% NP-40, and protease inhibitor cocktail tablet (Roche)) to determine insulin content. The percent fractional insulin secretion was calculated as the amount of insulin secreted divided by total insulin content. Insulin was determined using ELISA.
The human embryonic kidney 293T cells (HEK293T) were cultured in Dulbecco's modified Eagle's medium (DMEM) containing 25 mM glucose were supplemented with 10% fetal bovine serum, 0.1 mM nonessential amino acid, 6 mM L-glutamine, 1 mM sodium pyruvate, 100 units/ml of penicillin, 100 units/ml of streptomycin, and 500 µg/ml of geneticin. HEK293T cells at 70–80% in 100 mm tissue culture dishes were transfect with plasmid DNA constructs using 40 µl of 1 mg/ml polyethylenimine. Following day, cells were lysed (lysis buffer: 20 mM Tris-HCl (pH 7.5). 150 mM NaCl, 1 mM Na2EDTA, 1mM EGTA, 1% Triton, 2.5 mM sodium pyrophosphate, 1 mM β-glycerophosphate, 1 mM Na3VO4, 1 mM PMSF, and protease inhibitor cocktail tablet (Roche)) and total protein lysates were prepared and the immunoblot was performed as described [40]. For protein stability, 16 h post transfection, cells were treated with or without 100 µM MG132 for 6 h. After 6 h, cells were lysed and whole cell lysates were prepared.
Recombinant proteins, in vitro binding assays, and immunobloting
Recombinant proteins encoding GST or GST-fusion proteins with the cytoplasmic domain of syntaxin-1A and syntaxin-4 were expressed in E.Coli strain BL21 (DE3) and were purified using glutathione-affinity chromatography [41]. The concentration and the purity of the fusion proteins were assessed by SDS-PAGE followed by Coomassie-blue staining against BSA standards. The binding studies were preformed by incubating 10 µg of recombinant proteins with 25 µl of 100% Glutathione-Sepharose 4B beads (Amersham Biosciences) with 1 mg of HEK293T lysate overexpressing tomosyn-1 or isoforms of tomosyn-2 (xb, b, m, and s) in 1% Triton-lysis buffer for 2 h at 4°C. After 2 h, the complexes were washed three times with Triton lysis buffer and was eluted in Western loading buffer. The denatured samples were subjected to 10% SDS-PAGE gels followed by transfer to PVDF membrane for immunoblotting. The immunobloting was performed using a standard protocol [40].
Statistical analysis
Data was expressed as means ± standard error of means. The statistical comparisons were made using Student's t test at p<0.05.
Supporting Information
Zdroje
1. BillingsLKFlorezJC 2010 The genetics of type 2 diabetes: what have we learned from GWAS? Annals of the New York Academy of Sciences 1212 59 77
2. CleeSMYandellBSSchuelerKMRabagliaMERichardsOC 2006 Positional cloning of Sorcs1, a type 2 diabetes quantitative trait locus. Nat Genet 38 688 693
3. ScherneckSNestlerMVogelHBluherMBlockMD 2009 Positional cloning of zinc finger domain transcription factor Zfp69, a candidate gene for obesity-associated diabetes contributed by mouse locus Nidd/SJL. PLoS Genet 5 e1000541 doi:10.1371/journal.pgen.1000541
4. Dokmanovic-ChouinardMChungWKChevreJCWatsonEYonanJ 2008 Positional cloning of “Lisch-Like”, a candidate modifier of susceptibility to type 2 diabetes in mice. PLoS Genet 4 e1000137 doi:10.1371/journal.pgen.1000137
5. ZhangSHReddickRLPiedrahitaJAMaedaN 1992 Spontaneous hypercholesterolemia and arterial lesions in mice lacking apolipoprotein E. Science 258 468 471
6. ChuaSCJrChungWKWu-PengXSZhangYLiuSM 1996 Phenotypes of mouse diabetes and rat fatty due to mutations in the OB (leptin) receptor. Science 271 994 996
7. HerbergLColemanDL 1977 Laboratory animals exhibiting obesity and diabetes syndromes. Metabolism 26 59 99
8. CleeSMNadlerSTAttieAD 2005 Genetic and genomic studies of the BTBR ob/ob mouse model of type 2 diabetes. Am J Ther 12 491 498
9. StoehrJPNadlerSTSchuelerKLRabagliaMEYandellBS 2000 Genetic obesity unmasks nonlinear interactions between murine type 2 diabetes susceptibility loci. Diabetes 49 1946 1954
10. TrayhurnP 1984 The development of obesity in animals: the role of genetic susceptibility. Clin Endocrinol Metab 13 451 474
11. MiuraAIshizukaTItayaSIshizawaMKanohY 1998 Glucose - and phorbol ester-induced insulin secretion in human insulinoma cells--association with protein kinase C activation. Biochem Mol Biol Int 46 739 745
12. HenquinJC 2000 Triggering and amplifying pathways of regulation of insulin secretion by glucose. Diabetes 49 1751 1760
13. RutterGA 2001 Nutrient-secretion coupling in the pancreatic islet beta-cell: recent advances. Mol Aspects Med 22 247 284
14. LacyPEWalkerMMFinkCJ 1972 Perifusion of isolated rat islets in vitro. Participation of the microtubular system in the biphasic release of insulin. Diabetes 21 987 998
15. ZhangWLiljaLMandicSAGromadaJSmidtK 2006 Tomosyn is expressed in beta-cells and negatively regulates insulin exocytosis. Diabetes 55 574 581
16. KellerMPChoiYWangPDavisDBRabagliaME 2008 A gene expression network model of type 2 diabetes links cell cycle regulation in islets with diabetes susceptibility. Genome research 18 706 716
17. CleeSMAttieAD 2007 The genetic landscape of type 2 diabetes in mice. Endocr Rev 28 48 83
18. ParikhHGroopL 2004 Candidate genes for type 2 diabetes. Rev Endocr Metab Disord 5 151 176
19. NeelJV 1962 Diabetes mellitus: a “thrifty” genotype rendered detrimental by “progress”? Am J Hum Genet 14 353 362
20. BonnycastleLLWillerCJConneelyKNJacksonAUBurrillCP 2006 Common variants in maturity-onset diabetes of the young genes contribute to risk of type 2 diabetes in Finns. Diabetes 55 2534 2540
21. WilliamsALBielopolskiNMerozDLamADPassmoreDR 4553
22. WangZThurmondDC 2009 Mechanisms of biphasic insulin-granule exocytosis - roles of the cytoskeleton, small GTPases and SNARE proteins. J Cell Sci 122 893 903
23. GroffenAJJacobsenLSchutDVerhageM 2005 Two distinct genes drive expression of seven tomosyn isoforms in the mammalian brain, sharing a conserved structure with a unique variable domain. J Neurochem 92 554 568
24. MasudaESHuangBCFisherJMLuoYSchellerRH 1998 Tomosyn binds t-SNARE proteins via a VAMP-like coiled coil. Neuron 21 479 480
25. HatsuzawaKLangTFasshauerDBrunsDJahnR 2003 The R-SNARE motif of tomosyn forms SNARE core complexes with syntaxin 1 and SNAP-25 and down-regulates exocytosis. J Biol Chem 278 31159 31166
26. YamamotoYMochidaSKurookaTSakisakaT 2009 Reciprocal intramolecular interactions of tomosyn control its inhibitory activity on SNARE complex formation. J Biol Chem 284 12480 12490
27. GladychevaSELamADLiuJD'Andrea-MerrinsMYizharO 2007 Receptor-mediated regulation of tomosyn-syntaxin 1A interactions in bovine adrenal chromaffin cells. J Biol Chem 282 22887 22899
28. BabaTSakisakaTMochidaSTakaiY 2005 PKA-catalyzed phosphorylation of tomosyn and its implication in Ca2+-dependent exocytosis of neurotransmitter. J Cell Biol 170 1113 1125
29. McEwenJMMadisonJMDybbsMKaplanJM 2006 Antagonistic regulation of synaptic vesicle priming by Tomosyn and UNC-13. Neuron 51 303 315
30. GrachevaEOBurdinaAOHolgadoAMBerthelot-GrosjeanMAckleyBD 2006 Tomosyn inhibits synaptic vesicle priming in Caenorhabditis elegans. PLoS Biol 4 e261 doi:10.1371/journal.pbio.0040261
31. PobbatiAVRazetoABoddenerMBeckerSFasshauerD 2004 Structural basis for the inhibitory role of tomosyn in exocytosis. J Biol Chem 279 47192 47200
32. YizharOLipsteinNGladychevaSEMattiUErnstSA 2007 Multiple functional domains are involved in tomosyn regulation of exocytosis. J Neurochem 103 604 616
33. YamamotoYMochidaSMiyazakiNKawaiKFujikuraK 0955 Tomosyn inhibits synaptotagmin-1-mediated step of Ca2+-dependent neurotransmitter release through its N-terminal WD40 repeats J Biol Chem 285 40943 40955
34. YamamotoYFujikuraKSakaueMOkimuraKKobayashiY The tail domain of tomosyn controls membrane fusion through tomosyn displacement by VAMP2. Biochem Biophys Res Commun 399 24 30
35. WidbergCHBryantNJGirottiMReaSJamesDE 2003 Tomosyn interacts with the t-SNAREs syntaxin4 and SNAP23 and plays a role in insulin-stimulated GLUT4 translocation. J Biol Chem 278 35093 35101
36. SiddiqiSManiAMSiddiqiSA The identification of the SNARE complex required for the fusion of VLDL-transport vesicle with hepatic cis-Golgi. Biochem J 429 391 401
37. ColemanDLHummelKP 1973 The influence of genetic background on the expression of the obese (Ob) gene in the mouse. Diabetologia 9 287 293
38. RabagliaMEGray-KellerMPFreyBLShortreedMRSmithLM 2005 Alpha-Ketoisocaproate-induced hypersecretion of insulin by islets from diabetes-susceptible mice. Am J Physiol Endocrinol Metab 289 E218 224
39. JewellJLOhEBennettSMMerouehSOThurmondDC 2008 The tyrosine phosphorylation of Munc18c induces a switch in binding specificity from syntaxin 4 to Doc2beta. J Biol Chem 283 21734 21746
40. BhatnagarSDamronHAHillgartnerFB 2009 Fibroblast growth factor-19, a novel factor that inhibits hepatic fatty acid synthesis. J Biol Chem 284 10023 10033
41. MinJOkadaSKanzakiMElmendorfJSCokerKJ 1999 Synip: a novel insulin-regulated syntaxin 4-binding protein mediating GLUT4 translocation in adipocytes. Mol Cell 3 751 760
Štítky
Genetika Reprodukční medicínaČlánek vyšel v časopise
PLOS Genetics
2011 Číslo 10
Nejčtenější v tomto čísle
- The Glycobiome Reveals Mechanisms of Pentose and Hexose Co-Utilization in Bacteria
- Global Mapping of Cell Type–Specific Open Chromatin by FAIRE-seq Reveals the Regulatory Role of the NFI Family in Adipocyte Differentiation
- Genetic Determinants of Serum Testosterone Concentrations in Men
- MicroRNA Expression and Regulation in Human, Chimpanzee, and Macaque Brains