
Genetic Architecture of Highly Complex Chemical Resistance Traits across Four Yeast Strains
Many questions about the genetic basis of complex traits remain unanswered. This is in part due to the low statistical power of traditional genetic mapping studies. We used a statistically powerful approach, extreme QTL mapping (X-QTL), to identify the genetic basis of resistance to 13 chemicals in all 6 pairwise crosses of four ecologically and genetically diverse yeast strains, and we detected a total of more than 800 loci. We found that the number of loci detected in each experiment was primarily a function of the trait (explaining 46% of the variance) rather than the cross (11%), suggesting that the level of genetic complexity is a consistent property of a trait across different genetic backgrounds. Further, we observed that most loci had trait-specific effects, although a small number of loci with effects in many conditions were identified. We used the patterns of resistance and susceptibility alleles in the four parent strains to make inferences about the allele frequency spectrum of functional variants. We also observed evidence of more complex allelic series at a number of loci, as well as strain-specific signatures of selection. These results improve our understanding of complex traits in yeast and have implications for study design in other organisms.
Published in the journal:
. PLoS Genet 8(3): e32767. doi:10.1371/journal.pgen.1002570
Category:
Research Article
doi:
https://doi.org/10.1371/journal.pgen.1002570
Summary
Many questions about the genetic basis of complex traits remain unanswered. This is in part due to the low statistical power of traditional genetic mapping studies. We used a statistically powerful approach, extreme QTL mapping (X-QTL), to identify the genetic basis of resistance to 13 chemicals in all 6 pairwise crosses of four ecologically and genetically diverse yeast strains, and we detected a total of more than 800 loci. We found that the number of loci detected in each experiment was primarily a function of the trait (explaining 46% of the variance) rather than the cross (11%), suggesting that the level of genetic complexity is a consistent property of a trait across different genetic backgrounds. Further, we observed that most loci had trait-specific effects, although a small number of loci with effects in many conditions were identified. We used the patterns of resistance and susceptibility alleles in the four parent strains to make inferences about the allele frequency spectrum of functional variants. We also observed evidence of more complex allelic series at a number of loci, as well as strain-specific signatures of selection. These results improve our understanding of complex traits in yeast and have implications for study design in other organisms.
Introduction
Most traits of agricultural, evolutionary, and medical significance are genetically complex, involving multiple genes that interact with one another and the environment [1]. Despite decades of effort, our understanding of how such traits are specified at the genetic level remains incomplete [2]. Studies in model organisms can provide fundamental insights into the genetic basis of complex traits that are applicable to other species, including humans [3]. However, such studies typically detect only a small fraction of the loci that contribute to a trait due to low statistical power [4].
To improve genetic mapping of complex traits in Saccharomyces cerevisiae, we recently developed extreme QTL mapping (X-QTL), which is a bulk segregant mapping technique that employs millions of cross progeny [5]. X-QTL involves three key steps: generation of very large segregating populations, isolation of cross progeny with extreme trait values, and quantitative measurement of pooled allele frequencies across the genome in these phenotypically extreme individuals [5]. To make the pools of segregants that are the starting point for X-QTL, we use selectable markers to obtain an effectively unlimited number of progeny from a cross of two strains. We then employ selection-based phenotyping to isolate large numbers of segregants with extreme trait values from populations that contain millions of cross progeny. DNA is extracted from pools of phenotypically extreme segregants, and the allele frequencies of markers throughout these individuals' genomes are determined using custom microarrays or next generation sequencing. In an X-QTL experiment, a locus that influences a trait is expected to show an allele frequency skew in the direction of the parental allele that contributes to a more extreme trait value.
By applying X-QTL to a number of chemical resistance phenotypes in a single cross of the lab strain BY4716 and the vineyard strain RM11-1a (hereafter, BY and RM, respectively), we were able to show that large numbers of loci can underlie quantitative trait variation between S. cerevisiae isolates [5]. Following our publication, another group observed similar results in a different cross [6], suggesting that high genetic complexity may be a common feature of heritable trait variation among yeast strains.
Here, we examined how genetic complexity varies among strains and crosses. We used X-QTL to identify the genetic basis of resistance to 13 diverse chemicals in all 6 pairwise crosses of strains BY, RM, YJM789, and YPS163. YJM789 (hereafter, YJM) is derived from a clinical isolate, and YPS163 (hereafter, YPS) is an oak strain. These 4 strains are highly diverged at the sequence level [7], [8], [9], [10], [11] and exhibit a wide range of heritable phenotypic differences [12], [13], [14], [15], [16], [17], [18], [19]. Because of the statistical power gained by using very large mapping populations, we detected approximately an order of magnitude more loci than did previous studies involving multiple crosses of yeast strains [15], [17], [20], allowing us to gain deeper insights into the genetic architecture and evolution of complex traits in S. cerevisiae.
Results/Discussion
We previously noted that levels of genetic complexity underlying heritable variation in growth differed among chemical conditions in a single cross [5]. Here, we sought to determine the generality of our previous finding by examining additional crosses. We first generated the strains and microarrays to conduct X-QTL in all 6 pairwise crosses of the BY, RM, YJM, and YPS strains (Materials and Methods). Because the statistical power of X-QTL is dependent on effective enrichment of highly resistant cross progeny in a segregating pool, and the crosses vary in their genetic compositions, leading to different distributions of resistance among the progeny of each cross, we used dose-response experiments to determine cross-specific, highly selective drug concentrations for each of 13 diverse chemicals that resulted in similar selection intensities for all crosses (Materials and Methods; File S1). Once the selective doses were determined, we conducted one X-QTL experiment for each chemical and cross combination.
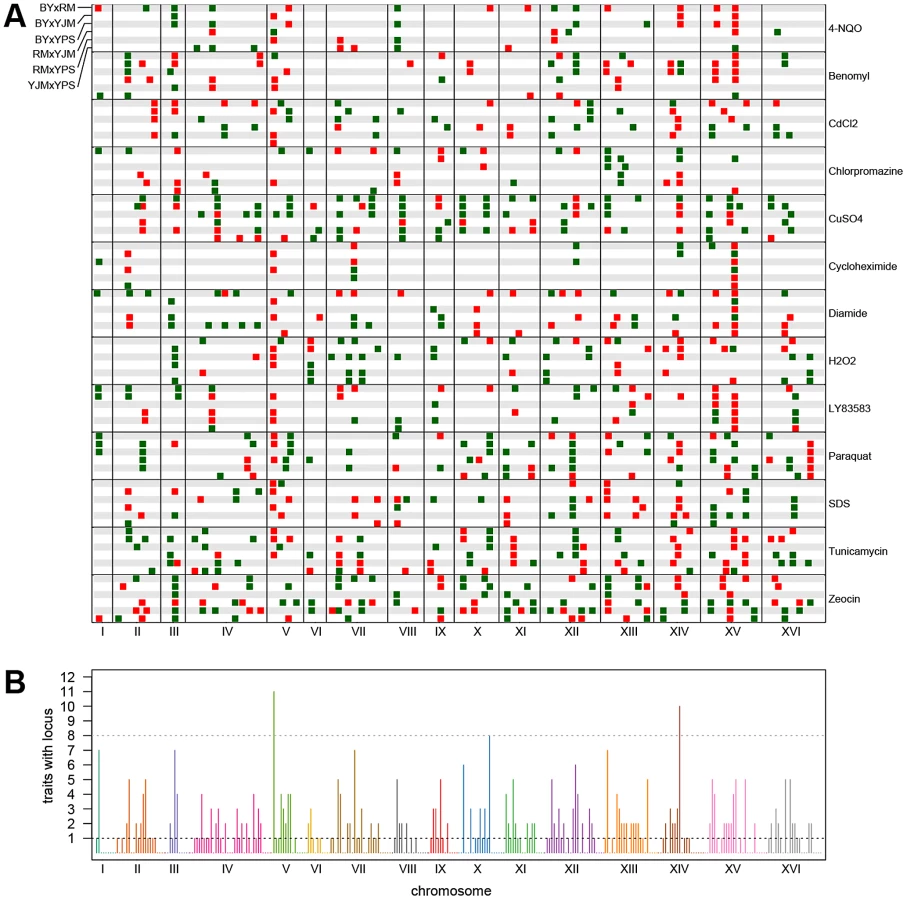
We observed substantial variation in the number of loci detected in different conditions and crosses (Figure 1). Across all 78 X-QTL experiments, we identified 837 total peaks at a False Discovery Rate (FDR) of 1%, or an average of 10.7 peaks per trait per cross (Figure 1; Figure S1A–S1M). Both the chemical and the cross had significant effects on the number of peaks detected in an X-QTL experiment (ANOVA, chemical effect F = 5.27, d.f. = 12, p = 5.67×10⁻⁶; cross effect F = 3.14, d.f. = 5, p = 0.014), with the effect of the chemical (partial R2 = 0.46) being much larger than the effect of the cross (partial R2 = 0.11). An ANOVA testing the effects of chemical and strain resulted in a similar effect of chemical on the number of detected peaks (partial R2 = 0.46; F = 4.52, d.f. = 12, p = 3.51×10⁻⁵), but no strain had a significant effect on its own (partial R2<0.02; F<2.5, d.f. = 1, p>0.12; Materials and Methods). Consistent with a comparatively small effect of strain background on genetic complexity, only one trait showed a significant excess of peaks in crosses involving any one strain: crosses in which RM was one of the parents had an excess of peaks in diamide (χ2 = 22.44, d.f. = 1, Bonferroni-corrected p = 1.97×10⁻⁴; Figure 1). These results suggest that genetic complexity in yeast is mainly a property of the trait being examined rather than of the strain background.

For each trait, we expected to detect loci at the same genomic positions in different crosses sharing a parent. To identify only the distinct loci affecting each trait, we performed a grouping procedure on the peaks identified in all crosses for a given chemical condition. We found 411 distinct loci (an average of 32 loci per condition), with a minimum of 8 loci for growth in cycloheximide and a maximum of 57 loci for growth in zeocin (Figure 1 and Figure 2A). We then examined the extent to which these loci showed effects on growth in multiple conditions. For a range of genomic window sizes, we considered peaks detected for multiple chemicals within a window to correspond to the same underlying locus, and counted the number of conditions in which the locus showed an effect. With 50-kilobase (kb) windows, we found that 40% of the distinct loci had effects in only one condition, 29% had effects in two conditions, 11% had effects in three conditions, and only 20% had effects in four or more conditions (Figure 2B; Materials and Methods). Although the numbers differed across window sizes, the general observation that most of the detected loci had effects in a relatively small number of the tested conditions, and only a small number of loci showed effects across a large number of conditions, held over the entire range of plausible sizes. With 50 kb windows, three loci exhibited effects in more conditions than expected by chance (Materials and Methods). These loci were located on Chromosome V near the X-QTL control marker CAN1, Chromosome X near ENT3, RSF2, and VPS70, and Chromosome XIV near the pleiotropic gene MKT1.
We next examined the patterns of detection of loci for each trait across the six crosses. With four strains, two simple patterns are possible at bi-allelic loci: one strain can carry an allele that confers susceptibility or resistance relative to the allele carried by the other three strains, or two strains can carry the more susceptible allele and two strains the more resistant allele. We refer to these cases as “allelic singletons” and “allelic doubletons,” respectively. These two cases should give rise to different patterns of peaks: peaks with a consistent direction of effect in all three crosses involving one strain for allelic singletons, and peaks with specific effect directions in four specific crosses for allelic doubletons (Table S1; Table 1). Allowing for false-negative peaks, 135 of the 411 distinct loci showed patterns consistent with allelic singletons, and 28 showed patterns of peaks consistent with allelic doubletons (Table S1; Table 1).

We attempted to narrow the number of candidate genes for each of the bi-allelic loci by scanning the parental genome sequences for SNP alleles that are found in the four strains in a pattern consistent with the peaks. Using this approach, we found an average of 10 candidate genes per locus, with a range of 1 to 18 genes. Further restricting the list of candidate genes to those that carry nonsynonymous polymorphisms with appropriate allelic patterns reduced the average number to 6 per locus. We attempted to validate the genes underlying some of these loci by constructing allele replacement strains, and found reproducible evidence that HXT6 and RED1 harbor functional polymorphisms that confer growth differences in rich medium and tunicamycin, respectively (Figure S2; Materials and Methods). HXT6 is a high affinity glucose transporter [21], suggesting that variability in glucose uptake may contribute to growth differences among the strains. The effect of RED1 on tunicamycin resistance is less clear, as this gene is thought to be involved in chromosome segregation [21], and tunicamycin affects the unfolded protein response. We also constructed allele replacement strains for two other genes: NUP157, which lies within a copper sulfate resistance locus with the resistance allele coming from BY, and PTK1, which lies within a paraquat resistance locus with the resistance allele coming from YPS. However, we obtained inconsistent results for NUP157 and PTK1: the allele replacements produced effects on resistance that were in the opposite direction from those seen in the X-QTL selections, and also caused growth defects on standard rich medium, suggesting that we did not identify the right candidate genes for these loci.
In addition to the simple bi-allelic patterns, we observed other more complex patterns of peaks (Figure 2A). Some of these are consistent with the presence of allelic series, in which either three or four alleles with different phenotypic effects are present among the four strains; we observed 29 examples involving at least 3 alleles and 9 examples that can only be explained by the presence of 4 different alleles (Table S2). The other 210 loci (51% of all loci) showed patterns of peaks that were not easily interpretable in terms of specific allelic classes. This probably reflects a mixture of false negatives in which a peak was present but not detected in a given cross, and cross-specific effects due to non-additive interactions and linkage between loci.
The allele frequency spectrum of causal loci is critical for the design of genetic mapping studies and for understanding sources of missing heritability in natural populations, including humans. As discussed above, we were able to distinguish and enumerate two simple allelic classes—singletons and doubletons. We used a maximum likelihood approach that accounted for false negatives to estimate the ratio of allelic singletons to doubletons. We estimated the peak detection rate to be 51%, with a 95% confidence interval of 39%–62%, and the ratio of allelic singletons to doubletons to be 3.03, with a 95% confidence interval of 1.7–5.3 (Figure 3A; Figure S3). This result suggests that despite the high statistical power of X-QTL, a substantial fraction of loci with weaker effects likely still go undetected in any one cross. Interestingly, the estimate of the ratio of allelic singletons to doubletons is similar to that observed for nonsynonymous polymorphisms in the genomes of the parent strains (2.97), and is shifted toward singletons relative to both the neutral expectation of 2.67 and the observed ratio of 2.57 for 109,585 SNPs genome-wide (Figure 3A). Thus, the frequency spectrum of variants that contribute to complex trait variation in yeast appears to be mildly shifted toward lower frequencies by purifying selection, but, given the wide confidence interval for the estimated ratio of allelic singletons to doubletons, we cannot rule out that the variant frequencies follow the neutral spectrum.

Several lines of evidence suggest that lineage-specific selection or demography has shaped variation among the four strains. We observed an excess of allelic singletons at detected loci for BY and RM, and a deficit for YJM and YPS, relative to the numbers of singleton SNPs in the parent genomes (χ2 = 35.98; d.f. = 3, p<0.0001; Figure 3B). The laboratory strain BY also exhibits other signatures of selection for both general and chemical-specific resistance. For instance, BY carries a marginally significant excess of allelic singletons that confer resistance relative to the other three strains (Fisher's exact test, Bonferroni-corrected p = 0.06; Figure 3C; Table 1). In addition, trait-specific sign tests [22] identified one significant result: an excess of copper sulfate resistance alleles contributed by BY in the BYxRM cross (18 loci with BY carrying the resistance allele and 2 loci with RM carrying the resistance allele; binomial test, Bonferroni-corrected p = 0.031; Figure 3D). Interestingly, BY is among the most copper-resistant S. cerevisiae strains [23], [24], and our data suggest that this resistance in BY may be the result of selection, possibly due to the use of high levels of copper or another chemical with similar effects in standard growth media. However, the BYxYJM and BYxYPS crosses do not show significant excess of BY alleles, and RM is also among the more highly copper-resistant strains [23], making the excess of BY resistance alleles in the BYxRM cross difficult to explain. Overall, our results are consistent with previous analyses that have shown lab strains isogenic to BY exhibit high evolutionary rates relative to other yeast isolates [25], probably due to both relaxed purifying selection [26] and adaptation [26], [27].
We have shown that variation in chemical resistance among yeast strains is typically due to a large number of underlying loci. The level of genetic complexity, as measured by the number of loci detected, is largely a property of each resistance trait, although it is also affected to a lesser extent by the choice of parent strains. The total number of distinct loci detected for a trait in these crosses among four strains ranged from 8 to 57, and these numbers substantially exceeded those seen in any one cross. These observations suggest that the total number of loci affecting certain resistance traits in S. cerevisiae can be very large, since many of them will have escaped detection because they don't vary among the four parent strains examined here, have effect sizes that are too small, or are too closely linked to be resolved as separate loci by our mapping technique. Our results suggest that the functional variants underlying complex traits are broadly distributed across the frequency spectrum from rare to common alleles, and that many loci harbor more than two allelic variants. These findings provide multiple non-exclusive explanations for the sources of the “missing heritability” of complex traits, and illustrate the power of a simple model system for probing genetic complexity.
Materials and Methods
Construction and use of segregating pools for X-QTL
The Synthetic Genetic Array marker system [28] was used to generate MATa haploid pools as previously reported [5], with the exception that thialysine and the dominant sensitive LYP1/lyp1Δ marker system were not employed. All six pairwise crosses of BY, RM, YJM, and YPS were made, with one strain in a cross having the genotype MATα can1Δ::STE2pr-SpHIS5 his3Δ and the other having the genotype MATa his3Δ. In notation describing crosses (e.g., BYxRM), we first list the MATα and then the MATa parent. The selection experiments used for X-QTL were conducted as previously described [5]. The drug doses used in the selections, which were determined by plating millions of cells across a range of drug doses and finding a concentration at which 300 to 1,000 colonies could be resolved, are given in File S1. Each experiment was conducted once, as we previously found that biological replicates conducted on the same day produced highly similar results [5].
Microarray design and use
Microarrays were designed from the BY genome sequence obtained from the Saccharomyces Genome Database (http://www.yeastgenome.org/) and from assemblies of the RM, YJM, and YPS genomes obtained from the Saccharomyces Genome Resequencing Project [10]. Note that the YPS606 genome was used to design the YPS array, as YPS606 is isogenic to YPS163. We aligned the genomes chromosome-by-chromosome using Fast Statistical Alignment (FSA) [29]. These multiple sequence alignments were filtered for SNPs using the following criteria: i) all 4 strains had to have been sequenced at a position and ii) all 4 strains had to have a specific base called (i.e. A, C, G, or T) at the position. These SNPs were then used for microarray design, as well as for downstream population-genetic analyses. Cross-specific microarrays were designed using only bi-allelic SNPs. Probes were chosen to have a length between 21 and 27 nucleotides and a melting temperature between 54 and 56°C as described previously [5], [30]. One probe was designed for each allele of a SNP, and the two probes for a SNP were randomly positioned on the microarray. Probes were targeted to regions where only one SNP would be covered by the probes. Markers were chosen to provide near-uniform coverage of the genome. The arrays were tested using control DNA from both parents and the heterozygous diploid to ensure that they could discriminate the two alleles of a SNP. All hybridizations and processing was done as previously described [5]. All microarray data is available in the Princeton University MicroArray database (http://puma.princeton.edu/). The processed log10 hybridization intensities are included in Files S2, S3, S4, S5, S6, S7.
Peak detection
For a given SNP, the difference in the log10 ratios of the intensities of the MATα and MATa parent-specific probes on a single array was computed (subsequently referred to as a ‘log10 intensity difference’), and this metric was used in downstream analyses. Background allele frequency changes that occur during pool construction were removed from the data for each X-QTL selection. This was done separately for each SNP by subtracting the average log10 intensity difference obtained in seven cross-specific control experiments from the log10 intensity difference observed in an X-QTL selection. A peak detection algorithm was then employed that used a Savitzky-Golay filter to smooth the data within sliding windows of 100 probes. This smoothing approach was used to preserve local maxima in the data. Loci were called at a 1% FDR threshold, where the number of false discoveries was determined by running the peak caller on the control data using a range of thresholds, and the total number of discoveries was determined by running the peak caller on the selection data at the same thresholds used to analyze the controls. Thresholds were set by examining the quantiles of log10 intensity differences observed for every 100 SNP genomic window on an array, and taking the median interquantile range between the x and 1-x quantiles, where x ranged from 0.005 to 0.45. We found that setting x as 0.045 resulted in a 1% FDR. Peak calling and all other statistical analyses were conducted in R (http://www.r-project.org/). The peak caller and an associated function library are included in Files S8 and S9. The detected peaks are listed in File S10.
Testing for effects of chemical and genetic background on the number of peaks detected in a cross
The test for cross effect was conducted using the model y = chemical+cross, while the test for strain effect was conducted using the model y = chemical+strain1+strain2+strain3. Implementing the second test required specifying the design matrix for the strain effect. Each row in the design matrix represented a single X-QTL experiment from a particular combination of chemical and cross. Entries in the design matrix were parameterized as follows: a strain had a value of −1, 1, or 0 if it was the MATa parent, the MATα parent, or not a parent in a particular experiment, respectively. Only three strains were included in the test, because the information for the fourth could be obtained from the other three. To ensure that results were not dependent on the three included strains, we conducted the test with all four possible combinations of the three strains and reported the maximum partial R2 and F values, and the minimum p value in the text.
Testing for disproportionate contributions of particular strains to the genetic complexity of traits
We first conducted χ2 tests in which single strains were examined. This test has two categories – one that is the sum of the peaks detected in the three crosses involving the query strain and another that is the sum of the peaks detected in the other three crosses. The expectation is that each of these classes will contain half of the peaks detected for a trait. We then conducted χ2 tests in which two strains were examined. The first category here is the sum of the peaks detected in the four crosses involving the two strains, while the second is sum of the peaks detected in the other two crosses. Here, the expectation is that the first category will contain two-thirds of the peaks, while the second will contain one-third of the peaks.
Identification of distinct loci for a trait
Peaks identified across the six crosses for a single trait were grouped into distinct loci. We started with the most strongly selected peak on each chromosome and grouped with it all peaks that occurred within a 200-kilobase window surrounding it. This window size accommodated the grouping of peaks that exhibited weak but significant allele frequency changes, and may result in the underestimation of the total number of loci due to the overgrouping of peaks. Remaining peaks were grouped into distinct loci using additional iterations of the procedure until all peaks identified for a trait were members of a group.
Analysis of distinct loci across traits
We divided the genome into equally sized bins ranging from 20 to 100 kb and counted the number of distinct loci that fell into each bin. A bin was considered to have an excess of distinct loci if the number present in it exceeded the number expected by chance from a Poisson distribution, given the number of distinct loci divided by the total number of bins and a multiple testing correction for the number of bins. With the 50 kb bin size reported in the text, 8 or more distinct loci were required to be present in a bin for the bin to be considered significant.
Identification of allelic singletons, doubletons, and series
The distinct loci identified for each trait were used to classify singletons and doubletons. The specific patterns used to identify the allelic classes are described in Table S1. We focused on exact pattern matches and on patterns that were missing an expected peak at a given locus in one cross. A number of distinct loci had peaks detected in four or more crosses, but did not conform to the patterns expected for allelic doubletons. We considered these loci as allelic series, and for each of these putative series we determined the possible logical relationships of the parent alleles to each other. These relationships are reported in Table S2.
Identification of candidate causal genes
For each bi-allelic locus, we evaluated a 30 kb interval centered on its estimated position for polymorphisms that segregated among the parent strains in the same pattern as the X-QTL peaks. Any gene that harbored a polymorphism in the coding region or in the immediate upstream and downstream regions was considered a candidate. The candidate genes are listed in File S11.
Allele replacement strategy
To generate the replacement strains, we used the allele replacement technique described by Storici et al. [31]. This method is a two-step process that involves knocking out a gene with a selectable marker cassette, and then replacing the selectable marker cassette with a different allele of the gene. We made each allele replacement strain once in one parental background, and then compared the phenotypes of the strains to their progenitors. For the two genes that exhibited the expected phenotypic effect, we made a second version of the allele replacement strain to validate the presence of functional variation in the gene.
Maximum likelihood estimation of the ratio of singletons to doubletons
The observed counts of exact-match allelic singletons and doubletons and near-exact-match allelic singletons and doubletons were modelled using two parameters: the detection rate of peaks (α) and the ratio of singletons to doubletons (β). The formulae underlying this computation are provided in Text S1. The likelihood of each combination of parameter values was examined across a two-dimensional grid of parameter values using χ2 tests with 3 degrees of freedom. The likelihood reached a maximum at α = 0.51 and β = 3.03. We obtained 95% confidence intervals for α and β by using the χ2 distribution with 3 degrees of freedom and identifying the χ2 value for the 95% quantile. We then identified parameter combinations that produced an χ2 value below this threshold (7.81), and determined the minimum and maximum values of α and β that satisfied this condition.
Supporting Information
Zdroje
1. FalconerDSMackayTF 1996 Introduction to quantitative genetics (4th edition) Harlow, England Pearson Education Limited
2. ManolioTACollinsFSCoxNJGoldsteinDBHindorffLA 2009 Finding the missing heritability of complex diseases. Nature 461 747 753
3. MackayTFStoneEAAyrolesJF 2009 The genetics of quantitative traits: challenges and prospects. Nat Rev Genet 10 565 577
4. BremRBKruglyakL 2005 The landscape of genetic complexity across 5,700 gene expression traits in yeast. Proc Natl Acad Sci U S A 102 1572 1577
5. EhrenreichIMTorabiNJiaYKentJMartisS 2010 Dissection of genetically complex traits with extremely large pools of yeast segregants. Nature 464 1039 1042
6. PartsLCubillosFAWarringerJJainKSalinasF 2011 Revealing the genetic structure of a trait by sequencing a population under selection. Genome Res 21 1131 1138
7. DonigerSWKimHSSwainDCorcueraDWilliamsM 2008 A catalog of neutral and deleterious polymorphism in yeast. PLoS Genet 4 e1000183 doi:10.1371/journal.pgen.1000183
8. WeiWMcCuskerJHHymanRWJonesTNingY 2007 Genome sequencing and comparative analysis of Saccharomyces cerevisiae strain YJM789. Proc Natl Acad Sci U S A 104 12825 12830
9. RuderferDMPrattSCSeidelHSKruglyakL 2006 Population genomic analysis of outcrossing and recombination in yeast. Nat Genet 38 1077 1081
10. LitiGCarterDMMosesAMWarringerJPartsL 2009 Population genomics of domestic and wild yeasts. Nature 458 337 341
11. SchachererJShapiroJARuderferDMKruglyakL 2009 Comprehensive polymorphism survey elucidates population structure of Saccharomyces cerevisiae. Nature 458 342 345
12. BremRBYvertGClintonRKruglyakL 2002 Genetic dissection of transcriptional regulation in budding yeast. Science 296 752 755
13. SteinmetzLMSinhaHRichardsDRSpiegelmanJIOefnerPJ 2002 Dissecting the architecture of a quantitative trait locus in yeast. Nature 416 326 330
14. PerlsteinEORuderferDMRobertsDCSchreiberSLKruglyakL 2007 Genetic basis of individual differences in the response to small-molecule drugs in yeast. Nat Genet 39 496 502
15. KimHSFayJC 2007 Genetic variation in the cysteine biosynthesis pathway causes sensitivity to pharmacological compounds. Proc Natl Acad Sci U S A 104 19387 19391
16. GerkeJLorenzKCohenB 2009 Genetic interactions between transcription factors cause natural variation in yeast. Science 323 498 501
17. KimHSFayJC 2009 A combined-cross analysis reveals genes with drug-specific and background-dependent effects on drug sensitivity in Saccharomyces cerevisiae. Genetics 183 1141 1151
18. McCuskerJHClemonsKVStevensDADavisRW 1994 Genetic characterization of pathogenic Saccharomyces cerevisiae isolates. Genetics 136 1261 1269
19. EhrenreichIMGerkeJPKruglyakL 2009 Genetic dissection of complex traits in yeast: insights from studies of gene expression and other phenotypes in the BYxRM cross. Cold Spring Harb Symp Quant Biol 74 145 153
20. CubillosFABilliEZorgoEPartsLFargierP 2011 Assessing the complex architecture of polygenic traits in diverged yeast populations. Mol Ecol 20 1401 1413
21. Saccharomyces Genome Database 2011 http://www.yeastgenome.org/
22. OrrHA 1998 Testing natural selection vs. genetic drift in phenotypic evolution using quantitative trait locus data. Genetics 149 2099 2104
23. FayJCMcCulloughHLSniegowskiPDEisenMB 2004 Population genetic variation in gene expression is associated with phenotypic variation in Saccharomyces cerevisiae. Genome Biol 5 R26
24. KvitekDJWillJLGaschAP 2008 Variations in stress sensitivity and genomic expression in diverse S. cerevisiae isolates. PLoS Genet 4 e1000223 doi:10.1371/journal.pgen.1000223
25. WarringerJZorgoECubillosFAZiaAGjuvslandA 2011 Trait variation in yeast is defined by population history. PLoS Genet 7 e1002111 doi:10.1371/journal.pgen.1002111
26. GuZDavidLPetrovDJonesTDavisRW 2005 Elevated evolutionary rates in the laboratory strain of Saccharomyces cerevisiae. Proc Natl Acad Sci U S A 102 1092 1097
27. FraserHBMosesAMSchadtEE 2010 Evidence for widespread adaptive evolution of gene expression in budding yeast. Proc Natl Acad Sci U S A 107 2977 2982
28. TongAHEvangelistaMParsonsABXuHBaderGD 2001 Systematic genetic analysis with ordered arrays of yeast deletion mutants. Science 294 2364 2368
29. BradleyRKRobertsASmootMJuvekarSDoJ 2009 Fast statistical alignment. PLoS Comput Biol 5 e1000392 doi:10.1371/journal.pcbi.1000392
30. GreshamDCurryBWardAGordonDBBrizuelaL 2010 Optimized detection of sequence variation in heterozygous genomes using DNA microarrays with isothermal-melting probes. Proc Natl Acad Sci U S A 107 1482 1487
31. StoriciFLewisLKResnickMA 2001 In vivo site-directed mutagenesis using oligonucleotides. Nat Biotechnology 19 773 776
Štítky
Genetika Reprodukční medicínaČlánek vyšel v časopise
PLOS Genetics
2012 Číslo 3
Nejčtenější v tomto čísle
- PIF4–Mediated Activation of Expression Integrates Temperature into the Auxin Pathway in Regulating Hypocotyl Growth
- Metabolic Profiling of a Mapping Population Exposes New Insights in the Regulation of Seed Metabolism and Seed, Fruit, and Plant Relations
- A Splice Site Variant in the Bovine Gene Compromises Growth and Regulation of the Inflammatory Response
- Comprehensive Research Synopsis and Systematic Meta-Analyses in Parkinson's Disease Genetics: The PDGene Database