
Spo0A∼P Imposes a Temporal Gate for the Bimodal Expression of Competence in
ComK transcriptionally controls competence for the uptake of transforming DNA in Bacillus subtilis. Only 10%–20% of the cells in a clonal population are randomly selected for competence. Because ComK activates its own promoter, cells exceeding a threshold amount of ComK trigger a positive feedback loop, transitioning to the competence ON state. The transition rate increases to a maximum during the approach to stationary phase and then decreases, with most cells remaining OFF. The average basal rate of comK transcription increases transiently, defining a window of opportunity for transitions and accounting for the heterogeneity of competent populations. We show that as the concentration of the response regulator Spo0A∼P increases during the entry to stationary phase it first induces comK promoter activity and then represses it by direct binding. Spo0A∼P activates by antagonizing the repressor, Rok. This amplifies an inherent increase in basal level comK promoter activity that takes place during the approach to stationary phase and is a general feature of core promoters, serving to couple the probability of competence transitions to growth rate. Competence transitions are thus regulated by growth rate and temporally controlled by the complex mechanisms that govern the formation of Spo0A∼P. On the level of individual cells, the fate-determining noise for competence is intrinsic to the comK promoter. This overall mechanism has been stochastically simulated and shown to be plausible. Thus, a deterministic mechanism modulates an inherently stochastic process.
Published in the journal:
. PLoS Genet 8(3): e32767. doi:10.1371/journal.pgen.1002586
Category:
Research Article
doi:
https://doi.org/10.1371/journal.pgen.1002586
Summary
ComK transcriptionally controls competence for the uptake of transforming DNA in Bacillus subtilis. Only 10%–20% of the cells in a clonal population are randomly selected for competence. Because ComK activates its own promoter, cells exceeding a threshold amount of ComK trigger a positive feedback loop, transitioning to the competence ON state. The transition rate increases to a maximum during the approach to stationary phase and then decreases, with most cells remaining OFF. The average basal rate of comK transcription increases transiently, defining a window of opportunity for transitions and accounting for the heterogeneity of competent populations. We show that as the concentration of the response regulator Spo0A∼P increases during the entry to stationary phase it first induces comK promoter activity and then represses it by direct binding. Spo0A∼P activates by antagonizing the repressor, Rok. This amplifies an inherent increase in basal level comK promoter activity that takes place during the approach to stationary phase and is a general feature of core promoters, serving to couple the probability of competence transitions to growth rate. Competence transitions are thus regulated by growth rate and temporally controlled by the complex mechanisms that govern the formation of Spo0A∼P. On the level of individual cells, the fate-determining noise for competence is intrinsic to the comK promoter. This overall mechanism has been stochastically simulated and shown to be plausible. Thus, a deterministic mechanism modulates an inherently stochastic process.
Introduction
Stochastic gene expression during development has received much attention in both bacterial and eukaryotic systems [1], [2], [3]. The developmental choices exhibited by the model bacterium Bacillus subtilis have emerged as favorite subjects for the analysis of stochastic decisions [4], [5], [6], [7], [8], [9], [10], [11]. When faced with the exhaustion of nutrients, individual bacteria may sporulate, become “competent”, or may form multi-cellular communities (biofilms) [12], [13], [14], [15]. Remarkably, all of these adaptive responses are expressed heterogeneously in populations. For example, only about 10–20% of the cells in a culture express the proteins needed for the uptake of DNA [16], [17]; most of the cells therefore remain in the non-competent state. The selection of cells for competence is random, driven by noise in the expression of a transcription factor gene, comK [5], [6], [8].
ComK is the proximal regulator of competence gene expression. This protein not only activates transcription of the downstream genes that encode DNA-uptake proteins, but also positively regulates its own promoter, and activation of the resulting positive feedback loop is at the heart of the decision to become competent [18], [19], [20]. Cells with more than a threshold amount of ComK induce further expression of comK and as a result can express the downstream genes. Explicit models have been suggested to explain the behavior of this system and experimental evidence has served to test and confirm the general validity of the models, particularly the central roles of positive feedback, a thresholded response to ComK and of noise in comK expression [5], [6], [8], [19], [20], [21]. During long-term cultivation, cells have been observed to enter and then exit the competent state, prompting the description of competence as an excitable system [5]. In bulk cultures grown to saturation, the rate of transitions to the competence-ON state increases rapidly as the culture approaches stationary phase and then decreases, approaching zero 1–2 hours later, so that most cells never express competence genes [8], [11], [22]. An explanation for this “window of opportunity” was provided by the observation that the basal level of comK mRNA increases during growth and then decreases, reaching a maximum level of 1–2 transcripts per cell near the time of the highest transition rate [8], [11]. Thus as the average mRNA content (and therefore the average ComK content) of the population increases, more cells cross the threshold and become competent. As the rate of transcription then approaches zero and comK transcripts decay, the average ComK content per cell no longer increases, or does so slowly. Cells that were already across the threshold would become competent with high probability and cells below the threshold would tend to remain in the OFF state. The increase and decrease in comK promoter activity (referred to hereafter as the “uptick”) was thus assigned the important role of defining the window of opportunity for making competent cells. In other words, a programmed regulatory change would adjust the probability of this developmental transition, modulating a stochastic decision-making process.
We show here that the phosphorylated form of the response-regulator protein Spo0A both activates and represses the basal firing rate of PcomK and does so by direct binding to a series of activator and operator sites. Hence, the gradual increase in Spo0A∼P (OA∼P throughout) as cells enter stationary phase, which is documented in this report, influences the uptick profile of PcomK activity. Remarkably, 0A∼P acts on PcomK by amplifying a general increase in the rate of transcription also characteristic of synthetic “core” promoters containing only the −35 and −10 RNA polymerase (RNAPol) recognition motifs, which takes place as growth slows. This amplification is largely due to the action of 0A∼P as an anti-repressor toward the repressor protein Rok. As predicted by this mechanism, we show that a cell destined for competence must have a level of 0A∼P within a certain permissive range; below and above this range the probability of transition is low. We also show that noise in the level of 0A∼P within the permissive range makes a relatively small contribution to the determination of which cells transition to competence. This choice depends instead on intrinsic cell-to-cell variation in the firing of PcomK. We propose that an extrinsically determined increase in the average firing rate of core promoters and a programmed increase in 0A∼P concentration define the window of opportunity for entrance to the competent state.
Results
The uptick of PcomK activity is controlled by Rok and 0A∼P
Based on measurements in single cells, we previously reported an uptick in the content of comK transcripts and it has been proposed that this variation determines the probability of transition to the competent state [8], [11]. Figure 1A shows that the uptick is also evident from ensemble measurements, using a fusion of PcomK to the firefly luciferase coding sequence (luc). For this, the cultures were grown in a temperature-controlled plate reader in the presence of luciferin, as previously described [23], a method characterized by remarkable reproducibility (Figure S1). It is important to recognize that luciferase activity reports the transcription rate, rather than the cumulative activity of PcomK [23]. As shown in Figure 1A and 1B, and confirming the previous result obtained with fluorescence in situ hybridization, the uptick is independent of comK. Thus, the basal level of comK promoter activity increases in the null-mutant comK strain during growth, reaching a maximum when the growth rate decreases, and thereafter declines. In a comK+ strain, the initial rise is identical, but as the positive feedback is activated and cells transition to competence expression, a massive induction of PcomK takes place, obscuring the decline in the basal level expression that is known to take place in the non-competent cells [8], [11].

Using the PcomK-luc fusion in a comK null-mutant strain, we adopted a candidate approach to determine factors involved in the uptick, introducing null-mutations in each of the genes known to encode regulatory factors for competence; rok, spo0A, degU, abrB, codY and sinR. Although several of these mutations slightly modified the amplitude of the uptick (not shown), only spo0A and rok exhibited major effects. In a spo0A null background (Figure 1B and 1C), the amplitude of the uptick was decreased about 9-fold, consistent with the observation that a spo0A loss-of-function mutant does not express competence genes [24]. The negative effect of the spo0A null mutant was not reversed by inactivation of abrB, showing that it is not due to over-expression of this repressor (not shown). When plotted to equalize the peaks of the spo0A+ and Δspo0A strains, the increasing portions of the uptick in the two strains are closely similar (Figure 2A). In both strains the downward portion begins at the same time, but that of the spo0A+ strain is more abrupt (Figure 2A). It appears that Spo0A amplifies an underlying increase in the transcription rate of comK and also contributes to the relatively sharp decrease in the transcription rate that normally takes place. Thus, we predict that OA∼P may exert both positive and negative effects on PcomK, depending on its time of action. All of the known activities of Spo0A are dependent on its phosphorylation by a phosphorelay, in which several kinases feed phosphoryl groups to a cascade of three proteins, the last of which is Spo0A [25]. The activity of Spo0A just described is no exception; inactivation of a phosphorelay gene (spo0F) and of two kinases (kinA and kinB) decreases the uptick amplitude (Figure S2).

As previously reported, in the absence of Rok, a repressor of PcomK [26], the amplitude of the uptick was enhanced markedly but the timing of its onset was not altered [8], [26]. (Compare the ΔcomK and ΔcomK Δrok strains in Figure 1C.) The increased amplitude is consistent with the published observation that the fraction of competent cells increases to 70–80% in a Δrok comK+ strain, while the time of transition to competence is not changed [26]. Because the average basal level of comK expression is increased in the rok strain, more cells exceed the threshold for competence. Importantly, when rok was inactivated in the ΔcomK Δspo0A background, a dramatic recovery of PcomK-luc activity was observed, to about 60% of the level of the ΔcomK Δrok spo0A+ strain (Figure 1C). This recovery suggests that 0A∼P may act at least in part by antagonizing the action of Rok. These changes in PcomK activity were not due to an effect of spo0A inactivation on the amount of Rok protein (Figure S3) and we show below that they are explained instead by direct interactions of Rok and 0A∼P with the promoter of comK. In the two Δrok strains shown in Figure 1C the decreasing segment of the expression profiles was altered by the appearance of a pronounced shoulder. The evidence presented so far suggests that Rok and 0A∼P contribute to the normally abrupt downturn in transcription rate from PcomK as well as acting respectively as repressor and activator of PcomK earlier in the development of competence.
We wondered if the changes in PcomK expression observed even in the Δspo0A strain (Figure 2A) were specific to the comK promoter or were more global in nature. To answer this question we tested a synthetic SigA-dependent promoter derived from random sequences, except for the presence of canonical −35 and −10 motifs (PsynthA) (Figure S4). This promoter was fused to the luc coding sequence, preceded by the ribosomal binding site from the spoVG gene. Figure 2B shows that PsynthA exhibited an expression profile very similar to that of PcomK in the ΔcomK Δrok Δspo0A background. A similar result was obtained using a previously described [23] fusion of luc to a stripped-down promoter consisting of the −35 and −10 sequences of the spo0A vegetative (SigA-dependent) promoter (not shown). We have also constructed a synthetic promoter carrying Sigma H motifs (PsynthH) and fused this to luc. This promoter also showed a pattern like that of the PsynthA promoter (Figure S4). We conclude that PcomK exhibits a change in activity during the transition to stationary phase, which is a general characteristic of promoter core elements. It also appears that Spo0A and Rok modulate this activity change in the case of PcomK, causing changes in amplitude and collaborating to suppress the shoulder that occurs in the core promoters during the downward response. We suspect that these core promoter changes reflect global metabolic changes during the slowing of growth as cells approach stationary phase, perhaps due to the release of RNAPol from the transcription of stable RNA genes [23].
Structure of the comK promoter region
These effects of rok and spo0A on PcomK activity prompted examination of the sequence surrounding PcomK (Figure 3). ComK is known to act positively on its own promoter, interacting with ComK boxes located upstream of the −35 SigA recognition motif [27], while Rok represses PcomK by direct binding [26]. Rok is known to interact at least within an approximately 100 bp region (Figure 3B) [28], which overlaps the ComK boxes and has been shown to bind preferentially to AT-rich sequences [29]. ComK activates PcomK largely as an anti-repressor for Rok, although it does not displace this repressor from the DNA [28].

Inspection of the region surrounding PcomK revealed five sequences resembling the Spo0A binding consensus [30], which are illustrated in Figure 3A and 3B. The positions of these sequences suggested that three of them (A1, A2 and A3) functioned as activation sites and that the remaining two (R1 and R2) were sites for repression. None of these putative binding motifs have more than 2 out of 7 differences from the consensus and A1 and 3 have one mismatch each. The presence of the putative 0A∼P binding sites and their locations suggested a role for increasing concentrations of 0A∼P, activating at A1, 2 and 3 and then repressing at R1 and 2. Such a mechanism would resemble the action of 0A∼P at the promoter of sinI [31] although in the present case we must also posit a regulatory role for Rok. This model requires that 0A∼P binds directly to PcomK at the sites we have identified. We were encouraged by a previous observation that Spo0A was able to bind to a comK promoter fragment [30]. Accordingly, we next determined whether Spo0A does indeed bind to A1, 2, 3 on one hand, and to R1 and R2 on the other.
0A∼P binds directly to PcomK
To test the binding of Spo0A to sequences surrounding PcomK, we utilized gel shifts of radiolabeled DNA fragments incubated with purified full length 0A∼P. Figure 4B shows the results of an experiment using a 128 bp fragment (Figure 4A) containing A1, 2 and 3 and an identical experiment with the same fragment in which the putative Spo0A binding sites carried the triple A123 mutations described above (Figure 3C). With the wild type fragment, 50% of the probe was shifted by a Spo0A concentration of about 50 nM. Due to uncertainty concerning the fraction of phosphorylated versus unphosphorylated protein, this is likely to be an overestimate of the nominal KD. The mutant fragment exhibited little or no shift over the protein concentration range used for this experiment. These results strongly suggest that 0A∼P binds to PcomK directly, and that the sequences identified as A1, 2 and 3 are important for binding, in agreement with the in vivo data in Figure 5 and Figure 6.


A similar experiment (Figure 4C) was carried out using a 146 bp fragment (Figure 4A) containing R1 and 2 as well as an identical fragment with the mutations that were shown to inactivate these sites in vivo (Figure 3, Figure 5E and 5F). A shift was noted with the wild type fragment, with a nominal KD of 100–150 nM. Once again the mutant fragment exhibited little or no evidence of binding.
To test whether A2 is a binding site for Rok, a gel shift experiment was carried out using the wild type 128 bp probe fragment also used in Figure 4B. Multiple shifted bands were detected (Figure 4D, upper panel) with a KD in the low nanomolar range, consistent with results obtained with other promoters [26]. The A2 mutation indicated in Figure 3C was introduced into this probe and the gel shift results obtained with Rok (Figure 4D, lower panel) permit two conclusions. First, the nominal KD is shifted from about 15 nM to about 50 nM, and two shifted bands, indicated by arrows in the figure are missing with the mutant probe consistent with a high affinity interaction of Rok with A2. Second, even with A2 inactivated, residual lower affinity interaction of Rok to this probe remains, suggesting that Rok interacts with additional nearby sites.
Regulation at PcomK
As a first test of the roles of the putative OA∼P binding sites, we introduced mutations (Figure 3C) and determined their effects on PcomK-luc expression in a comK background. Because R1 overlapped the −35 motif we changed this motif to the consensus TTGACA to avoid inactivating the promoter, leaving only three out of seven bases of the −35 consensus. The other mutant Spo0A boxes retained two out of seven consensus bases.
Inactivation of either R1 or R2 introduced prominent shoulders in the declining portion of the uptick profile, without changing the timing of the increasing segment (Figure 5A and 5B), supporting a role for these sequences in closing the window of opportunity. Although the amplitude of the R1 shoulder is greater than that of R2, the timings of the increases and decreases in the two profiles are similar. These profiles also resemble those of the various Δrok and Δspo0A constructs and of the PsynthA-luc and PsynthH fusions (Figure 1C, Figure 2A and 2B, Figure S4). Figure S5 shows a comparison of the declining portions of the R1, R2, PsynthA and wild type promoters and the effects of the Δrok, Δspo0A and combined Δrok and Δspo0A mutations, with their peak values normalized. The roughly similar overall shapes of these curves are consistent with the predicted role for 0A∼P as a repressor that interacts with R1 and 2, collaborating with Rok in suppressing a continuation of PcomK activity. The observation that inactivation of either spo0A or rok gives a similar slow decrease in the rate of comK transcription and that these rates resemble that when both spo0A and rok are inactivated, suggests strongly that the two proteins work together in repressing comK transcription.
Inactivation of either A1 or 3 reduced the uptick to the level of the spo0A null-mutant, in support of the hypothesis that these are activating sites for interaction with 0A∼P (Figure 5C and 5D). Unexpectedly, inactivation of A2 had the opposite effect, increasing expression dramatically, nearly to the level of the rok mutant (compare Figure 6A and 6B). The strain with both the Δrok and A2 mutation exhibited an amplitude equal to that of the rok mutation alone (compare Figure 6A and 6B). These results suggested that A2 might overlap a binding site for Rok, and that 0A∼P may act at this sequence, competing for Rok binding or otherwise interfering with Rok activity. In fact, in the sequence covering A2 and extending between the centers of A1 and 3, 44 out of 54 bases are either A or T (Figure 3), and Rok has been found to bind preferentially to AT-rich DNA [29]. When A1, 2 and 3 were mutated simultaneously, the maximum expression decreased by about half from the level of the A2 mutant alone (compare Figure 6A and Figure 7A) showing that A1 and 3 retained an activating role even when A2 was inactivated. When rok was eliminated and A1, 2 and 3 were also mutated, the amplitude of the profile increased slightly compared to the A123 triple mutant in the rok+ background (Figure 7B), much less than the nearly five-fold increase caused by inactivation of rok in the wild type promoter background (Figure 1C). It is likely that our mutations have not completely eliminated Rok binding. This conclusion is supported by the demonstration that Rok binding with lowered affinity is retained nearby when A2 is inactivated (Figure 4D).

When a spo0A knockout was introduced into the A123 strain, a small decrease in amplitude (∼30%, compared to a nine-fold decrease with the wild type promoter (Figure 1B)) was observed (Figure 7B), supporting the conclusion that the major role of 0A∼P is to antagonize Rok.
A model for uptick regulation
The working model suggested by the above data requires that both the increase and decrease of comK basal transcription are largely determined by a continual rise in the amount of OA∼P. We have shown that the rate of spo0A transcription increases and is then maintained throughout the time of the uptick, with a pattern similar to that of core promoters e.g. PsynthA, suggesting that this continual rise does occur (Figure S6). In addition, the transcription of a luc fusion to the OA∼P-dependent sdp promoter increases throughout the uptick (not shown), confirming that the amount of OA∼P in the cell increases.
The data suggest that during the upward segment of the PcomK uptick, 0A∼P amplifies an inherent rise in PcomK activity by binding to A1, 2 and 3, thereby interfering with the activity of Rok. Three pieces of evidence support this role of OA-P as an anti-repressor. First, the inactivation of A2, identified from its sequence as an OA∼P binding site, imparts a Rok-like phenotype. Second, A2 and its surrounding sequence is AT-rich, as expected for a Rok binding site and third, in a Δrok background, the Δspo0A phenotype is essentially lost.
The inherent rise that is amplified by 0A∼P is a general one, reflecting some aspect of cell physiology that occurs as growth slows. In addition to its activity as an anti-repressor of Rok, there must be another, relatively minor component of 0A∼P activation. This is apparent from a comparison of the uptick in a ΔcomK Δrok Δspo0A strain with a ΔcomK Δrok spo0A+ strain (Figure 1C). This minor component may be due to interference with the activity of CodY, which plays a relatively small role in repression at PcomK [28], [32] (and results not shown). It is also possible that 0A∼P acts as a classical activator, contacting RNAPol.
The decrease in PsynthA expression begins at the same time as in PcomK, but is less abrupt and possesses a prominent shoulder (compare Figure 1B with Figure 2B). When rok alone or both spo0A and rok were inactivated, a similar shoulder was observed in the decline of PcomK expression (Figure 1C, Figure 2B) and the same was true with the R1 and R2 mutants (Figure 5A and 5B). The data suggest that increasing concentrations of 0A∼P interact with R1 and R2, reducing expression and that repression by Rok aids in shutting down PcomK expression.
The concentration of 0A∼P sets limits on competence
Our working model suggests that the uptick will occur within an intermediate range of 0A∼P concentration. As a test of this prediction, we wished to measure the fluorescence intensities in individual cells of a comK+ strain co-expressing fluorescent protein fusions to promoters that report respectively 0A∼P concentration and PcomK activity. To interpret these data, it was first necessary to determine the level of PcomK expression above which cells can be classified as competent. We therefore carried out a calibration experiment using a PcomK-cfp fusion co-expressed with the ComK-dependent promoter PcomG, fused to yfp, collecting data at 1.5 and 4 hours after the onset of stationary phase (Figure S7). Before 1.5 hours, the fluorescent signals are too weak to permit accurate data collection. The average expression of both markers increased between the two time points. In Figure S7B, most of the cells cluster with low levels of both YFP and CFP. Those with higher amounts of PcomG-yfp expression have more than 50 units of CFP fluorescence. These cells comprise 13.3% of the total population, in good agreement with the range of values (10–20%) reported in the literature for the fraction of cells that become competent [8], [11], [20], [33]. This value was transferred to Figure S7A, in which a box is shown surrounding cells which fall within the upper 13.3% of CFP fluorescence. It is satisfying that the lower edge of this box includes all of the cells with elevated expression of comK-cfp, showing that the transitions had reached a limit at the earlier time, as expected [8], [11]. This lower limit of PcomK-cfp expression at the earlier time point corresponded to a value (in arbitrary units) of 36. This value was then used for further experiments, to determine which cells had expressed sufficient comK at 1.5 hours after the onset of stationary phase to eventually transition to competence. (For comparison, the background signal due to auto-fluorescence in cells not encoding cfp is 12–16). One other feature of Figure S7 is noteworthy. Although the high cfp values tend to occur in cells with high yfp values, there is considerable scatter. At a given level of PcomK-cfp expression, many values for PcomG expression are possible, and vice versa. This may reflect the time of transition, so that cells that became competent earlier have more YFP. There may also be significant noise in the expression of PcomG.
sdp encodes a toxin, required for cannibalism, that is produced by cells that possess low to intermediate levels of OA∼P [34]. Psdp is activated by 0A∼P and in a population of cells provides a sensitive reporter of the average concentration of this molecule [35]. Figure 8A presents data from cells that co-express PcomK-cfp and Psdp-yfp. These data were collected 1.5 hours after the onset of stationary phase and may therefore be compared with the calibration results in Figure S7A. In Figure 8A, a green box encloses cells that exceed the threshold value of 36 for PcomK-cfp and these were found to comprise 12.6% of the total population. This value is close to the value of 13.3% determined in Figure S7A. Inspection of the scatter plot in Figure 8A suggests that above a YFP fluorescence level approximated by the vertical dashed line there are very few competent cells. In panel A there are a total of 11,238 cells represented, of which 1,419 have been classified as competent (within the green box). Of these cells, 48 are to the right of the dashed line, and these comprise 2.9% of all the cells to the right of this line. The equivalent percentage of competent cells with Psdp expression lower than this limit (to the left of the dashed line) is 14.4. These proportions differ with P<0.001, based on a two-tailed t-test. This decrease in the probability of transitions with high 0A∼P is predicted by the model for the 0A∼P dependence of PcomK expression presented above. In this experiment, two types of cells may possess a high level of YFP without transitioning to competence. Some may have experienced a rapid rise in the concentration of 0A∼P, which reached an inhibitory level before PcomK could be expressed. Others may have experienced a gradual increase in 0A∼P but simply by chance did not transition to high PcomK expression. The histogram in panel A shows the distribution of competent cell numbers, as a percent of the total number of cells within each “slice” of YFP fluorescence. This distribution confirms that competence transitions occur within an intermediate range of Psdp expression and therefore within an intermediate concentration range of 0A∼P. It also suggests that there is an optimal 0A∼P concentration that maximizes the probability of competence.
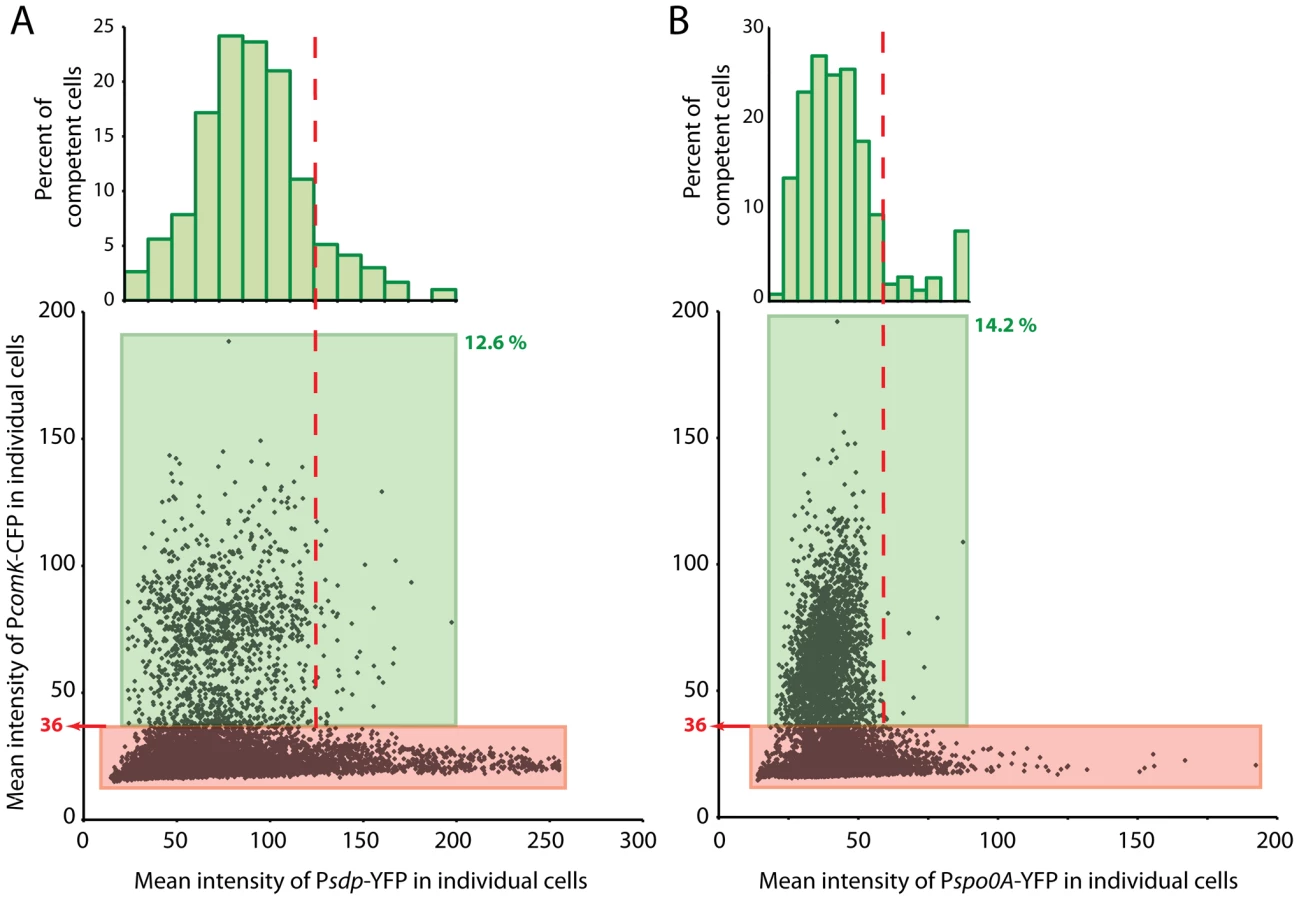
Based on the following argument, it was of interest to compare these results with an analogous experiment in which PcomK-cfp was co-expressed with Pspo0A-yfp (Figure 8B). A priori, it is not known whether Pspo0A-yfp expression would accurately reflect the level of 0A∼P in the cell because of two uncertainties. First, at a given time all the Spo0A may not be phosphorylated. Second, if the cell-to-cell variation in transcription of spo0A were dominated by intrinsic noise, there would be little correlation between the YFP fluorescence of a given cell derived from Pspo0A-yfp and the amount of Spo0A protein, encoded by the wild type spo0A gene [36]. Comparison of the two panels of Figure 8 shed some light on these uncertainties and therefore has implications for the kinetics of Spo0A phosphorylation and the nature of noise in the amount of this molecule. As in panel A, the data in panel B shows a paucity of competent cells above a level of YFP approximated by the vertical dashed line. A calculation comparable to the one described above confirms that this paucity is highly significant (P<0.001). This comparison strongly suggests that the variation from cell-to-cell in the rate of expression from Pspo0A-yfp is dominated by extrinsic noise, so that expression from the wild type and Pspo0A-yfp promoters in each cell is correlated. If there were a major contribution from intrinsic noise in the firing of Pspo0A, there would be little relationship between the expression from Pspo0A and from PcomK and the points in panel B would therefore extend over the entire range of Pspo0A-yfp values. We have observed that the pattern of luciferase expression from Pspo0A is quite similar to that of PsynthA (Figure S5), suggesting that a global change in the physiology of these transition state cells may be responsible for changes in the average amount of spo0A expression and perhaps also for extrinsic noise in expression from Pspo0A. A relative unimportance of intrinsic noise would be expected if Spo0A were abundant in these cells [37] and in fact it has been estimated that there are about 2000 molecules of this protein per cell during growth [38]. Further, the similarity in the patterns of PcomK-cfp expression in the two panels, including in the respective histograms, is consistent with the notion that the phosphorelay is finely tuned to rapidly phosphorylate newly synthesized Spo0A as it becomes available.
As a whole, these results support the conclusion that 0A∼P plays both positive and negative roles in determining the basal level of comK expression and hence the probability of transitions to competence. As noted above, the histograms shown in Figure 8A and 8B suggest that there is an optimum level of 0A∼P for competence. However, at each level of 0A∼P, most cells do not transition to competence and there must be another source of noise that determines whether a given cell becomes competent. We will return to this point below.
Stochastic simulations of the uptick model
To test the plausibility of OA∼P's dual role as a positive and negative regulator of the comK promoter, we simulated the network with Gillespie's stochastic simulation algorithm [39] with our primary output being expression from the comK promoter over time. Since our objective was to verify that Rok and Spo0A alone could define an uptick in comK expression, we only incorporated the binding sites for Spo0A and Rok described above. In addition, we developed a simple model to account for the global decline in transcription following entry into the stationary phase of the growth cycle (see Text S1 for details of the model, including all parameter values (Table S3) and the reactions (Table S4)).
With the appropriate parameters, we found that our model captured the temporal dynamics of the comK promoter and qualitatively captured the relative amplitudes of the various null-mutant strains (Figure 9A, analog to Figure 1C). By normalizing the amplitudes of the uptick in each strain, one can see the sharpened decay in the ΔcomK Δrok strain (Figure 9B, analog of Figure S5).

Our simulations suggest the possibility of an additional role of OA∼P as a classical activator that recruits RNA polymerase to the promoter. If OA∼P only activated comK expression as an antirepressor of Rok, then the promoter with OA∼P bound at sites A123 would have the same probability of recruiting polymerase as the bare promoter without any Rok. In our simulation output, however, we observed that the ΔcomK Δrok and the ΔcomK Δrok Δspo0A strains yielded identical expression of comK unless OA∼P enhanced the transcription rate when bound at sites A123. Given that null-mutant strains of other regulatory factors of competence showed no major change in the uptick amplitude when measured by the luciferase assay, our simulation favors the additional role of OA∼P as a direct activator of comK.
Using our simulations, we addressed the question of whether fluctuations in OA could transmit to fluctuations in the expression of comK, thus potentially determining which cells become competent and which do not. We incorporated two independent comK promoters with identical binding affinities and observed that the number of transcripts from the two promoters was largely uncorrelated (the correlation coefficient ranged from 0.06 to 0.22) at various time points in the simulation (Table S5). This supports the view that variability in Spo0A is not a major determinant in whether or not a cell becomes competent, but rather that comK noise is the major factor as suggested previously [8]. Instead, the concentration of 0A∼P serves only to determine the window by shaping the probability of whether or not cells will become competent, without explicitly dictating cell fate.
Discussion
The uptick mechanism
The probability that a cell will enter the competent state increases and then decreases as a culture departs from exponential growth. The present work identifies two temporally variable factors that determine this transient uptick (Figure 10). First, we have discovered a previously unsuspected increase in the basal firing rate of the PcomK promoter as cells approach stationary phase, which seems to be characteristic of core promoter elements in general, even one that depends on a minor sigma factor. This increase must be due to factors extrinsic to the “core” promoters themselves and may reflect the metabolic state of the cell, e.g. the content of nucleotide pools, the conformational state of the chromosome or the release of RNAPol from the transcription of stable RNA as growth slows [23]. In the cartoon representation of Figure 10, we have arbitrarily represented this extrinsic factor as an increase in available RNAPol. In any event, the extrinsic change may serve to couple competence regulation to cellular physiology, particularly to the growth rate, so that as growth slows, the probability of transitions to competence would increase. It is possible that a similar increase in the rate of spo0A transcription (Figure S6) also contributes to other forms of Spo0A-dependent stationary phase expression.

The second variable factor is 0A∼P, which binds to A1, 2 and 3, amplifying the increase in PcomK activity that is due to the core promoter activity, acting principally by antagonizing the repressing effect of Rok. During the rising portion of the uptick an increasing concentration of 0A∼P antagonizes Rok (and perhaps CodY as well) (Figure 10). In randomly selected cells, this causes the concentration of ComK to approach the threshold for transition to competence, raising the global probability that the promoter will fire. PcomK activity decreases more abruptly than that of the core promoter (Figure 2B), because as the concentration of 0A∼P rises, it begins to occupy R1 and R2. Rok contributes to this decrease because it acts as a repressor, helping OA∼P shut off transcription. It is likely that Rok does this by acting at a site in addition to A2, as represented in Figure 10, because the downturn in the A2 mutant strain is more abrupt than in the Δrok A2 double mutant (Figure 6B). Thus, 0A∼P allows transitions to occur, but also closes the window of opportunity. Rok modulates this process as a repressor by working against 0A∼P during the upward part of the uptick and by accelerating the down turn, but does not itself vary in amount (Figure S3). In this model, the behavior of the core promoter and the increase in the concentration of 0A∼P are the primary variable factors that determine the timing of the uptick profile.
Stochastic simulations of the model described here successfully reproduced the experimental behavior of the system, including the relative amplitudes and the temporal dynamics of comK basal transcription in the wild type and mutant strains. Furthermore the modeling assumption, based on experimental evidence, that OA∼P and Rok assist one another in effecting repression at PcomK, successfully reproduced the dynamics of repression in single and double rok spo0A mutants (Figure 1C, Figure 9, and Figure S5).
Although the model described above is plausible, we cannot be certain about the individual roles of A1, A2 and A3 and it is prudent to consider alternative possibilities. For example, because inactivation of A2 results in an increase in the amplitude of the uptick, it is conceivable that A2 is a repression site for OA∼P binding. As noted above, this is unlikely because inactivation of rok in the A2 mutant background has little effect (Figure 6A and 6B), suggesting strongly that Rok and OA∼P work on the same pathway. A similar conclusion can be drawn from comparison of single and double mutants in rok and spo0A (Figure 2). Although the inactivation of rok alone increases the amplitude of the uptick, further deletion of spo0A fails to reduce this amplitude to the level of the spo0A single mutant. This also suggests that Rok and OA∼P work on the same pathway. Another complex and unlikely possibility is that OA∼P recruits Rok for binding to A2, explaining why inactivation of either A2 or Rok have the same effect on the uptick. However, Figure 4D shows that Rok can bind to A2 with high affinity in the absence of OA∼P.
An emerging theme in Bacillus development
The regulation of the comK uptick now joins two other cases of timed regulation dependent on 0A∼P, in which this molecule acts positively and then negatively as its average concentration increases. Spo0A acts to cause a burst in the expression of sinI, a key regulator in the early development of biofilms, which is expressed bimodally [15], [31]. The regulation of sinI has been explained by differential affinity of 0A∼P for activating and repressing sites [31]. The second case concerns sdp, an operon needed for cannibalism, which encodes a toxic extracellular factor that kills non-producing cells with less 0A∼P, permitting the producing cells access to nutrients and thereby delaying their commitment to sporulation [34]. sdp transcription is activated and then repressed by 0A∼P [35]. However, this regulation differs from than of comK and sinI. sdp is repressed by AbrB and its induction is explained by the extreme sensitivity of the abrB promoter to repression by 0A∼P and also by the activation of abbA transcription. The AbbA protein binds to AbrB, further derepressing sdp [40]. High concentrations of 0A∼P, on the other hand, repress sdp transcription by direct binding. Thus, comK, sinI and sdp are all turned on by 0A∼P at low concentrations and turned off as the amount of 0A∼P increases, with this versatile protein acting by various combinations of activation, repression and anti-repression. comK is the only known target gene for which 0A∼P acts as an anti-repressor. Competence thus joins sporulation, cannibalism and biofilm formation as subject to temporal regulation by Spo0A∼P. As B. subtilis enters its developmental pathways, it uses the gradual accumulation of 0A∼P as a clock, to orchestrate the timing of gene expression.
The source of noise for competence transitions
Figure 8A shows that competence develops within an intermediate range of Psdp-yfp concentrations. The few cells with elevated CFP at the low end of the YFP distribution is consistent with the observation that the uptick is amplified by Spo0A∼P, although the number of cells in this region of the scatter plot is too low to establish the statistical significance of this observation. Nevertheless, it is known that spo0A mutant cells are not competent [24] and these cells are likely to be below the threshold for competence transitions. Cells at the high end of the YFP distribution likewise have a low probability of being competent because their transition windows have closed. This upper limit is due to repression exerted at R1 and R2, as shown here. Within the intermediate range of YFP concentrations, corresponding to an intermediate range of Spo0A∼P, conditions are permissive for transitions to occur. Clearly at each concentration of Spo0A∼P within this permissive range, indicated by expression of Psdp-yfp, a wide range of ComK-CFP concentrations can exist and most cells fail to become competent (Figure 8A). Likewise, at each level of PcomK-cfp expression above the threshold value for competence, a range of YFP values are possible. It follows from these results that cell-to-cell variation in the content of Spo0A∼P alone does not determine cell fate.
In agreement with this conclusion, our previous evidence suggested that the major source of noise for fate determination is the firing rate of PcomK [8]. The data in Figure 8 are consistent with that result, as is the uptick model that we advanced above. Thus, we suggest that the noise in transcription from PcomK determines cell fate and that 0A∼P amplifies PcomK expression, permitting about 10–20% of the cells to exceed the transition threshold for amplification of comK expression by auto-induction. 0A∼P then shuts down transcription when it reaches higher concentrations, driving the transition rate toward zero. Our earlier experiments suggested that the PcomK noise is intrinsic, because the numbers of transcripts derived from two comK promoters in the same cell were poorly correlated at the peak of the uptick [8], when there is about one comK transcript in the average cell [8] and therefore the average number of ComK protein molecules is likely to be low. Under these conditions we would expect intrinsic noise in comK expression to dominate cell-to-cell variation [37] and to be the major factor selecting cells for the competent fate. The simulation results described above support this conclusion, shown by the poor correlation observed when the outputs of independent comK promoters were compared (Table S5). Although noise in comK is the major determinant, 0A∼P acts as a temporal gate, modulating the probability that random fluctuations in comK transcription will lead to competence.
A more general role for OA∼P
It has been well established that a gradual increase in the concentration of OA∼P governs development in B. subtilis. Although competence was known to require spo0A, the role of OA∼P in this pathway was imperfectly understood. It now appears that the probability of transition to the competent state is determined by the programmed increase in OA∼P, as are the development of biofilms, cannibalism and spores. OA∼P thus plays a general role in the temporal control of development and competence must be subject to the complex signaling that governs the synthesis of this molecule, involving multiple kinases, phosphatases and extracellular peptides. Despite this commonality, competence differs from sporulation, cannibalism and biofilm formation in an important respect. Asynchrony during the gradual post-exponential increase in OA∼P concentration is most likely the major determinant of which cell is selected for these last three fates. In contrast, it is noise in comK, a dedicated gene, that governs the choice of cells for competence, although OA∼P helps to set the temporal window of opportunity.
Materials and Methods
Microbiological methods
Bacillus subtilis strains were constructed by transformation into BD630 (his leu met) with selection for the appropriate antibiotic resistance marker, and all comparisons were with isogenic strains. For transformation, competent cultures were prepared and incubated in competence medium with transforming DNA (∼1 µg/ml) for 30 min at 37°C [24]. The strains are listed in Table S1. All the growth experiments were carried out in competence medium [24].
Luciferase assay
For the detection of luciferase activity, strains were first grown in LB medium to an optical density at 600 nm (OD600) of 2. Cells were then centrifuged and resuspended in fresh competence medium, adjusting all the cultures to an OD600 of 2. These pre-cultures were then diluted 20 fold in fresh competence medium and 200 µl was distributed in each of two wells in a 96-well black plate (Corning). 10 µl of luciferin was added to each well to reach a final concentration of 1.5 mg/ml (4.7 mM). The cultures were incubated at 37°C with agitation in a PerkinElmer Envision 2104 Multilabel Reader equipped with an enhanced sensitivity photomultiplier for luminometry. The temperature of the clear plastic lid was maintained at 38°C to avoid condensation. Relative Luminescence Units (RLU) and OD600 were measured at 1.5 min intervals. The data were plotted as RLU/OD versus time from the beginning of growth.
Construction of luciferase promoter fusion strains
A 1 Kb fragment ending with the initiating codon of the gene of interest, and containing the promoter, was amplified by PCR from the B. subtilis chromosome. A single nucleotide was inserted in the primer to restore the correct reading frame. Primers are listed in Table S2 (PcomK1 and 2). The PCR fragment was cut by KpnI/NcoI in sites present at the extremities of the primers used for the amplification. In parallel, the luciferase gene was cut from plasmid pGL3 (Promega) by NcoI/BamH1 digestion. A three-fragment ligation was then carried out between the promoter of interest, the luciferase gene and plasmid pUC18Cm digested with KpnI and BamH1. The resulting plasmid, pCU18cm-promoter::luc, which cannot replicate autonomously in B. subtilis was used to transform B. subtilis with selection for chloramphenicol resistance, where it integrated by single crossover. This event reconstructed the “normal” regulatory region in front of the fusion and a complete copy of the gene of interest, downstream of the fusion.
When necessary, mutations were incorporated in the promoter in front of luc using the ‘Change-It Multiple Mutation Site Directed Mutagenesis’ kit (USB). The primers used in these site-directed mutagenesis constructions are listed in Table S2. The resulting plasmids were verified by sequencing and then integrated by Campbell-like recombination and the structure of the integration event was verified by sequencing a relevant PCR fragment from the chromosome.
Construction of YFP promoter fusion strains
A 1 Kb fragment ending with the initiating codon of the gene of interest, and containing the promoter, was amplified by PCR from the B. subtilis chromosome. Primers are listed in Table S2 (Pspo0A3, Pspo0A4, Psdp1 and Psdp2). The PCR fragment was cut by EcoRI/XhoI at sites present at the extremities of the primers used for the amplification. In parallel, the yfp gene was amplified using the primers yfp8 and yfp9 (see Table S2). A three-fragment ligation was then carried out between the promoter of interest, the yfp gene and plasmid pUC18Cm digested with EcoRI and BamH1. The resulting plasmid, pCU18cm-promoter::yfp, which cannot replicate autonomously in B. subtilis, was used to transform B. subtilis with selection for chloramphenicol resistance, where it integrated by single crossover. This event reconstructed the “normal” regulatory region in front of the fusion and a complete copy of the gene of interest, downstream of the fusion.
Construction of Sigma A and Sigma H core promoter fusion strains
The luc gene was amplified from the plasmid pGL3 (Promega) using the primers ‘sigAcore’ or ‘sigHcore’ and ‘luc2’ (see Table S2). The ‘sigAcore’ or ‘sigHcore’ primers allowed us to add the core promoters and the ribosomal binding site of spoVG upstream of the luc gene. The PCR products were cut using BamH1 and EcoRI and cloned in the plasmid pDR111 digested with the same enzymes. The resulting plasmids, pDR111-PsigAcore-luc or pDR111-PsigHcore-luc, were used to transform B. subtilis where they integrated by double crossover at the amyE locus.
Construction of a comK deletion
To inactivate comK, we replaced it cleanly with a tetracycline resistance cassette without using a vector. We first amplified 1 kb fragments upstream and downstream of the gene. These fragments are each flanked with one restriction site at the junction with respectively the ‘start’ or the ‘stop’ of the gene. In parallel, we amplified the tet cassette flanked with the same two restriction sites. The three fragments were then digested and ligated together and the ligated DNA was purified through a QIAquick column. The desired product, corresponding to ligation of the three fragments, was purified from an agarose gel. The purified band was then amplified by PCR using the outside primers previously used to amplify the upstream and downstream fragments. After further purification on a QIAquick column, the full fragment (flanking sequences+antibiotic cassette) was used to transform B. subtilis with selection for tet-resistance yielding a double crossover event between the chromosome and the region of homology and replacing the gene with the antibiotic cassette.
Purification and phosphorylation of 0A∼P and purification of Rok
Spo0A was purified following a published protocol [41] as modified [42]. Non-radioactive phosphoramidate was synthesized [43] and used to phosphorylate the Spo0A. On a Superdex 200 column the resulting Spo0A appeared to be predominantly in the dimer form. Rok was purified as a C-terminal His6 fusion as previously described [26].
Gel mobility shift assays
The primers used to amplify the probe DNA fragments by PCR (OAwt, OA123, ORwt and OR1&2) are listed in Table S2. The 5′ ends of these probe fragments were labeled using [g-32P]-ATP and T4 polynucleotide kinase. For this, about 500 ng of DNA was incubated in 50 µl final volume, with 10 units of enzyme and with 40 µCi of [g-32P]-ATP (specific activity of 4500 Ci/mmol). For the gel shift experiments, a typical assay mixture contained (in a final volume of 20 µl), 10 mM Tris-HCl, pH 8.0, 50 mM NaCl, 1 mM EDTA, 1 mM dithiothreitol (DTT), 5% (v/v) glycerol, 0.5 µg of bovine serum albumin, approximately 0.5 ng of probe and the indicated concentrations of 0A∼P protein. After 5 min of incubation at 37°C, 10 µl of this mixture was loaded onto a native 5% (w/v) polyacrylamide TBE Ready Gel (Bio-Rad) and electrophoresed in 0.5× TBE buffer for 1 h at 100 V cm−1. The gels were pre-run for about an hour. Radioactive fragments were detected by autoradiography. Gel shifts with Rok were performed as described previously [26].
Microscopy
From B. subtilis cultures growing in the plate reader in competence medium, samples were taken at 1.5 or 4 hours after the entrance to stationary phase. Aliquots (200 µl) of each sample were centrifuged and resuspended in 100 µl of PBS. One µl of each sample was placed on a 1% agarose pad. All images were acquired using Volocity v 5.1 (Perkin Elmer) and a Nikon 90i fluorescence microscope with filters appropriate for detection of CFP and YFP. Segmentation and measurements of pixel intensities were carried out with the Volocity measurement tools.
Supporting Information
Zdroje
1. LosickRDesplanC 2008 Stochasticity and cell fate. Science 320 65 68
2. RajAvan OudenaardenA 2008 Nature, nurture, or chance: stochastic gene expression and its consequences. Cell 135 216 226
3. BalazsiGvan OudenaardenACollinsJJ 2011 Cellular decision making and biological noise: from microbes to mammals. Cell 144 910 925
4. CozyLMKearnsDB 2010 Gene position in a long operon governs motility development in Bacillus subtilis. Mol Microbiol 76 273 285
5. SuelGMGarcia-OjalvoJLibermanLMElowitzMB 2006 An excitable gene regulatory circuit induces transient cellular differentiation. Nature 440 545 550
6. SuelGMKulkarniRPDworkinJGarcia-OjalvoJElowitzMB 2007 Tunability and noise dependence in differentiation dynamics. Science 315 1716 1719
7. CagatayTTurcotteMElowitzMBGarcia-OjalvoJSuelGM 2009 Architecture-dependent noise discriminates functionally analogous differentiation circuits. Cell 139 512 522
8. MaamarHRajADubnauD 2007 Noise in gene expression determines cell fate in Bacillus subtilis. Science 317 526 529
9. VeeningJWSmitsWKHamoenLWKuipersOP 2006 Single cell analysis of gene expression patterns of competence development and initiation of sporulation in Bacillus subtilis grown on chemically defined media. J Appl Microbiol 101 531 541
10. VeeningJWIgoshinOAEijlanderRTNijlandRHamoenLW 2008 Transient heterogeneity in extracellular protease production by Bacillus subtilis. Mol Syst Biol 4 184
11. LeisnerMStinglKRadlerJOMaierB 2007 Basal expression rate of comK sets a ‘switching-window’ into the K-state of Bacillus subtilis. Mol Microbiol 63 1806 1816
12. ErringtonJ 2003 Regulation of endospore formation in Bacillus subtilis. Nat Rev Microbiol 1 117 126
13. DubnauDLovettCMJr 2002 Transformation and Recombination. HochJALosickRSonensheinAL Bacillus subtilis and Its Relatives: From Genes to Cells Washington, DC American Society for Microbiology 453 471
14. LopezDVlamakisHKolterR 2010 Biofilms. Cold Spring Harb Perspect Biol 2 a000398
15. ChaiYChuFKolterRLosickR 2008 Bistability and biofilm formation in Bacillus subtilis. Mol Microbiol 67 254 263
16. Haseltine-CahnFFoxMS 1968 Fractionation of transformable bacteria from competent cultures of Bacillus subtilis on renografin gradients. J Bacteriol 95 867 875
17. HaddenCNesterEW 1968 Purification of competent cells in the Bacillus subtilis transformation system. J Bacteriol 95 876 885
18. van SinderenDVenemaG 1994 comK acts as an autoregulatory control switch in the signal transduction route to competence in Bacillus subtilis. J Bacteriol 176 5762 5770
19. SmitsWKEschevinsCCSusannaKABronSKuipersOP 2005 Stripping Bacillus: ComK auto-stimulation is responsible for the bistable response in competence development. Mol Microbiol 56 604 614
20. MaamarHDubnauD 2005 Bistability in the Bacillus subtilis K-state (competence) system requires a positive feedback loop. Mol Microbiol 56 615 624
21. LeisnerMStinglKFreyEMaierB 2008 Stochastic switching to competence. Curr Opin Microbiol 11 553 559
22. LeisnerMKuhrJ-TRadlerJOFreyEMaierB 2009 Kinetics of genetic switching into the state of bacterial competence. Biophys J 96 1178 1188
23. MirouzeNPrepiakPDubnauD 2011 Fluctuations in spo0A transcription control rare developmental transitions in Bacillus subtilis. PLoS Genet 7 e1002048
24. AlbanoMHahnJDubnauD 1987 Expression of competence genes in Bacillus subtilis. J Bacteriol 169 3110 3117
25. BurbulysDTrachKAHochJA 1991 Initiation of sporulation in B. subtilis is controlled by a multicomponent phosphorelay. Cell 64 545 552
26. HoaTTTortosaPAlbanoMDubnauD 2002 Rok (YkuW) regulates genetic competence in Bacillus subtilis by directly repressing comK. Mol Microbiol 43 15 26
27. HamoenLWVan WerkhovenAFBijlsmaJJEDubnauDVenemaG 1998 The competence transcription factor of Bacillus subtilis recognizes short A/T-rich sequences arranged in a unique, flexible pattern along the DNA helix. Genes Dev 12 1539 1550
28. SmitsWKHoaTTHamoenLWKuipersOPDubnauD 2007 Antirepression as a second mechanism of transcriptional activation by a minor groove binding protein. Mol Microbiol 64 368 381
29. SmitsWKGrossmanAD 2010 The transcriptional regulator Rok binds A+T-rich DNA and is involved in repression of a mobile genetic element in Bacillus subtilis. PLoS Genet 6 e1001207
30. MolleVFujitaMJensenSTEichenbergerPGonzalez-PastorJE 2003 The Spo0A regulon of Bacillus subtilis. Mol Microbiol 50 1683 1701
31. ChaiYNormanTKolterRLosickR 2011 Evidence that metabolism and chromosome copy number control mutually exclusive cell fates in Bacillus subtilis. Embo J 30 1402 1413
32. SerrorPSonensheinAL 1996 CodY is required for nutritional repression of Bacillus subtilis genetic competence. J Bacteriol 178 5910 5915
33. HaijemaBJHahnJHaynesJDubnauD 2001 A ComGA-dependent checkpoint limits growth during the escape from competence. Mol Microbiol 40 52 64
34. Gonzalez-PastorJEHobbsECLosickR 2003 Cannibalism by sporulating bacteria. Science 301 510 513
35. FujitaMGonzalez-PastorJELosickR 2005 High - and low-threshold genes in the Spo0A regulon of Bacillus subtilis. J Bacteriol 187 1357 1368
36. ElowitzMBLevineAJSiggiaEDSwainPS 2002 Stochastic gene expression in a single cell. Science 297 1183 1186
37. TaniguchiYChoiPJLiGWChenHBabuM 2010 Quantifying E. coli proteome and transcriptome with single-molecule sensitivity in single cells. Science 329 533 538
38. ChastanetAVitkupDYuanGCNormanTMLiuJS 2010 Broadly heterogeneous activation of the master regulator for sporulation in Bacillus subtilis. Proc Natl Acad Sci U S A 107 8486 8491
39. GillespieD 1977 Exact stochastic simulation of coupled chemical reactions. J Phys Chem 81 2340 2361
40. BanseAVChastanetARahn-LeeLHobbsECLosickR 2008 Parallel pathways of repression and antirepression governing the transition to stationary phase in Bacillus subtilis. Proc Natl Acad Sci U S A 105 15547 15552
41. MuchovaKLewisRJPereckoDBranniganJALaddsJC 2004 Dimer-induced signal propagation in Spo0A. Mol Microbiol 53 829 842
42. PrepiakPDefrancescoMSpadavecchiaSMirouzeNAlbanoM 2011 MecA dampens transitions to spore, biofilm exopolysaccharide and competence expression by two different mechanisms. Mol Microbiol 80 1014 1030
43. BucklerDRStockAM 2000 Synthesis of [(32)P]phosphoramidate for use as a low molecular weight phosphodonor reagent. Anal Biochem 283 222 227
Štítky
Genetika Reprodukční medicínaČlánek vyšel v časopise
PLOS Genetics
2012 Číslo 3
Nejčtenější v tomto čísle
- PIF4–Mediated Activation of Expression Integrates Temperature into the Auxin Pathway in Regulating Hypocotyl Growth
- Metabolic Profiling of a Mapping Population Exposes New Insights in the Regulation of Seed Metabolism and Seed, Fruit, and Plant Relations
- A Splice Site Variant in the Bovine Gene Compromises Growth and Regulation of the Inflammatory Response
- Comprehensive Research Synopsis and Systematic Meta-Analyses in Parkinson's Disease Genetics: The PDGene Database