
Cell Size and the Initiation of DNA Replication in Bacteria
In eukaryotes, DNA replication is coupled to the cell cycle through the actions of cyclin-dependent kinases and associated factors. In bacteria, the prevailing view, based primarily from work in Escherichia coli, is that growth-dependent accumulation of the highly conserved initiator, DnaA, triggers initiation. However, the timing of initiation is unchanged in Bacillus subtilis mutants that are ∼30% smaller than wild-type cells, indicating that achievement of a particular cell size is not obligatory for initiation. Prompted by this finding, we re-examined the link between cell size and initiation in both E. coli and B. subtilis. Although changes in DNA replication have been shown to alter both E. coli and B. subtilis cell size, the converse (the effect of cell size on DNA replication) has not been explored. Here, we report that the mechanisms responsible for coordinating DNA replication with cell size vary between these two model organisms. In contrast to B. subtilis, small E. coli mutants delayed replication initiation until they achieved the size at which wild-type cells initiate. Modest increases in DnaA alleviated the delay, supporting the view that growth-dependent accumulation of DnaA is the trigger for replication initiation in E. coli. Significantly, although small E. coli and B. subtilis cells both maintained wild-type concentration of DnaA, only the E. coli mutants failed to initiate on time. Thus, rather than the concentration, the total amount of DnaA appears to be more important for initiation timing in E. coli. The difference in behavior of the two bacteria appears to lie in the mechanisms that control the activity of DnaA.
Published in the journal:
. PLoS Genet 8(3): e32767. doi:10.1371/journal.pgen.1002549
Category:
Research Article
doi:
https://doi.org/10.1371/journal.pgen.1002549
Summary
In eukaryotes, DNA replication is coupled to the cell cycle through the actions of cyclin-dependent kinases and associated factors. In bacteria, the prevailing view, based primarily from work in Escherichia coli, is that growth-dependent accumulation of the highly conserved initiator, DnaA, triggers initiation. However, the timing of initiation is unchanged in Bacillus subtilis mutants that are ∼30% smaller than wild-type cells, indicating that achievement of a particular cell size is not obligatory for initiation. Prompted by this finding, we re-examined the link between cell size and initiation in both E. coli and B. subtilis. Although changes in DNA replication have been shown to alter both E. coli and B. subtilis cell size, the converse (the effect of cell size on DNA replication) has not been explored. Here, we report that the mechanisms responsible for coordinating DNA replication with cell size vary between these two model organisms. In contrast to B. subtilis, small E. coli mutants delayed replication initiation until they achieved the size at which wild-type cells initiate. Modest increases in DnaA alleviated the delay, supporting the view that growth-dependent accumulation of DnaA is the trigger for replication initiation in E. coli. Significantly, although small E. coli and B. subtilis cells both maintained wild-type concentration of DnaA, only the E. coli mutants failed to initiate on time. Thus, rather than the concentration, the total amount of DnaA appears to be more important for initiation timing in E. coli. The difference in behavior of the two bacteria appears to lie in the mechanisms that control the activity of DnaA.
Introduction
Chromosome replication is precisely coordinated with cell growth and division to ensure faithful maintenance of the genetic material. In eukaryotes, a host of cell cycle regulators and checkpoints function in concert to ensure that replication is coupled to growth and division [1]. In bacteria, the prevailing view is that the initiation of DNA replication is linked to the growth-dependent accumulation of the ATP-bound form of the highly conserved protein DnaA. In other words, DnaA-ATP accumulates to an amount sufficient for initiation only by the time cells reach a particular size (mass) [2], [3].
The concept of growth-dependent, rather than cell cycle-dependent, control of DNA replication in bacteria has its origin in the seminal physiological studies in Salmonella typhimurium by Schaechter, Maaløe, and Kjelgaard, and in Escherichia coli by Cooper and Helmstetter. Combining cell size data from S. typhimurium [4] with data on the timing of replication initiation in E. coli [5], Donachie deduced that the ratio of cell mass to replication origin at initiation (called initiation mass) was constant in cells undergoing one to three mass doublings per hour [2]. Although the faster growing cells were bigger and had more DNA, they maintained the same origin-to-mass ratio as slower growing cells. Based on this finding, Donachie suggested that growth-dependent accumulation of a positive-acting factor triggers initiation when it reaches a critical intracellular level [2].
Subsequent work identified the highly conserved AAA+ ATPase, DnaA, as the factor stimulating initiation [6], [7]. DnaA-ATP mediates the unwinding of an AT-rich stretch of DNA within the origin, facilitating loading of the replication machinery [8], [9]. In E. coli, three forms of negative regulation—sequestration, the regulatory inactivation of DnaA (RIDA), and titration—act in concert to control accumulation of DnaA-ATP and limit initiation to once per division cycle [3]. Sequestration takes place immediately following initiation and is mediated by SeqA binding to hemi-methylated GATC sites in oriC and in the dnaA promoter. Sequestration prevents DnaA from accessing oriC and blocks dnaA transcription until the sequestered regions are fully methylated [10]. RIDA, which also plays an important role in regulating DnaA activity, functions during elongation and is mediated by interactions between DnaA, the sliding clamp of DNA Polymerase III, and Hda, which accelerates hydrolysis of DnaA-bound ATP [11], [12]. Finally, titration of DnaA by its binding sites distributed throughout the chromosome keeps free DnaA levels low. One locus, datA, has an unusually high affinity for DnaA and is thus thought to play a major role in titration [13].
Through the combined effects of sequestration, RIDA, and titration, the ratio of DnaA-ATP to DnaA-ADP fluctuates over the course of the E. coli cell cycle, peaking just before initiation and falling rapidly thereafter, although total DnaA concentration remains more or less constant [3]. Maintenance of initiation mass in E. coli is thus explained by growth-dependent changes in the ratio of active/inactive DnaA rather than growth-dependent increases in total DnaA. Consistent with this idea, overreplication and a decrease in cell size at initiation are seen in DnaA or Hda mutants defective in DnaA-ATP hydrolysis [11], [14]–[16].
Although DnaA had been implicated as the primary regulator of DNA replication in other organisms, support for a cell mass-dependent initiation control mechanism outside of E. coli is limited to Bacillus subtilis [17]–[19]. Like E. coli, exponentially growing B. subtilis maintains a constant origin to cell mass ratio over a range of growth rates [20], and increasing the levels of both DnaA and DnaN, the sliding clamp of DNA Polymerase III, leads to premature initiation and altered cell size [21], [22]. In contrast to E. coli, increases in expression of DnaA in the absence of DnaN in B. subtilis engenders a host of pleiotropic and deleterious effects including misregulation of dnaA and dnaN expression and induction of the SOS response [21], [22].
Despite these similarities, the molecular mechanisms governing initiation seem to differ between B. subtilis and E. coli. B. subtilis lacks a seqA homolog, and its DnaA is synthesized in a burst following replication initiation [23]. B. subtilis also lacks hda. YabA, the putative functional homolog of HdaA, does not appear to alter DnaA-mediated ATP hydrolysis or the accumulation of DnaA [24], [25]. Instead, YabA appears to help prevent premature initiation through two related mechanisms: 1) tethering DnaA to the sliding clamp during elongation [26]–[29] and 2) limiting the amount of DnaA bound at oriC by preventing cooperative binding [30]. The release of DnaN from the replisome, or overproduction of DnaN, inhibits the interaction between YabA and DnaA, permitting increased association of DnaA with oriC thereby triggering initiation. In both cases, association of DnaN with the replication fork is critical for preventing premature initiation, providing at least a partial explanation as to why overexpression of DnaA, in the absence of a concomitant increase in DnaN, is deleterious to B. subtilis [21], [22]. Another B. subtilis protein, Soj, which does not have a functional homolog in E. coli, has also been implicated in the control of replication initiation [31]. Soj directly interacts with DnaA yet how it regulates the initiator activity remains unknown [32]. Finally, B. subtilis lacks a high-affinity site analogous to E. coli datA, although binding sites for DnaA exist throughout the chromosome [33]. Together, these data suggest that DnaA availability and access to oriC are controlled differently in B. subtilis.
Data from B. subtilis mutants that are smaller in size but wild type for growth also suggest that growth-dependent accumulation of DnaA-ATP is not the trigger for initiation in this organism. If this were the case, initiation should be delayed in small-size cells until sufficient DnaA-ATP is available. However, the timing of initiation relative to the generation time is unaffected in diminutive mutants [34].
The discovery that initiation can take place at a reduced cell size in B. subtilis, counter to significant circumstantial evidence linking initiation to achievement of specific size in E. coli, prompted us to re-examine the link between cell size and initiation in both E. coli and B. subtilis. Although there is significant data supporting the idea that changes in DNA replication alter cell size in both E. coli and B. subtilis, the converse, the effect of cell size on DNA replication, has not been explored in any depth. Here, we took advantage of cell size-defective mutants to 1) determine if reductions in cell size impact the timing of initiation in E. coli and 2) evaluate the role of DnaA in coordinating replication initiation with cell size. We report that although total DnaA per cell is reduced approximately 30% in both E. coli and B. subtilis cell size mutants in proportion to the size reduction, initiation is delayed only in the E. coli mutants. Thus, the total amount of DnaA must accumulate to a critical level in E. coli to generate sufficient active DnaA to trigger initiation and coordinate replication with the cell cycle. In contrast, since the B. subtilis mutant initiated with only 70% of wild type DnaA, it appears that the timing of replication is governed by cell-cycle dependent changes in the availability of DnaA for initiation, rather than the absolute amount of DnaA.
Results
Mutants with altered cell size
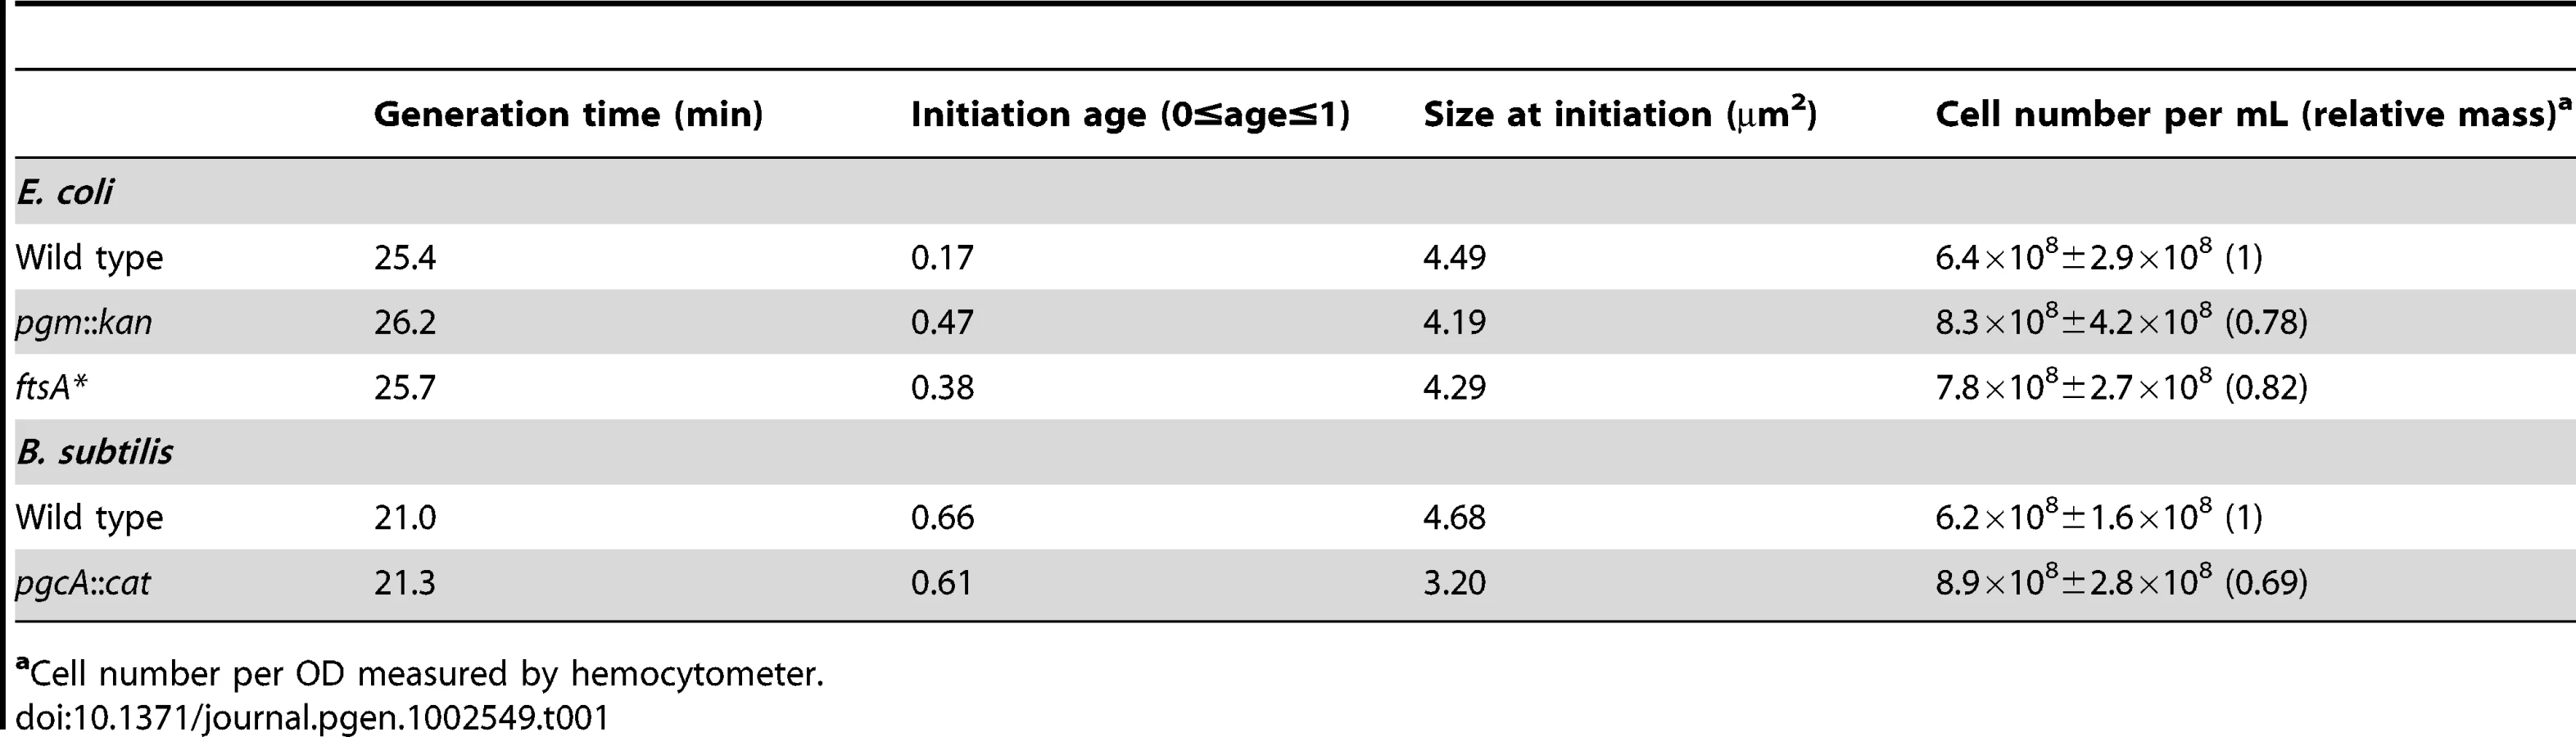
To clarify the role of cell mass in coordinating initiation with cell growth and division we employed cell-size mutants, two of E. coli and one of B. subtilis. E. coli mutants included one with a loss-of-function mutation in the gene encoding phosphoglucomutase, pgm::kan, and another with a gain-of-function mutation in the cell division gene ftsA, ftsA* (the gift of Bill Margolin). We selected the pgm::kan and ftsA* alleles on the basis of reports indicating that cell size is reduced by ∼25% [35],[36] (see Table S1 for a description of strains). For B. subtilis, we employed a loss-of-function mutation in pgcA (pgcA::Tn10), the homolog of E. coli pgm, which we initially characterized as part of a study on the growth rate regulation of cell size [34]. Importantly, although the mechanism by which pgm modulates cell size has yet to be determined, both ftsA* and pgcA impact division through direct effects on the division machinery in E. coli and B. subtilis, respectively [34], [37].
The size defect of the E. coli mutants was most pronounced when cells were cultured in nutrient rich medium (Luria Broth (LB)+0.2% glucose, referred to as LB-glucose). In this medium, pgm::kan cells were 26±2.7% smaller than wild type and the ftsA* mutants 22±1.3% smaller (Figure 1A; Figure S1A). Consistent with a reduction in cell size, there were ∼20% more mutant cells than the parental strain, when normalized for optical density and assayed by hemocytometer counts (Table 1). In a less rich medium (AB minimal medium+0.2% glucose, referred to as AB), the size reduction was less pronounced but nevertheless significant. In this medium, pgm::kan and ftsA* mutant cells were 12±2.6% and 17±0.9% smaller than wild type, respectively (Figure 1B; Figure S1B). Growth in a third medium (LB alone) resulted in an intermediate phenotype (data not shown). Both the pgm::kan and ftsA* strains exhibited mass doubling rates indistinguishable from the MG1655 parent strain in all three media (Figure S1C, S1D), indicating that mutants are normal for growth. In confirmation of our previous work [34], the B. subtilis pgcA::Tn10 cells were 35±3.3% smaller than wild type cells during growth in LB and 21±1.3% smaller than wild type during growth in a minimal defined medium (S750+1% glucose).

Reduction in cell size leads to a delay in the onset of DNA replication in E. coli but not B. subtilis
To determine the timing of DNA replication initiation in E. coli and B. subtilis mutants, we examined DNA content of cells by flow cytometry after inhibiting replication initiation and cell division with antibiotics. In this method, already initiated replication forks continue and complete replication (replication run-out), yielding fully replicated chromosomes. At the end of the experiment, cells that have initiated replication contain twice as much DNA than cells that have not. In this method, a delay in replication initiation should increase the proportion of uninitiated cells.
In E. coli, both pgm::kan and ftsA* mutant cells exhibited a distinct delay in replication initiation in all examined conditions (Figure 2A). After replication run-out in LB, both wild type and mutant cells showed two major peaks (Figure 2A, middle). The peak on the left (black arrow) corresponds to those cells that have not initiated replication whereas the peak on the right (red arrow) corresponds to the cells that have. Significantly, the peak representing cells that have not initiated DNA replication was larger in both the pgm::kan and ftsA* mutant populations relative to the same peak in a wild type population in all three media examined. Calculations of initiation age (see Materials and Methods) indicate that in LB, the pgm::kan and ftsA* mutants delayed initiation by ∼7.9 minutes and ∼5.5 minutes, respectively, relative to wild type cells (when generation time was ∼25 minutes).

Replication run-out of wild-type, pgm::kan and ftsA* cells cultured at slightly faster (using LB-glucose) or slower (using AB) growth rates also revealed a delay in initiation in the mutant strains (Figure 2A). In LB-glucose, where the size disparity between the wild type and the mutants is maximal, replication run-out revealed three peaks representing cells with 4, 8, or 16 chromosomal equivalents (Figure 2A, left). Roughly two-thirds of wild-type E. coli cultured under these conditions had 8 chromosomes with the remaining one-third containing 16 chromosomes (mean chromosome number, , was 10, from three repeat experiments). By contrast, the mutant cells primarily contained 8 chromosomes (pgm::kan, = 8.2 and ftsA*, = 8.5). Even in AB, where the size disparity is minimal, there was still strong evidence for an initiation delay in the mutant cells. Under these conditions replication run-out yielded three peaks, representing 2, 4, and 8 chromosome equivalents (Figure 2A, right). Relative to wild-type cells, the peak representing 8 chromosomal equivalents (red arrow) was lower and the peak representing 2 chromosomal equivalents (black arrow) was higher in the mutants, again consistent with a delay in replication initiation [(pgm::kan, = 4.0 and ftsA*, = 3.8) compared to wild type ( = 4.6)]. The initiation age could not be calculated in these two media because the available algorithms do not apply when the distribution profile has more than two peaks.
Flow cytometry of cells sampled at early-exponential phase but not treated with drugs indicated that the average DNA content of pgm::kan and ftsA* mutant cells cultured in LB was 72±9% and 81±4% of wild type values, respectively (Figure 2B, left). The corresponding values in AB were 87±4% and 82±6%, respectively (Figure 2B, right). These results are consistent with an initiation delay in the mutants.
Calculation of cell size at initiation in LB showed that it is more or less equivalent for all three E. coli strains (Table 1). These results indicate that E. coli needs to achieve an appropriate size for the initiation of DNA replication. In contrast to E. coli and in confirmation of our previous observation [34], B. subtilis wild-type and pgcA::Tn10 cells were indistinguishable with regard to the timing of initiation, regardless of growth rate (Figure 2C). Calculations of cell size indicate that the size difference between pgcA::Tn10 cells and wild-type B. subtilis at initiation was the same as at any other point in the division cycle (Table 1). These data support the hypothesis that the cell cycle rather than the cell size governs the initiation of DNA replication in B. subtilis.
DNA replication rates are increased in E. coli mutants
Changes in the timing of replication initiation caused by defects in DnaA or SeqA are known to alter C period, the time it takes to complete a round of replication elongation [38], [39]. In particular, earlier initiation leads to an increase in C period, whereas an initiation delay leads to a reduction in C period.
In contrast to SeqA and DnaA, none of the mutations in this study have been directly implicated in the control of DNA replication. However, given the impact of both pgm::kan and ftsA* on the timing of initiation, we decided to determine the length of C period, as well as D period, the time between the end of replication and cell division, in the small size mutant strains.
We employed marker frequency analysis to determine the length of C and D periods in wild type and mutant cells [40]. C period was derived from quantitative PCR data of the oriC-to-ter ratio (see Materials and Methods) of early log-phase cells using the following equation:where τ is mass doubling time.
D period was derived from the following equation using C period from the above equation and origins per cell values as determined by flow cytometry:
Our calculations indicate that whereas wild-type cells had a ∼40 minute C period in LB-glucose, consistent with previous reports [41], C period was only ∼30 minutes in pgm::kan and ftsA* mutant cells (Figure 3A). In AB medium, the C period of wild type cells was 42.9 minutes, pgm::kan 37.6 minutes, and ftsA* 35.5 minutes. The D period remained essentially constant at both growth rates in all cases (Figure 3B).

In contrast to E. coli, marker frequency analysis indicated C and D periods are unaltered in the B. subtilis pgcA mutant compared to the wild-type cells, both in LB and minimal S750 media, where mass doubling times are ∼22 minutes and ∼37 minutes, respectively. In LB, the C period was ∼50 minutes and D period was ∼17 minutes for both wild-type and pgcA mutants (Figure 3C, 3D). In S750 medium, the corresponding values were ∼52 minutes and ∼21 minutes, respectively. Notably, the unchanged cell cycle durations buttress the finding of normal initiation timing for the diminutive B. subtilis mutant.
Origin and replication fork numbers are reduced in E. coli mutants but not in the B. subtilis mutant
If replication is indeed delayed, as our marker frequency analyses indicate, pgm::kan and ftsA* cells should have fewer origins and replication forks than congenic wild-type cells. This effect should be particularly noticeable in younger (smaller) cells that have yet to achieve the appropriate initiation mass.
To examine the origin and replication fork frequency in wild type and mutant E. coli cells, we employed strains with either a lacO array placed near the origin with a cognate LacI-GFP source [42] or a YPet fusion to single-stranded DNA binding protein (Ssb) [43]. Ssb binds to single-stranded DNA just ahead of polymerase to prevent reannealing prior to their replication, and thus can be used as a marker of active replication forks.
In agreement with our C period data, there were fewer replication forks and origin foci in the E. coli mutants relative to wild-type cells (Figure 3E; Figure S2A). In rich medium, wild-type E. coli had an average of 4.4 Ssb-YPet foci, yet both mutants exhibited on average only 3.5 Ssb-YPet foci per cell. Moreover, while the frequency of cells with six or more Ssb-YPet foci was ∼40% in the wild type population, it was only ∼15% in pgm::kan and ftsA* mutants. These results suggest a reduction in the number of replication forks in the mutant backgrounds. Similarly, ∼30% of wild type E. coli cells had 5 or more origin foci, indicating they had reinitiated replication, but only ∼10% of pgm::kan cells and ∼3% of ftsA* cells fell into this category. Note that this method underestimates actual origin number relative to replication run-out due to issues associated with chromosome cohesion [44] as well as the limited resolution of conventional light microscopy.
In contrast to E. coli, the small B. subtilis mutant was wild type both with regard to the number of replication forks and origin foci, consistent with a normal initiation age and normal C period (Figure 3F; Figure S2B). Examining the frequency of foci of GFP-fusion to the replication protein Tau [45], a marker of active replication, we found that ∼30% of both wild-type and pgcA mutant B. subtilis cells had 2 or less foci, ∼60% have 3 to 4 foci, and ∼10% have 5 or more. Similarly, a lacO array at the origin in combination with a cognate LacI-GFP source [46], indicated that both wild type and mutant B. subtilis cells have an average of ∼3.2 origins per cell.
Z period is unaffected by reductions in cell size
To validate our calculations of the cell cycle, we determined the frequency of FtsZ rings in populations of wild-type and mutant E. coli strains (see Text S1 for Materials and Methods). FtsZ ring frequency is directly related to Z period, the length of time the cytokinetic ring is present during the division cycle, and the Z period is proportional to D period [47].
Data from strains encoding an inducible FtsZ-GFP fusion indicate that the timing of FtsZ assembly is wild type in E. coli pgm::kan and ftsA* mutant cells, regardless of growth rate (Figure S2C). Approximately 80% of cells from all three strains (wild type, pgm::kan, and ftsA*) had FtsZ rings during early-exponential phase in LB-glucose and 70% had FtsZ rings during mid-exponential phase in AB. These results support our finding that D period is normal in the mutant strains. We determined earlier that Z period was wild type in the B. subtilis pgcA mutant in agreement with the D period data for this mutant [34].
Synthesis of DnaA is normal in mutant E. coli and B. subtilis cells
A simple explanation for the altered initiation patterns of the E. coli and B. subtilis mutants would be changes in the levels of the initiator protein DnaA. A reduction of DnaA levels in the E. coli pgm::kan and ftsA* mutants would be consistent with a delay in DNA replication initiation. Conversely, increased levels of DnaA in the B. subtilis pgcA mutant would permit them to initiate DNA replication at the same time as their wild-type counterparts, albeit at a reduced size.
To address this issue we used quantitative immunoblotting to measure DnaA levels. Gel loading was normalized either to culture optical density to determine the relative concentration of DnaA, or to cell number to determine the relative levels of DnaA per cell. We find that while the concentration of DnaA is wild type in both E. coli and B. subtilis mutants (Figure 4A, 4B), the calculated DnaA per cell is 30% less, presumably due to their reduced size (Figure 4C, 4D).

These data support the idea that reduced levels of DnaA are the cause of the initiation delay we observed in the E. coli pgm::kan and ftsA* mutants. On the other hand, the B. subtilis pgcA mutant initiated replication on time, despite a reduction in DnaA per replication origin equivalent to the small E. coli mutants. This result was somewhat surprising in light of data indicating that artificially altering DnaA levels effects both the timing of initiation and cell size in B. subtilis [21], [22]. However, this finding strongly suggests that under normal growth conditions it is the availability of active DnaA rather than its absolute amount that is limiting for initiation in B. subtilis.
Increasing DnaA levels by a modest amount restores normal replication timing in E. coli
If reduction in DnaA were the principal cause of replication delay in the small E. coli mutants, a modest oversupply of DnaA should restore normal replication timing in the mutants. DnaA was supplied from a low-copy plasmid, pDS596, encoding an inducible allele of dnaA [48]. The chromosome number of pgm::kan and ftsA* cells (red line) increased from an average of ∼5.6 to ∼7 and their initiation age reduced from ∼0.5 to ∼0.2, values congruent to congenic wild-type cells (solid black) (Figure 4E). Similarly, estimates of DnaA molecules per oriC between wild-type cells and the mutants overproducing DnaA were nearly equivalent, further supporting the idea that the initiation delay in the mutant cells was due to reduction in DnaA level (Table 2). C and D periods were wild type in mutant cells overproducing DnaA (Table 2), suggesting the increase in elongation rates observed earlier in the mutant strains was a direct consequence of the initiation delay.

The DnaA to oriC ratio remains constant with increases in cell size
In light of our observation that the small E. coli mutants delayed replication due to a reduction in DnaA levels, we were interested to know whether the converse is true: whether DNA replication would initiate earlier in larger E. coli cells because they would reach the required initiation size earlier in the cell cycle. Also, how would an increase in cell size impact initiation in B. subtilis? To address these questions, we increased cell size by taking advantage of inducible-repressible promoter constructs that permit depletion of the essential cell division protein FtsZ [36], [49]. By titrating levels of inducer (sialic acid for the E. coli construct or IPTG for the B. subtilis construct) under steady-state conditions we generated cells ranging in size from near wild type to two-fold larger than wild type (Figure 5; Figure S3A, S3B; Text S1). We were also able to generate slightly smaller (15–20%) E. coli cells by overexpressing FtsZ ∼60%. However, the same approach was not effective in B. subtilis, most likely due to complications from aberrant polar septation events. We also examined the timing of replication in a strain of B. subtilis harboring a mutation in the cell division gene ezrA (EzrAR510D) that is ∼25% longer than wild type cells but does not have an increase in FtsZ levels [50] (Figure S3C). We examined the timing of initiation of these larger cells by replication run-out and flow cytometry.

Replication initiation earlier in the cell cycle is expected to increase origin number per cell and this expectation was realized (Figure 5). At sizes larger than wild type, replication initiation (oriC number) was proportional to cell size. Since DnaA concentration is constant, total DnaA is thus proportional to cell size. These results support the view that as cell size increases, it is the total amount of DnaA that dictates oriC number in both E. coli and B. subtilis. While this result was expected for E. coli, it was unexpected for B. subtilis. The cell mass independent initiation timing of B. subtilis thus could be limited to small cells only. Nevertheless, the identity of the results in the two bacteria when cell sizes exceed the normal range reveals a remarkable property of the regulatory systems to adjust origin contents in proportion to cell mass.
Discussion
Our investigation evaluating DNA replication initiation in small size mutants of E. coli and B. subtilis suggests that the mechanisms controlling the timing of initiation differ in these two model organisms. Notably, although total DnaA per cell is reduced by about 30% in the mutants of both strains, only the mutant E. coli cells exhibited a delay in initiation. Consistent with growth-dependent accumulation of DnaA-ATP to a critical level being the primary factor governing initiation in E. coli, mutant cells delayed initiation until they reached a size more or less equivalent to wild type at initiation (Figure 2A). A modest supply of extra DnaA alleviated the delay, presumably by increasing the levels of DnaA-ATP available for initiation (Figure 4E). In contrast, the B. subtilis mutants maintained normal initiation timing without requiring extra DnaA supply (Figure 2C).
Different approaches to the same problem
Both E. coli and B. subtilis must coordinate DNA replication with cell growth and division to ensure the production of viable daughter cells. The difference in the initiation timing of the small E. coli and B. subtilis mutants can be explained by the mechanisms that control the activity and availability of DnaA. In E. coli, the inactivation of DnaA-ATP following initiation via RIDA, titration of DnaA by chromosomal binding sites, and the inhibition of dnaA expression through sequestration of oriC, make growth-dependent accumulation of active DnaA to critical levels the primary trigger for replication [3]. In contrast, our finding that replication timing is maintained in B. subtilis despite a 30% reduction in total DnaA, together with mounting evidence that the suite of DnaA regulatory factors are not conserved between B. subtilis and E. coli, suggests that B. subtilis controls initiation primarily by inhibiting DnaA access to oriC during elongation. B. subtilis is not known to generate DnaA-ADP actively, and DnaA-ATP is most likely the major form of DnaA during the entire cell cycle [51]. Instead, interactions between DnaA and DnaN, YabA, Soj and the primosome proteins DnaB and DnaD, as well as DnaA binding sites on the chromosome appear to be critical for inhibiting DnaA binding to oriC and coupling initiation with the cell cycle [24]–[29], [31], [32], [52].
The difference in initiation timing in small cells of the two bacteria can thus be understood if total DnaA concentration can be equated with active DnaA-ATP concentration in B. subtilis but not in E. coli, as the mechanistic studies in the two systems suggest. Importantly, both mechanisms are sensitive to changes in dnaA expression that significantly increase the concentration of active DnaA. In E. coli, overexpressing dnaA leads to premature initiation by uncoupling synthesis of active DnaA from the cell cycle. In B. subtilis, overexpressing dnaA presumably leads to saturation of DnaA binding sites on the chromosome and overcomes the activity of inhibitors resulting in premature initiation.
Rate of replication increases small mutants of E. coli
We find that the C period in mutant E. coli cells is reduced by ∼25% (Figure 4A, 4E). The causal relationship between the delayed initiation and the reduced C period is not obvious. It is possible that the mutations in the genes such as pgm and ftsA affect the C period directly, rather than the cell size. If the generation time and the D period remain unchanged and the C period is shortened, then replication ought to initiate later in the cell cycle. This can be viewed using the simulation of the Cooper-Helmstetter model described in the site http://simon.bio.uva.nl/Object-Image/CellCycle/index.html [53]. The opposite view is that the mutations affect the cell size directly, which necessitates delayed initiation to give time for DnaA-ATP accumulation to an appropriate level, and the delay causes the reduction of C period. This latter view is more likely for the following reasons: 1) a similar increase in replication rate was also seen in conditional mutants of DnaA, which initiated replication with a delay [38], [54]. By the same token, premature triggering of initiation by artificially increasing DnaA levels or deleting seqA increased the C period [55]. 2) There is as yet no observation that directly links pgm and ftsA genes to the replication elongation process. On the other hand, there is extensive data indicating that both the pgm and ftsA* mutations reduce cell size through direct effects on the cell division machinery in E. coli [36]. 3) The orthologous genes, pgcA and pgm, which both control cell size affected the elongation period only in E. coli but not B. subtilis. In other words, if the genes were controlling replication, the function has not been conserved. 4) Since the results were same with both pgm and ftsA* mutants, it is unlikely that two very different proteins are affecting C period directly and similarly. It should be noted that the Cooper-Helmstetter model does not require that a change in initiation timing entail a change in the C or D period. Since the C period nonetheless does change indicates that there is a homeostatic mechanism in E. coli that adjusts the C period in response to the alteration of the initiation time, irrespective of the mechanism by which the initiation time is altered [38], [54].
Mechanistically, how the replication rate can be increased by ∼25% is unclear. The time it takes to replicate the bacterial genome is more or less constant in wild-type cells cultured having doubling times less than 60 minutes, suggesting that elongation is already at maximal speed [5], [56]. We considered the possibility that cells are sacrificing fidelity for speed. However, mutation rates were wild type in both E. coli mutants, suggesting fidelity was not compromised (Table S3).
An alternate possibility is that the pool of dNTPs and other replication determinants available for DNA synthesis likely accrue to higher than regular levels when initiation is delayed in E. coli [57]–[59]. Since C period depends upon both the fork movement rate as well the time required to restart stalled replication forks, one or both of these processes may have been accelerated as a consequence of initiation delay. The shortening of the C period is unlikely due to an increase in ribonucleotide reductase activity, as nrdAB expression is wild type in pgm::kan and ftsA* E. coli cells (Figure S4; Text S1). Regardless of mechanism, the ability to balance changes in the length of one cell-cycle parameter by altering the length of another is a testament to the inherently homeostatic nature of the replication cycle.
Our data also provide an explanation for a somewhat puzzling result obtained by the Cozzarelli lab [60]. Briefly, Hardy and Cozzarelli identified a loss-of-function mutation in pgm in a genetic screen for mutations that reduced negative supercoiling in E. coli. Further characterization suggested that the effect of the pgm mutant on supercoiling was indirect and thus unlikely to be mediated by Pgm binding to DNA. The potential for an increased-rate replication-fork progression in the pgm mutants provides a possible explanation for the observed reduction in negative supercoiling in this strain background. Replication fork progression induces the formation of positive supercoils ahead of the fork [61]. Under normal circumstances topoisomerases reduce this positive supercoiling. We speculate that the increased rate of replication in the pgm mutant overwhelms the actions of these topoisomerases leading to an increase in positive supercoiling and a consequent decrease in negative supercoiling. In contrast, B. subtilis pgcA mutants have wild-type replication rates (Figure 3C) and exhibit normal levels of negative supercoiling [34].
In contrast to the small mutants, in larger FtsZ-depleted cells from both species the number of origins increased proportionally with cell size (Figure 5). This finding is consistent with the concentration of DnaA remaining constant while the total number of DnaA molecules increases in a manner proportional to cell size. Based on this finding, we propose that the increase in total DnaA per cell following partial FtsZ depletion transiently increases the DnaA/origin ratio, leading to an increase in origin firing and an increase in the number of origins/cell. However, once the DnaA/origin ratio approaches wild-type levels, the new ‘ploidy’ is maintained under steady-state conditions thereby explaining the rightward shift in the replication run-out profile. These results are entirely consistent with the constant initiation mass per origin proposal of Donachie, where growth-dependent DnaA accumulation is the trigger for replication initiation [2]. Importantly, these findings are also consistent with the growing body of data indicating initiation is controlled by cell cycle-dependent changes in the ability of DnaA to access to oriC in B. subtilis [26]–[29]. In this case, the initial increase in DnaA levels following FtsZ depletion would transiently overcome the ability of inhibitors such as YabA and Soj to prevent DnaA from accessing oriC and initiating replication. In any event, the ability to adjust DNA concentration to the cell size appears to be a fundamental property of bacteria, as it is a requirement for stable genome maintenance.
Implications
Taking advantage of small size mutants of E. coli and B. subtilis, we demonstrate here that the mechanisms responsible for coordinating DNA replication with cell growth are not conserved in bacteria. The relationship among cell size, DnaA levels, and the initiation of DNA replication has been subject to repeated analysis in E. coli and B. subtilis and remains to be fully understood (e.g. [21], [22], [39]). In contrast to previous work that principally investigated the effect of perturbations in DNA replication on cell size, ours is the first study to address the converse: the effect of perturbations in cell size on replication. Using this independent and complimentary approach our data reinforces the prevailing view that growth-dependent accumulation of DnaA-ATP is the primary trigger for initiation of replication in E. coli. At the same time our approach was essential to reveal that initiation is not tied to a cell size in B. subtilis, implying evolutionary divergence in mechanisms of DnaA-dependent regulation, despite DnaA being the regulator of replication in all studied bacteria. Determining the biochemical basis of the contrasting behavior of replication initiation in the two bacteria remains an exciting study for the future. Moreover, given the apparently divergent mechanisms that control initiation in E. coli and B. subtilis, it will be of great interest to see which strategy is at work in other less studied organisms.
Materials and Methods
Strains and media
All E. coli and B. subtilis strains used are derivatives of MG1655 and JH642, respectively (Table S1). E. coli was cultured in Luria Bertani medium (LB), LB+0.2% glucose, or AB minimal medium [62] supplemented with 0.2% glucose, 0.5% casamino acids, 10 µg/ml thiamine, and 5 µg/ml thymidine. B. subtilis was cultured in LB or minimal S750 [63] with 1% glucose and the appropriate amino acid supplements. Unless otherwise stated, cultures were started from overnight grown cells, diluted to an OD of 0.005, grown to an OD 0.2–0.6, diluted again to an OD of 0.005, grown to an OD of ∼0.3 for further study.
Microscopy
This was performed as described [34]. Openlab's density slice module was employed to determine cellular cross-sectional area. Data was corroborated by staining cells with the membrane dye FM4-64 (Invitrogen) at a final concentration of 1 µm/mL and calculating area through length-by-width measurements.
C and D period determination
E. coli or B. subtilis cells were grown to an OD600 of ∼0.3, treated with sodium azide (300 µg/ml; Fluka BioChemika) and lysed. DNA proximal to the origin (oriC) or terminus (ter) was amplified by qPCR (see Table S2 for oligonucleotide sequences) and results analyzed using the Pfaffl method [64]. Marker ratios were normalized to the ori/ter ratio of either E. coli cells treated with rifampicin (300 µg/ml; Sigma) and cephalexin (36 µg/ml; Sigma) or DNA prepared from B. subtilis spores [65]. Treatment with chloramphenicol (200 µg/ml; Sigma) for 4+ hours was used for replication run-out in B. subtilis.
Flow cytometry
Flow cytometry was performed as described [66] and origins per cell were calculated using the Cell Quest Pro software and processed in Microsoft Excel. For B. subtilis, a sinI null or swrA+ revertant background [67] and brief sonication were employed.
Origins and replication forks per cell
E. coli and B. subtilis strains either encoding a lac operator array near the origin with an inducible source of lacI-gfp, or carrying a fluorescent protein fused to a replisome component, have been described [42], [43], [45], [46]. Cells were grown to OD600 0.25–0.35, stained with FM4-64, and placed on an agarose pad. Cells were scored for number of distinct foci.
Cell age and size at initiation
The initiation age (ai) was calculated by flow cytometry using the following formula: , 0≥ai≥1; where F is equal to the fraction of uninitiated cells [68]. The initiation age was then applied to a distribution of cellular areas to calculate the cell size at initiation. Cell size measured by cross-sectional area correlated well with cell mass measurement by optical density of the culture (Table 1).
Quantitative immunoblotting
Experiments were performed essentially as described [49]. Briefly, lysates from cultures grown to OD600 0.25–0.35 were normalized to either optical density (600 nm) or cell number (determined using a hemocytometer) and subjected to SDS-PAGE. Immunoblots were performed using either E. coli rabbit anti-DnaA antibody (the gift of Jon Kaguni) or B. subtilis chicken anti-DnaA antibody (the gift of Alan Grossman), and cognate goat anti-rabbit or donkey anti-chicken secondary antibody conjugated to horseradish peroxidase (Jackson Immunoresearch). DnaA levels were determined relative to FtsZ in individual strains using ImageQuant software and plotted in Microsoft Excel 2008.
Overexpression of DnaA levels in the E. coli mutants
Cells containing pDS596 [48], a low-copy plasmid with an arabinose inducible copy of dnaA, were cultured in LB and back-diluted ± arabinose without ampicillin. These strains were evaluated by flow cytometry, marker frequency analysis, and quantitative immunoblotting as described above.
Supporting Information
Zdroje
1. SclafaniRAHolzenTM 2007 Cell cycle regulation of DNA replication. Annu Rev Genet 41 237 280
2. DonachieWD 1968 Relationship between cell size and time of initiation of DNA replication. Nature 219 1077 1079
3. KatayamaTOzakiSKeyamuraKFujimitsuK 2010 Regulation of the replication cycle: conserved and diverse regulatory systems for DnaA and oriC. Nat Rev Microbiol 8 163 170
4. SchaechterMMaaløeOKjeldgaardNO 1958 Dependency on medium and temperature of cell size and chemical composition during balanced grown of Salmonella typhimurium. J Gen Microbiol 19 592 606
5. CooperSHelmstetterCE 1968 Chromosome replication and the division cycle of Escherichia coli B/r. J Mol Biol 31 519 540
6. Løbner-OlesenASkarstadKHansenFGvon MeyenburgKBoyeE 1989 The DnaA protein determines the initiation mass of Escherichia coli K-12. Cell 57 881 889
7. LeonardACGrimwadeJE 2010 Regulating DnaA complex assembly: it is time to fill the gaps. Curr Opin Microbiol 13 766 772
8. BramhillDKornbergA 1988 Duplex opening by dnaA protein at novel sequences in initiation of replication at the origin of the E. coli chromosome. Cell 52 743 755
9. DuderstadtKEChuangKBergerJM 2011 DNA stretching by bacterial initiators promotes replication origin opening. Nature 478 209 213
10. CampbellJLKlecknerN 1990 E. coli oriC and the dnaA gene promoter are sequestered from dam methyltransferase following passage of the chromosomal replication fork. Cell 62 967 979
11. KatoJKatayamaT 2001 Hda, a novel DnaA-related protein, regulates the replication cycle in Escherichia coli. EMBO J 20 4253 4262
12. CamaraJEBreierAMBrendlerTAustinSCozzarelliNR 2005 Hda inactivation of DnaA is the predominant mechanism preventing hyperinitiation of Escherichia coli DNA replication. EMBO Rep 6 736 741
13. KitagawaRMitsukiHOkazakiTOgawaT 1996 A novel DnaA protein-binding site at 94.7 min on the Escherichia coli chromosome. Mol Microbiol 19 1137 1147
14. NishidaSFujimitsuKSekimizuKOhmuraTUedaT 2002 A nucleotide switch in the Escherichia coli DnaA protein initiates chromosomal replication: evidnece from a mutant DnaA protein defective in regulatory ATP hydrolysis in vitro and in vivo. J Biol Chem 277 14986 14995
15. SimmonsLABreierAMCozzarelliNRKaguniJM 2004 Hyperinitiation of DNA replication in Escherichia coli leads to replication fork collapse and inviability. Mol Microbiol 51 349 358
16. RiberLLøbner-OlesenA 2005 Coordinated replication and sequestration of oriC and dnaA are required for maintaining controlled once-per-cell-cycle initiation in Escherichia coli. J Bacteriol 187 5605 5613
17. GorbatyukBMarczynskiGT 2001 Physiological consequences of blocked Caulobacter crescentus dnaA expression, an essential DNA replication gene. Mol Microbiol 40 485 497
18. CollierJShapiroL 2009 Feedback control of DnaA-mediated replication initiation by replisome-associated HdaA protein in Caulobacter. J Bacteriol 191 5706 5716
19. MuraiNKurokawaKIchihashiNMatsuoMSekimizuK 2006 Isolation of a temperature-sensitive dnaA mutant of Staphylococcus aureus. FEMS Microbiol Lett 254 19 26
20. SharpeMEHauserPMSharpeRGErringtonJ 1998 Bacillus subtilis cell cycle as studied by fluorescence microscopy: constancy of cell length at initiation of DNA replication and evidence for active nucleoid partitioning. J Bacteriol 180 547 555
21. MoriyaSKatoKYoshikawaHOgasawaraN 1990 Isolation of a dnaA mutant of Bacillus subtilis defective in initiation of replication: amount of DnaA protein determines cells initiation potential. EMBO J 9 2905 2910
22. OguraYImaiYOgasawaraNMoriyaS 2001 Autoregulation of the dnaA-dnaN operon and effects of DnaA protein levels on replication initiation in Bacillus subtilis. J Bacteriol 183 3833 3841
23. OgasawaraNMoriyaSvon MeyenburgKHansenFGYoshikawaH 1985 Conservation of genes and their organization in the chromosomal replication origin region of Bacillus subtilis and Escherichia coli. EMBO J 4 3345 3350
24. ChoEOgasawaraNIshikawaS 2008 The functional analysis of YabA, which interacts with DnaA and regulates initiation of chromosome replication in Bacillus subtilis. Genes Genet Syst 83 111 125
25. GoranovAIBreierAMMerrikhHGrossmanAD 2009 YabA of Bacillus subtilis controls DnaA-mediated replication initiation but not the transcriptional response to replication stress. Mol Microbiol 74 454 466
26. Noirot-GrosMFDervynEWuLJMerveletPErringtonJ 2002 An expanded view of bacterial DNA replication. Proc Natl Acad Sci U S A 99 8342 8347
27. Noirot-GrosMFVeltenMYoshimuraMMcGovernSMorimotoT 2006 Functional dissection of YabA, a negative regulator of DNA replication initiation in Bacillus subtilis. Proc Natl Acad Sci U S A 103 2368 2373
28. SoufoCDSoufoHJNoirot-GrosMFSteindorfANoirotP 2008 Cell-cycle-dependent spatial sequestration of the DnaA replication initiator protein in Bacillus subtilis. Dev Cell 15 935 941
29. HayashiMOguraYHarryEJOgasawaraNMoriyaS 2005 Bacillus subtilis YabA is involved in determining the timing and synchrony of replication initiation. FEMS Microbiol Lett 247 73 79
30. MerrikhHGrossmanAD 2011 Control of the replication initiator DnaA by an anti-cooperativity factor. Mol Microbiol 82 434 446
31. MurrayHErringtonJ 2008 Dynamic control of the DNA replication initiation protein DnaA by Soj/ParA. Cell 135 74 84
32. ScholefieldGWhitingRErringtonJMurrayH 2011 Spo0J regulates the oligomeric state of Soj to trigger its switch from an activator to an inhibitor of DNA replication initiation. Mol Microbiol 79 1089 1100
33. IshikawaSOguraYYoshimuraMOkumuraHChoE 2007 Distribution of stable DnaA-binding sites on the Bacillus subtilis genome detected using a modified ChIP-chip method. DNA Res 14 155 168
34. WeartRBLeeAHChienACHaeusserDPHillNS 2007 A metabolic sensor governing cell size in bacteria. Cell 130 335 347
35. LuMKlecknerN 1994 Molecular cloning and characterization of the pgm gene encoding phosphoglucomutase of Escherichia coli. J Bacteriol 176 5847 5851
36. GeisslerBShiomiDMargolinW 2007 The ftsA* gain-of-function allele of Escherichia coli and its effects on the stability and dynamics of the Z ring. Microbiology 153 814 825
37. GeisslerBElrahebDMargolinW 2003 A gain-of-function mutation in ftsA bypasses the requirement for the essential cell division gene zipA in Escherichia coli. Proc Natl Acad Sci U S A 100 4197 4202
38. BoyeEStokkeTKlecknerNSkarstadK 1996 Coordinating DNA replication initiation with cell growth: differential roles for DnaA and SeqA proteins. Proc Natl Acad Sci USA 93 12206 12211
39. AtlungTHansenFG 1993 Three distinct chromosome replication states are induced by increasing concentrations of DnaA protein in Escherichia coli. J Bacteriol 175 6537 6545
40. BremerHChurchwardG 1977 An examination of the Cooper-Helmstetter theory of DNA replication in bacteria and its underlying assumptions. J Theor Biol 69 645 654
41. MichelsenOTeixeira de MattosMJJensenPRHansenFG 2003 Precise determinations of C and D periods by flow cytometry in Escherichia coli K-12 and B/r. Microbiology 149 1001 1010
42. GordonGSSitnikovDWebbCDTelemanAStraightA 1997 Chromosome and low copy plasmid segregation in E. coli: visual evidence for distinct mechanisms. Cell 90 1 20
43. Reyes-LamotheRPossozCDanilovaOSherrattDJ 2008 Independent positioning and action of Escherichia coli replisomes in live cells. Cell 133 90 102
44. FossumSCrookeESkarstadK 2007 Organization of sister origins and replisomes during multifork DNA replication in Escherichia coli. EMBO J 26 4514 4522
45. LemonKPGrossmanAD 1998 Localization of bacterial DNA polymerase: evidence for a factory model of replication. Science 282 1516 1519
46. LeePSLinDCMoriyaSGrossmanAD 2003 Effects of the chromosome partitioning protein Spo0J (ParB) on oriC positioning and replication initiation in Bacillus subtilis. J Bacteriol 185 1326 1337
47. Den BlaauwenTBuddelmeijerNAarsmanMEHameeteCMNanningaN 1999 Timing of FtsZ assembly in Escherichia coli. J Bacteriol 181 5167 5175
48. HwangDSKaguniJM 1988 Purification and characterization of the dnaA46 gene product. J Biol Chem 263 10625 10632
49. WeartRBLevinPA 2003 Growth rate-dependent regulation of medial FtsZ ring formation. J Bacteriol 185 2826 2834
50. HaeusserDPGarzaACBuscherAZLevinPA 2007 The division inhibitor EzrA contains a seven-residue patch required for maintaining the dynamic nature of the medial FtsZ ring. J Bacteriol 189 9001 9010
51. FukuokaTMoriyaSYoshikawaHOgasawaraN 1990 Purification and characterization of an initiation protein for chromosomal replication, DnaA, in Bacillus subtilis. J Biochem 107 732 739
52. SmitsWKMerrikhHBonillaCYGrossmanAD 2011 Primosomal proteins DnaD and DnaB are recruited to chromosomal regions bound by DnaA in Bacillus subtilis. J Bacteriol 193 640 648
53. ZaritskyAWangPVischerNO 2011 Instructive simulation of the bacterial cell division cycle. Microbiology 157 1876 1885
54. TorheimNKBoyeELøbner-OlesenAStokkeTSkarstadK 2000 The Escherichia coli SeqA protein destabilizes mutant DnaA204 protein. Mol Microbiol 37 629 638
55. AtlungTLøbner-OlesenAHansenFG 1987 Overproduction of DnaA protein stimulates initiation of chromosome and minichromosome replication in Escherichia coli. Mol Gen Genet 206 51 59
56. HelmstetterCE 1968 DNA synthesis during the division cycle of rapidly growing Escherichia coli B/r. J Mol Biol 31 507 518
57. Von FreieslebenURasmussenKVAtlungTHansenFG 2000 Rifampicin-resistant initiation of chromosome replication from oriC in ihf mutants. Mol Microbiol 37 1087 1093
58. AtlungTHansenFG 2002 Effect of different concentrations of H-NS protein on chromosome replication and the cell cycle in Escherichia coli. J Bacteriol 184 1843 1850
59. MorigenOdsbuISkarstadK 2009 Growth rate dependent numbers of SeqA structures organize the multiple replication forks in rapidly growing Escherichia coli. Genes Cells 14 643 657
60. HardyCDCozzarelliNR 2005 A genetic selection for supercoiling mutants of Escherichia coli reveals proteins implicated in chromosome structure. Mol Microbiol 57 1636 1652
61. PostowLCrisonaNJPeterBJHardyCDCozzarelliNR 2001 Topological challenges to DNA replication: conformations at the fork. Proc Natl Acad Sci U S A 98 8219 8226
62. ClarkDJMaaløeO 1967 DNA replication and the division cycle in Escherichia coli. J Mol Biol 23 99 112
63. JaacksKJHealyJLosickRGrossmanAD 1989 Identification and characterization of genes controlled by the sporulation-regulatory gene spo0H in Bacillus subtilis. J Bacteriol 171 4121 4129
64. PfafflMW 2001 A new mathematical model for relative quantification in real-time RT-PCR. Nucleic Acids Res 29 e45
65. SetlowBSetlowP 1998 Heat killing of Bacillus subtilis spores in water is not due to oxidative damage. Appl Environ Microbiol 64 4109 4112
66. FerulloDJCooperDLMooreHRLovettST 2009 Cell cycle synchronization of Escherichia coli using the stringent response, with fluorescence labeling assays for DNA content and replication. Methods 48 8 13
67. KearnsDBChuFBrandaSSKolterRLosickR 2005 A master regulator for biofilm formation by Bacillus subtilis. Mol Microbiol 55 739 749
68. WoldSSkarstadKSteenHBStokkeTBoyeE 1994 The initiation mass for DNA replication in Escherichia coli K-12 is dependent on growth rate. EMBO J 13 2097 2102
69. SekimizuKYungBYKornbergA 1988 The dnaA protein of Escherichia coli. Abundance, improved purification, and membrane binding. J Biol Chem 263 7136 7140
70. HansenFGAtlungTBraunREWrightAHughesP 1991 Initiator (DnaA) protein concentration as a function of growth rate in Escherichia coli and Salmonella typhimurium. J Bacteriol 173 5194 5199
Štítky
Genetika Reprodukční medicínaČlánek vyšel v časopise
PLOS Genetics
2012 Číslo 3
Nejčtenější v tomto čísle
- PIF4–Mediated Activation of Expression Integrates Temperature into the Auxin Pathway in Regulating Hypocotyl Growth
- Metabolic Profiling of a Mapping Population Exposes New Insights in the Regulation of Seed Metabolism and Seed, Fruit, and Plant Relations
- A Splice Site Variant in the Bovine Gene Compromises Growth and Regulation of the Inflammatory Response
- Comprehensive Research Synopsis and Systematic Meta-Analyses in Parkinson's Disease Genetics: The PDGene Database