
The Gene Desert Mammary Carcinoma Susceptibility Locus Regulates Modifying Mammary Epithelial Cell Differentiation and Proliferation
Genome-wide association studies have revealed that many low-penetrance breast cancer susceptibility loci are located in non-protein coding genomic regions; however, few have been characterized. In a comparative genetics approach to model such loci in a rat breast cancer model, we previously identified the mammary carcinoma susceptibility locus Mcs1a. We now localize Mcs1a to a critical interval (277 Kb) within a gene desert. Mcs1a reduces mammary carcinoma multiplicity by 50% and acts in a mammary cell-autonomous manner. We developed a megadeletion mouse model, which lacks 535 Kb of sequence containing the Mcs1a ortholog. Global gene expression analysis by RNA-seq revealed that in the mouse mammary gland, the orphan nuclear receptor gene Nr2f1/Coup-tf1 is regulated by Mcs1a. In resistant Mcs1a congenic rats, as compared with susceptible congenic control rats, we found Nr2f1 transcript levels to be elevated in mammary gland, epithelial cells, and carcinoma samples. Chromatin looping over ∼820 Kb of sequence from the Nr2f1 promoter to a strongly conserved element within the Mcs1a critical interval was identified. This element contains a 14 bp indel polymorphism that affects a human-rat-mouse conserved COUP-TF binding motif and is a functional Mcs1a candidate. In both the rat and mouse models, higher Nr2f1 transcript levels are associated with higher abundance of luminal mammary epithelial cells. In both the mouse mammary gland and a human breast cancer global gene expression data set, we found Nr2f1 transcript levels to be strongly anti-correlated to a gene cluster enriched in cell cycle-related genes. We queried 12 large publicly available human breast cancer gene expression studies and found that the median NR2F1 transcript level is consistently lower in ‘triple-negative’ (ER-PR-HER2-) breast cancers as compared with ‘receptor-positive’ breast cancers. Our data suggest that the non-protein coding locus Mcs1a regulates Nr2f1, which is a candidate modifier of differentiation, proliferation, and mammary cancer risk.
Published in the journal:
. PLoS Genet 9(6): e32767. doi:10.1371/journal.pgen.1003549
Category:
Research Article
doi:
https://doi.org/10.1371/journal.pgen.1003549
Summary
Genome-wide association studies have revealed that many low-penetrance breast cancer susceptibility loci are located in non-protein coding genomic regions; however, few have been characterized. In a comparative genetics approach to model such loci in a rat breast cancer model, we previously identified the mammary carcinoma susceptibility locus Mcs1a. We now localize Mcs1a to a critical interval (277 Kb) within a gene desert. Mcs1a reduces mammary carcinoma multiplicity by 50% and acts in a mammary cell-autonomous manner. We developed a megadeletion mouse model, which lacks 535 Kb of sequence containing the Mcs1a ortholog. Global gene expression analysis by RNA-seq revealed that in the mouse mammary gland, the orphan nuclear receptor gene Nr2f1/Coup-tf1 is regulated by Mcs1a. In resistant Mcs1a congenic rats, as compared with susceptible congenic control rats, we found Nr2f1 transcript levels to be elevated in mammary gland, epithelial cells, and carcinoma samples. Chromatin looping over ∼820 Kb of sequence from the Nr2f1 promoter to a strongly conserved element within the Mcs1a critical interval was identified. This element contains a 14 bp indel polymorphism that affects a human-rat-mouse conserved COUP-TF binding motif and is a functional Mcs1a candidate. In both the rat and mouse models, higher Nr2f1 transcript levels are associated with higher abundance of luminal mammary epithelial cells. In both the mouse mammary gland and a human breast cancer global gene expression data set, we found Nr2f1 transcript levels to be strongly anti-correlated to a gene cluster enriched in cell cycle-related genes. We queried 12 large publicly available human breast cancer gene expression studies and found that the median NR2F1 transcript level is consistently lower in ‘triple-negative’ (ER-PR-HER2-) breast cancers as compared with ‘receptor-positive’ breast cancers. Our data suggest that the non-protein coding locus Mcs1a regulates Nr2f1, which is a candidate modifier of differentiation, proliferation, and mammary cancer risk.
Introduction
An important indicator for breast cancer risk is the family history, suggesting a strong genetic component in breast cancer susceptibility [1]. The heritable portion of a woman's risk to breast cancer consists of numerous risk-increasing and risk-decreasing alleles. Through familial linkage studies in the 1990s, deleterious mutations affecting the coding regions of well-known tumor suppressor genes, i.e. BRCA1 and BRCA2, were found to associate with increased breast cancer risk [2], [3]. Such mutations are rare in the population. More recently, genome-wide association studies (GWAS) have been employed to discover association of common variants with breast cancer susceptibility. GWAS have proven to be successful at uncovering loci harboring low-penetrance breast cancer susceptibility variants [4], [5], [6], [7], [8], [9], [10], [11], [12], [13], [14]. In the future, the identification of these variants will likely impact population-based risk prediction [15], [16]. Many of the variants are located in non-protein coding areas of the genome, such as promoters, introns and intergenic areas with large genomic regions without known genes, called gene deserts. It is anticipated that these variants are involved in gene regulation as exemplified by breast cancer susceptibility-associated variant rs2981582 that is correlated with FGFR2 transcript levels in breast cancer [17] and normal breast tissue [18]. For other non-protein coding breast cancer-associated variants, their spatiotemporal regulatory function and gene targets are largely undefined. Moreover, mechanisms underlying common breast cancer-associated variants on the level of the mammary gland tissue and mammary epithelial cells (MECs) are unknown.
MEC proliferation and differentiation are strongly interconnected processes for which ample evidence exists that these are involved in the development of breast cancer. Recently, flow cytometry-based approaches have yielded many markers that aid in the understanding of the hierarchical order of MEC differentiation [19]. For mouse mammary epithelial cells (MMECs), luminal and basal/myoepithelial populations were identified based on expression of heat stable antigen (HSA; CD24) and β1 integrin (CD29), or HSA and α6 integrin (CD49f). Specific cells of the basal lineage expressing high levels of CD29 or CD49f and high levels of CD24 were shown to harbor repopulating ability in single cell transplantation assays in mice, suggesting the presence of bipotential mammary stem/progenitor cell activity [20], [21]. Markers for lineage-specific progenitor cells have also been identified in the mouse, including CD61, which enriches for mouse luminal progenitors [22]. Later, additional markers for luminal progenitors have been identified, which include c-kit and ALDH [23], [24]. We have reported a flow cytometry-based approach to identifying the luminal and basal/myoepithelial cell lineages in the rat mammary gland [25]. In the early 1990s, clonogenic rat mammary epithelial cells (RMECs) were found to stain with peanut lectin [26], [27]. There is strong interest in the biology of mammary stem/progenitor cells as these are thought to be the target cells for tumorigenic transformation events, mainly because of their immortality and ability to sire many generations of daughter cells. Interestingly, human germ line mutation of BRCA1 has been shown to stimulate luminal-to-basal tumor formation by affecting the luminal progenitor cell pool and luminal cell fate [28], [29], exemplifying a consequence of the involvement of breast cancer susceptibility variants in MEC differentiation.
It is currently unclear if other (e.g. low-penetrance, non-protein coding) breast cancer-associated variants affect MEC proliferation and differentiation. In order to model breast cancer susceptibility loci in a mammalian organism, we have conducted a rat-human comparative genetics approach. Upon initiation of this approach we selected the rat mammary carcinogenesis model, as the arising mammary carcinomas well reflect specific aspects of human breast adenocarcinoma, i.e. staged progression and ovarian hormone responsiveness. The advantage of the rat-human comparative genetics approach is that the availability of mammalian genetic model organisms aids in the dissection of the mechanisms underlying the susceptibility loci [30]. The rat mammary carcinoma resistance quantitative trait locus (QTL) Mcs1 was identified in the backcross progeny of an intercross between the resistant Copenhagen (Cop) and susceptible Wistar-Furth (WF) parental inbred rat strains [31], [32]. Physical confirmation of this resistance locus was presented in a study using a congenic recombinant inbred line having a large portion of the original Mcs1 QTL from the Cop strain introgressed onto the WF genetic background [33]. Congenic rats harboring a homozygous Mcs1 Cop allele had a 85% reduction of 7,12-dimethylbenz(a)anthracene (DMBA)-induced mammary carcinoma multiplicity as compared with congenic control animals homozygous for the susceptible WF Mcs1 allele. Testing various other congenic lines with smaller Cop Mcs1 portions on the WF genetic background revealed that the initial Mcs1 QTL harbors three modifier loci of mammary carcinoma susceptibility, namely Mcs1a, Mcs1b and Mcs1c [33]. In this study, we describe the congenic fine-mapping of the Mcs1a critical interval to a ∼277 Kb region entirely embedded within a large gene desert on rat chromosome 2. Using a congenic rat mammary gland transplantation assay, we show that the Mcs1a locus controls DMBA-induced mammary carcinoma development in a mammary cell-autonomous manner. While the rat mammary carcinogenesis model has proven value to study certain aspects of breast cancer etiology, complex genome-engineering technology for the rat is still under development. Since Mcs1a shows good evolutionary conservation to human, mouse and other mammalian species, we describe the genetic engineering of a novel megadeletion (MD) model in the mouse. Homozygous MD mice lack a large piece of the gene desert including the region orthologous to the Mcs1a critical interval. Taking advantage of both rodent genetic model systems we found an effect of this non-protein coding locus on MEC proliferation/differentiation and identified the orphan nuclear factor Nr2f1/Coup-tf1 as the Mcs1a target gene. To investigate its translational potential we analyzed NR2F1 transcript levels in available global gene expression data for human breast cancers. We show the correlation of low NR2F1 transcript levels with high-grade and discuss the implication of this finding for human breast cancer. Using this rat-mouse-human comparative genetics approach we identified Nr2f1 as a novel gene target for the development of breast cancer prevention or therapeutic strategies.
Results
The Mcs1a critical interval is located in a gene desert
We previously showed that the mammary carcinoma resistance allele Mcs1a from the Cop inbred strain when introgressed onto the susceptible WF inbred genetic background reduced DMBA-induced mammary carcinoma multiplicity by ∼50%, as compared with the susceptible congenic control line, not carrying the Cop Mcs1a allele [33]. Using multiple additional congenic lines, we now present further fine-mapping of the interval conferring the reduction in DMBA-induced mammary carcinoma multiplicity phenotype (Figure 1A). The resistant congenic lines have a significantly (P<0.001) lower mammary carcinoma multiplicity as compared with the susceptible congenic control line (WF.Cop; Figure 1B). The susceptible congenic lines have a mammary carcinoma multiplicity not different from the susceptible congenic control line (P>0.2). The resistant congenic lines together with the susceptible congenic lines V5 define the Mcs1a critical interval as a ∼277 Kb genomic region located in a gene desert on rat chromosome 2. The gene desert is flanked by Nr2f1 at the proximal side (Figure 1A) and Arrdc3 at the distal side (outside the window in Figure 1A).

Using resistant congenic lines W4 and W5, susceptible congenic line R5 and the susceptible congenic control line WF.Cop, we tested if Mcs1a also confers resistance to N-methyl-N-nitrosourea (MNU)-induced mammary carcinogenesis. The resistant congenic line W5 showed a decreased mammary carcinoma multiplicity phenotype (P = 0.008) as compared with WF.Cop and the resistant congenic line W4 showed a strong trend (P = 0.08) towards a decreased MNU-induced mammary carcinoma multiplicity. The susceptible congenic line R5 was not different from the WF.Cop line (Figure 1C). Subsequently, carcinoma multiplicities following mammary ductal infusion of retrovirus expressing the activated HER2/neu oncogene were determined [34]. In this assay, the resistant congenic line R3 had a significantly reduced mammary carcinoma multiplicity (P = 0.04) as compared with the susceptible congenic line A4 (Figure 1D). These data show that Cop inbred strain-derived alleles of the Mcs1a locus (that include the smallest critical interval) introgressed on the susceptible genetic background confer resistance to three distinctly acting mammary carcinogenic treatments. These data suggest that the resistance mechanism likely manifests beyond the stage of (carcinogen-specific) cancer initiation.
Mcs1a modulates susceptibility through a mammary cell-autonomous mechanism
To ask if Mcs1a acts via a mammary cell-autonomous mechanism, a mammary gland transplantation assay was carried out. Mammary gland tissue from donor animals of the susceptible inbred WF rats or the Mcs1a resistant congenic line Y4 was transplanted into the interscapular white fat pads of recipient animals with the same genotype or F1 animals of an intercross between WF and Y4. A total of 228 transplantations were performed, of which only 2 failed to produce a mammary outgrowth. For the 4 transplant groups (donor to recipient; susceptible to susceptible S:S, susceptible to F1 S:F1, resistant to F1 R:F1, and resistant to resistant R:R) carcinoma development following DMBA exposure was monitored (Table 1). The mammary carcinoma incidence at the transplant site was 41%, 36%, 13%, and 9% for transplant groups S:S, S:F1, R:F1, and R:R, respectively. Logistic regression analysis revealed that donor genotype (P = 0.0024), but not recipient genotype (P = 0.59) was significantly associated with transplant site carcinoma development (Table 1). The interaction between donor and recipient genotype was not significant (P = 0.44) for the dependent variable mammary gland transplant carcinoma susceptibility (Table 1). These data demonstrate that the mammary carcinoma susceptibility phenotype mediated by Mcs1a is transferable by transplantation of the mammary gland, indicating that Mcs1a modulates susceptibility in a mammary cell-autonomous manner.

A megadeletion (MD) mouse model for the rat Mcs1a locus reveals the orphan nuclear factor Nr2f1 as a Mcs1a target gene
Considering the evolutionary conserved nature of the locus, we sought to genetically engineer a mouse model for the rat Mcs1a locus. In mouse ES cells, we employed a MICER vector-assisted double targeting strategy to insert (on the same chromosome) loxP sites at either side of the gene desert region orthologous to the rat Mcs1a critical interval that was known at the time of design (Figure 2A). Both targeting steps were checked for proper integration of the MICER construct by Southern blot analysis. The proximally located MICER construct harbors the 3′ half (exons 3–9) of the Hprt gene and the distal construct harbors the 5′ half (exons 1–2) of Hprt that upon proper Cre-lox recombination form a functional Hprt gene. Following Cre-recombinase transfection and Hprt selection, the MD mutation was created and the mouse model was generated through blastocyst injections of karyotypically normal ES cells. After germ line transmission of the mutation, homozygous mutants were obtained and tested for lack of the 535 Kb targeted region in the Mcs1a orthologous gene desert on mouse chromosome 13 (Figure 2A). PCR tests using 4 different primer combinations within the deleted sequence and 2 primer combinations spanning the deletion showed consistent results that the region is indeed deleted. An example of a genotyping gel image is shown in Figure S1. The mutation was transferred through 10 generations of breeding to 2 inbred genetic backgrounds, namely FVB/N (FVB) and C57Bl/6 (B6).
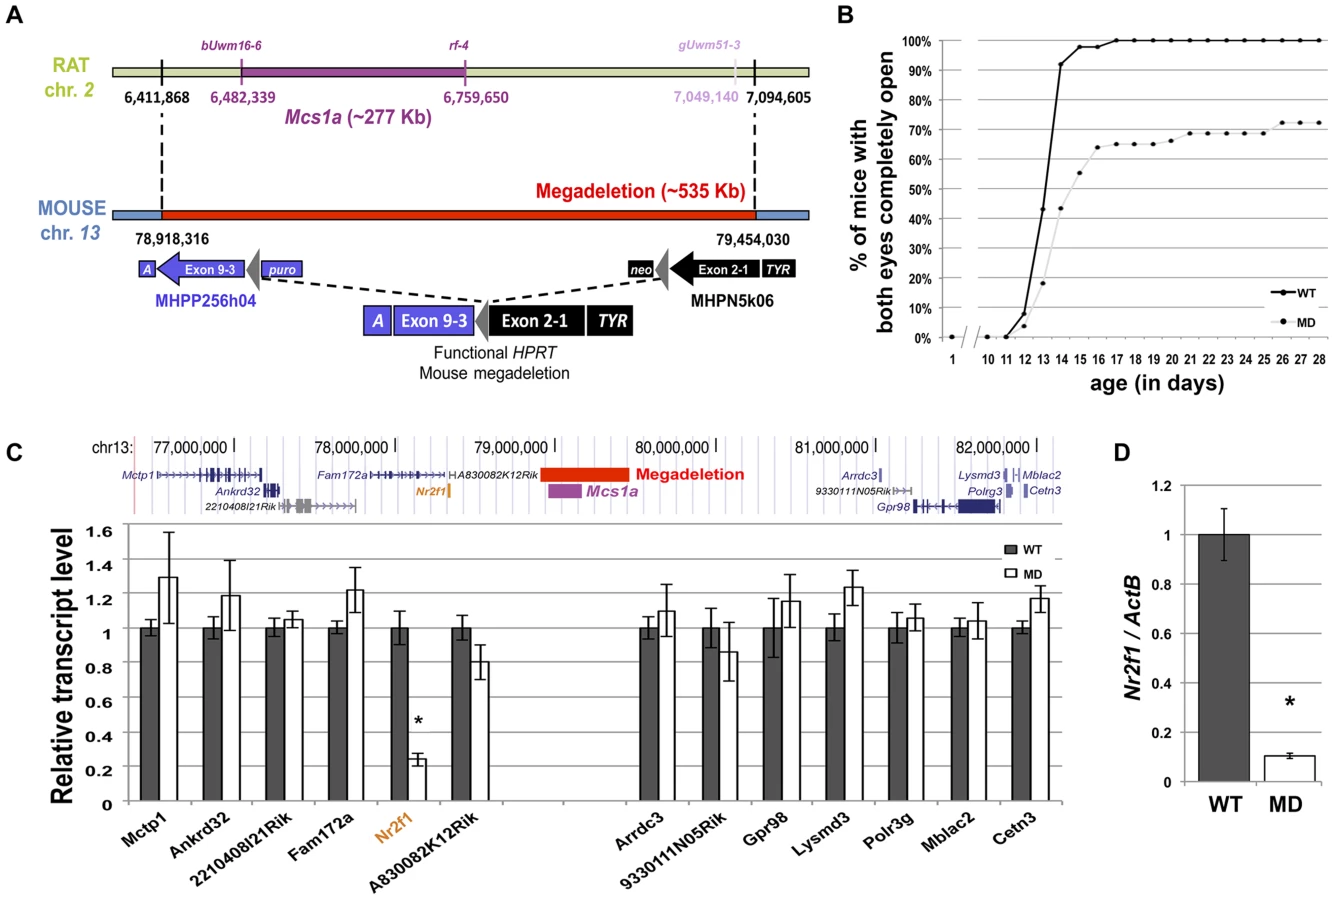
Homozygous MD mice of both genetic backgrounds are viable and litter sizes are normal as compared with wild type (WT) animals, suggesting there is no embryonic or neonatal lethality associated with the mutation. Groups of homozygous MD and WT mice were monitored for obvious phenotypes. There was no difference in body weight up to 1 year of age and life span was not affected during the same period. An obvious phenotype we noticed was delayed eyelid opening of homozygous MD mice on both genetic backgrounds (Figure 2B, shown for FVB). While all WT animals had both eyelids completely open by 17 days of age, this was observed for only 65% of homozygous MD mice. For some animals, the closed eyelid phenotype persisted for months (unpublished data).
It is anticipated that a large portion of the non-protein coding capacity of the genome may be involved in the spatiotemporal regulation of gene expression [35]. For many non-coding elements, the target genes of regulation are unknown. We performed a global gene expression study by RNA-seq on mammary gland RNA samples from MD and WT mice (FVB). First, the quality-filtered reads were mapped to the mouse genome. We focused on reads mapping to the Mcs1a-associated gene desert to check for putative unknown transcripts located within the deleted region. We found only 6 reads from the WT samples aligning to the MD region, suggesting that no highly expressed unknown transcript exists within the region. As expected, no reads from the MD samples aligned to the deleted region.
Next, the reads were mapped to the mouse Ensembl reference set of 82,508 transcripts (annotated to 31,034 genes) using Bowtie [36]. Relative transcript abundance was determined using the RSEM algorithm [37]. For the detection of differential gene expression between MD and WT samples, the edgeR package was used [38]. First, we looked at the levels of transcripts within 2.5 Mb of either side of the Mcs1a-associated gene desert (Figure 2C). The only transcript with significantly different levels between the MD and WT samples was Nr2f1 (P<0.001). This gene is located adjacent to the gene desert at a genomic distance of approximately 800 Kb from the Mcs1a orthologous locus. To verify that Nr2f1 is indeed a target gene, we used TaqMan gene expression assays on additional mammary gland samples. Nr2f1 was found to be downregulated by more than 80% in the MD samples as compared with the WT samples (Figure 2D, P<0.001). We also checked Nr2f1 transcript levels in three other tissues. In thymus and ovary, we found that Nr2f1 transcript levels are greatly reduced (Figure S1, P<0.001), to similar levels as the mammary gland. In the liver, however, Nr2f1 transcript levels were not significantly different between MD and WT samples (Figure S1, P = 0.27), suggesting that there is some tissue-specificity in this regulatory mechanism.
The non-protein coding Mcs1a locus regulates mammary gland transcript levels of Nr2f1
Considering Nr2f1 as the main target of the Mcs1a locus, we also looked at its transcript levels in mammary glands (MG), rat mammary epithelial cells (RMECs) and mammary carcinomas (carc.; induced by DMBA and MNU) from susceptible congenic control (WF.Cop) and Mcs1a resistant congenic rats. The resistance allele was provided by the W4 or W5 congenic lines. Since the W4 and W5 lines did not differ significantly, data from both lines was included. For the RMECs, only data for the W4 resistant congenic line was obtained. The Mcs1a resistance allele was associated with increased Nr2f1 levels in mammary gland (P = 0.01; Figure 3A) and RMEC (P = 0.02; Figure 3B). Both DMBA - and MNU-induced carcinomas from Mcs1a resistant congenic animals had strongly increased Nr2f1 transcript levels, as compared with DMBA - and MNU-induced carcinomas from susceptible control congenic rats (P<0.001; Figure 3C).

As the Mcs1a locus is located at a genomic distance of over 800 Kb from Nr2f1, we asked if a chromatin looping structure exists that would support such long distance regulation. The chromosome conformation capture (3C) assay was developed to detect higher-order chromatin interactions for any locus of interest [39], [40]. To apply this methodology and investigate higher-order chromatin interactions between Mcs1a and Nr2f1, RMECs were fixed using formaldehyde to crosslink proteins and DNA, thus capturing interacting chromatin fragments. Crosslinked chromatin was digested using the BglII restriction enzyme and ligated in a large volume (of 7 ml). The large volume ligation reaction reduces random ligations and favors ligations of crosslinking-captured DNA fragments. Ligation events were detected and quantified using PCR and agarose gel electrophoresis. The PCR detection assay was designed such that the fixed primer was located in the rat Nr2f1 promoter (Figure 3D). The experimental primers were located within the Mcs1a critical interval (Table S2), overlapping with areas of the strongest evolutionary conservation (Figure 3D). Each experimental primer was tested in combination with the fixed primer on the 3C templates and a positive control (BAC-derived) template. The relative interaction frequency of two chromatin fragments represented by a primer pair equals the PCR signal intensity of the RMEC 3C template relative to that of the positive control template. We found an area of multiple BglII restriction fragments with increased relative interaction frequencies above background levels (P<0.05) to exist within the Mcs1a critical interval (Figure 3D). The main peak coincides with genetic elements of the highest evolutionary conservation present in Mcs1a. These findings suggest that a putative regulatory element within Mcs1a forms a higher-order chromatin structure with the Nr2f1 promoter over 820 Kb of genomic sequence (Figure 3E). None of the interactions is significantly different between the susceptible and resistant Mcs1a genotypes, suggesting that the DNA-binding proteins facilitating the interactions do not involve polymorphic sites. To identify genetic variants within and in the vicinity of the looped fragments that may explain Nr2f1 transcript regulation, we resequenced approximately 12.5 Kb of the genomic region involved in the higher-order chromatin structure in the WF and Cop parental inbred strains and found 17 genetic variants (Figure S2; Table S3). For only 1 variant, the resistance (Cop) allele (a 14 bp deletion) is predicted to disrupt a rat-mouse-human-conserved binding motif, namely COUP-TF (V$Coup_01; Figure S2). As the Mcs1a resistance allele is associated with increased Nr2f1/Coup-tf1 expression (Figure S2), it is possible that the 14 bp deletion polymorphism of the Mcs1a resistance allele omits a Nr2f1 self-repressive gene expression modulatory function that acts through the intact COUP-TF binding motif on the susceptible Mcs1a allele. Such regulatory function would have to be investigated in detail in the future.
Mcs1a affects MEC proliferation and differentiation
Since Mcs1a is mammary cell-autonomous, we asked if the locus has an effect on MEC biology, i.e. proliferation and differentiation. First, we tested for differential repopulating ability of RMECs from susceptible congenic control (WF.Cop) and Mcs1a resistant congenic animals. The resistance allele was provided by the W4 or W5 congenic lines. Differential repopulating ability could be indicative of a quantitative or functional difference in the mammary stem cell pool potentially underlying the susceptibility phenotype. Freshly isolated RMECs from Mcs1a resistant congenic animals and susceptible congenic control animals were grafted into the interscapular white fat pads of recipient animals of the same genotype. A dilution series of 250, 500, 1000, 2000, 4000 and 8000 cells was tested (Figure 4A). Six weeks after transplantation, the interscapular fat pads were harvested and scored for presence of mammary ductal structures as previously described [41]. The repopulating ability (determined by the estimated number of cells required to give 50% outgrowth occurrence) of RMECs from the susceptible congenic control animals was found not to be different (P>0.05) than that of the Mcs1a resistant congenic animals of either line W4 or W5. Another statistical approach was taken to seek for a possible difference in outgrowth potential at each cell number individually between the susceptible and resistant (W4 and W5 combined) genotypes. Therefore, Chi-square tests for independent distributions in a 2×2 contingency matrix were conducted. At all cell numbers the outgrowth potential for the resistant genotype was not different (P>0.05) than that of the susceptible genotype. These data suggest that the Mcs1a allele does not affect mammary stem cell activity.

In the next experiment, we tested the colony-forming ability in Matrigel of a purified population of clonogenic RMECs from Mcs1a resistant congenic (line W4) and susceptible congenic control (WF.Cop) animals. This assay tests the proliferating potential of the clonogenic RMEC pool. Freshly isolated single RMECs were antibody-stained and sorted using FACS. Gating strategies were used to exclude hematopoietic cells (CD45) and endothelial cells (CD31). From the RMEC-enriched (CD31–CD45−) population, the luminal cells (CD24hiCD29med) were selected and separated based on staining with anti-CD61 and peanut lectin (PNL; Figure 4B). We chose to focus on the luminal population, since CD61hi luminal cells have previously been identified in the mouse as the luminal progenitor population [22] and PNLhi clonogenic rat cells were previously found to overlap largely with the luminal population [25]. The colony-forming ability of 3 sorted cell fractions was tested, namely luminal CD61hiPNL+, CD61+PNLhi and CD61+PNL+ (Figure S3). From each sorted fraction, 10,000 cells were plated in Matrigel for each well. After 10 days of culturing, the colony-forming ability was determined by counting the spherical mammary colonies (Figure 4C, lower panel). For every sorted sample, we found that the CD61+PNLhi cell fraction had a ∼6-fold (P<0.001) increased colony-forming ability and the CD61hiPNL+ cell fraction a ∼1.6-fold (P = 0.02) decreased colony-forming ability, as compared with the CD61+PNL+ cell fraction (Figure S3), verifying that in rats PNLhi luminal MECs are enriched with progenitor cells. When comparing the susceptible congenic control and the Mcs1a resistant congenic samples, we found that the CD61+PNLhi cell fraction from the susceptible congenic control samples had a more than 2-fold increased colony-forming ability (Figure 4C; P = 0.02). These results indicate that the susceptible congenic control luminal RMEC fractions have increased proliferative capacity as compared with the Mcs1a resistant congenic RMEC fractions.
We also looked for quantitative differences in RMEC differentiation between susceptible congenic control (WF.Cop) and the Mcs1a resistant congenic animals. The resistance allele was provided by the W4 or W5 congenic lines. Fresh RMECs were obtained and stained for FACS analysis, as described previously [25]. The Mcs1a resistant congenic animals have more luminal (P = 0.02) and less basal (P = 0.02) RMECs as compared with susceptible congenic animals (Figure 5A), which significantly shifts the luminal-to-basal ratio by 34% (P = 0.008). The abundance of PNLhi or CD61hi subpopulations (Figure 5B) as well as the mean fluorescence intensities (not shown) of these stainings were not different between susceptible and resistant Mcs1a congenic animals. In addition, we looked at MMEC differentiation in WT and MD mice by FACS analysis, as described previously [42]. Like for the rat, we used antibodies against CD45 and CD31 to exclude hematopoietic and endothelial cells, respectively, and antibodies against CD24 and CD29 to quantify luminal and basal MMEC populations (Figure 5C). Like for Mcs1a congenic resistant and susceptible control rats, we found a shift of 36% in luminal-to-basal ratio between WT and MD mice. MD mice had a less abundant luminal and a trend towards a more abundant basal population (Figure 5C, P<0.001 and P = 0.10 for luminal and basal, respectively). Similar results were obtained for the MD mutation on both genetic backgrounds (FVB, B6). We also performed this analysis based on CD29 and CD61 expression to quantify mature luminal (ML, CD29medCD61−), luminal progenitors (LP, CD29medCD61+) and mammary stem/progenitor cells (MaSc, CD29hiCD61+). As compared with WT mice, the MD mice had a less abundant mature luminal population (P<0.001), a trend towards a less abundant luminal progenitor population (P = 0.09) and no significantly different mammary stem/progenitor cell population (P = 0.26; Figure 5D), suggesting that the Mcs1a-associated gene desert locus primarily affects luminal differentiation. Both MD mice and susceptible congenic control rats have a lower abundance of luminal cells and lower Nr2f1 transcript levels, as compared with WT mice and Mcs1a resistant congenic rats, respectively, suggesting that Nr2f1 modulates luminal MEC differentiation.

Next, we tested if short interfering RNA (siRNA)-mediated knockdown of Nr2f1 transcript levels in cultured human breast cells is capable of directly influencing the cellular differentiation pattern. The human breast cancer cell line MCF7 and breast epithelial cell line MCF10A were transfected with siRNAs against NR2F1 (siNR2F1) and non-targeting control siRNA (siCONTROL). No morphological differences were observed between cells transfected with siNR2F1 or siCONTROL. At 40 hours after transfection, cells were harvested for Nr2f1 expression analysis and stained for FACS analysis with fluorescently labeled antibodies against commonly used markers of MEC differentiation, namely CD24, CD29, CD44 and CD49f. As expected, the siNR2F1-treated cells have an over 2-fold reduction of NR2F1 transcript level, as compared with siCONTROL-treated cells (Figure S4). In both MCF7 and MCF10A we found that NR2F1 knockdown upregulated CD24, as compared with treatment of the cells with non-targeting siRNAs. None of the other markers of differentiation was affected by NR2F1 knockdown (Figure S4), suggesting that Nr2f1 transcript levels have a direct effect on cellular differentiation through upregulation of CD24.
Global gene expression analysis reveals a proliferative expression signature associated with low Nr2f1 transcript levels in mouse mammary gland and human breast cancer
In the global RNA-seq expression analysis, 1,531 genes were found to be differentially expressed (DE) between the mammary gland samples from MD and WT (FVB) mice (Table S4). Of these, 412 genes have annotated 1-1-1 mouse-rat-human orthologues. Nr2f1 is listed in the top 10 genes with the lowest P-value and is the top of the list of genes with 1-1-1 mouse-rat-human orthologues (Table S4). We applied a gene expression correlation clustering analysis using the 412 DE genes with 1-1-1 orthologues. The DE genes mainly clustered into three groups and Nr2f1 is found in the first group (Figure 6A). To functionally annotate the groups of correlated genes, two online gene ontology (GO) category enrichment calculation tools were used, namely the Gene Ontology enRIchment anaLysis and visuaLizAtion tool (GOrilla) and the Database for Annotation Visualization and Integrated Discovery (DAVID) [43], [44]. The Nr2f1 containing group is weakly enriched for genes related to cell migration, the extracellular matrix and innate immunity/inflammation (Table S5). The second group of strongly correlated genes was found not to correlate or anti-correlate with groups 1 and 3. This group was enriched for genes related muscle contractile function (Table S5). Group 3 is anti-correlated to the Nr2f1-containing group and is strongly enriched in genes related to the cell cycle, proliferation and DNA-damage response (Table S5). These results implicate that reduced Nr2f1 transcript levels in the MD mammary gland is associated with an increased expression of cell cycle-related genes, which may render the mammary gland in a more proliferative state.

From the publicly available breast cancer global gene expression study GSE3494 containing data for 243 breast cancers [45], we selected 412 human probe sets from the Affy U133a array that are annotated to correspond to the 412 mouse DE genes. By performing the same correlation clustering analysis, an expression correlation pattern was identified to consist of 3 groups (Figure 6B). Group 1, again, is the NR2F1-containing group, weakly enriched with genes involved in developmental processes such as brain segmentation and morphogenesis (Table S6). Group 2 is now a large group that can be split up into subgroup 2a and 2b. Group 2 as a whole and subgroup 2b are strongly enriched with muscle contraction-related genes, whereas subgroup 2a is weakly enriched for muscle protein - and extracellular-related genes and is considered to be a mix between group1 and 2. Similar to the mouse mammary gland correlation analysis, group 3 is very strongly enriched for cell cycle/proliferation and DNA-damage response-related genes and is anti-correlated to the NR2F1-containing cluster (Table S6), suggesting that also in human breast cancer low NR2F1 transcript levels are associated with an increase in cell cycle-related gene expression.
Next, we looked if the similarities in gene expression patterns between the mouse MD mammary gland and the human breast cancer data set hold up within the genome-wide data sets. From the GSE3494 global gene expression study, we selected 9,828 human probe sets from the Affy U133a array that are annotated to have 1-1-1 mouse-rat-human orthologues. First, we checked for similarities between the human and mouse data sets in gene lists anti-correlated to Nr2f1 transcript levels. From the list of 126 human genes in the clustered group of genes anti-correlated to NR2F1 transcript levels (Group 3, Table S6), 51 and 64 genes were found to be present in the top 100 and 200 anti-correlated genes to the Nr2f1 transcript level in the mouse study, respectively. The probability that 51 or 64 of the anti-correlated genes (Group 3) would be in the top 100 or 200 anti-correlated from all 9,828 genes by chance would be <10−74 or <10−78, respectively, suggesting high similarity in genes anti-correlated to NR2F1/Nr2f1 between human breast cancer and the mouse MD mammary gland. Similar analysis for the 37 genes in the NR2F1-containing cluster (Group 1, Table S6) yielded 3 and 5 genes in the top 100 and 200 genes correlated to the Nr2f1 transcript level, which translates to a probability of this occurring randomly of 0.000571 and 0.000106, much higher than the probabilities for the anti-correlated genes.
We also functionally explored the genes most correlated and anti-correlated to NR2F1/Nr2f1 in both the human and mouse data set, regardless of the occurrence of the genes in the mouse DE gene-based cluster analysis. From the 59 genes with strongest anti-correlation (r<−0.3) to NR2F1 in the human breast cancer data set, 41 (69%) were also found to be among the strongest anti-correlated (r<−0.3) to Nr2f1 in the mouse MG data set, which is 2-fold enrichment in comparison to strongly anti-correlated genes (r<−0.3) to Nr2f1 in the entire mouse data set (34%). These 41 genes are found to be strongly enriched with cell cycle/proliferation-related genes (Table S7). From the 297 genes with strongest correlation (r>0.3) to NR2F1 in the human breast cancer data set, 64 (22%) were also found to be the strongest correlated (r>0.3) to Nr2f1 in the mouse MG data set, which is 1.3-fold enrichment in comparison to equally strongly correlated genes (r>0.3) to Nr2f1 in the entire mouse data set (17%). These 64 genes are found to be enriched with genes involved in a wide variety of processes, including extracellular matrix and developmental processes, as well as signaling pathways (Table S7). These analysis suggest that the human breast cancer and the MD mouse MG gene expression data sets are particularly similar in genes anti-correlated with NR2F1/Nr2f1, which are strongly enriched with genes involved in cell cycle/proliferation.
Proliferation gene signatures have been explored for usage as prognostic markers in breast tumor expression studies [46]. Upregulation of such genes in breast cancer is generally indicative of poor prognosis [47], [48]. In a study to identify a novel gene list for “breast cancer intrinsic” subtype classification, a 20-gene proliferation signature was found to form one of the predictive modules [49]. Of these 20 genes, we found 14 to have human-rat-mouse orthologues of which 10 were DE in the mouse MG RNA-seq study with all 10 genes upregulated in the MD samples. The probability of selecting by chance 10 of these 14 proliferation signature genes into the 412 mouse DE gene set out of a total of 9,828 genes is lower than 10−11. This result suggests that the MD mammary gland gene expression profile (with low Nr2f1 transcript levels) shows signs of a proliferative environment. This result is in accordance with the result from the Matrigel assay that indicated an increased colony-forming ability for selected cells from the susceptible mammary gland (with lower Nr2f1 transcript levels) as compared to those from the resistant congenic mammary gland.
NR2F1 transcript levels in human breast cancer
Since Nr2f1 is implicated in MEC proliferation and differentiation in mice and rats, we asked if NR2F1 transcript levels correlate with clinical features of human breast cancer. The Oncomine database encompasses a comprehensive listing of breast cancer gene expression studies, including available clinical information on the samples [50]. When including 12 studies with 120+ samples for each study we found that the average of the median NR2F1 transcript levels reduces with increased histological grade (Figure 7A). Histological grade 3 tumors are more proliferative and more poorly differentiated than grade 1 or 2 tumors. The therapy-resistant and most aggressive form of breast cancer, based on hormone receptor status is the ‘triple-negative’ class of tumors that are more likely to be of grade 3 when resected. Median NR2F1 transcript levels were found to be lower in triple-negative breast cancers, as compared with ‘receptor positive’ (non-triple-negative) breast cancers (Figure 7A). In accordance with this finding, estrogen receptor (ER)-negative and progesterone receptor (PR)-negative breast cancers had lower median transcript levels of NR2F1 as compared with their positive counterparts (Figure 7A). Notably, NR2F1 transcript levels were found to be lower in human epidermal growth factor receptor 2 (HER2)-negative breast cancers (that mostly are ER-positive), as compared with the more aggressive HER2-positive breast cancers (Figure 7B).

Finally, we asked if Nr2f1 transcript level anti-correlated with histological grade within both ER-positive/ER-negative and within both HER2-positive/HER2-negative breast cancer subtypes. For 2 of the 12 previously mentioned breast cancer gene expression studies we obtained the raw data from the gene expression omnibus (GEO; GSE3494 and GSE5460). The GSE3494 data set consists of microarray gene expression data for ER-positive and ER-negative breast tumors including histological grade 2 and 3 tumors in both ER classes and the GSE5460 data set consists of data for HER2-positive and HER2-negative breast tumors including histological grade 2 and 3 tumors in both HER2 classes. We found that NR2F1 transcript levels are significantly lower in grade 3 tumors as compared with grade 2 tumors in both ER classes (Figure 7B, left panel), as well as in both HER2 classes (Figure 7B, right panel). Additionally, in the GSE5460 data set the grade 3 HER2-positive breast cancers were found to have higher NR2F1 transcript levels as compared with the grade 3 HER2-negative breast cancers (Figure 7B, right panel), suggesting a regulatory effect of HER2 amplification on NR2F1 transcript levels. In summary, these analyses indicate that low transcript levels of NR2F1 are strongly associated with high histological grade, poorly differentiated, highly proliferative breast cancers, including therapy-resistant ‘triple-negative’ breast cancer.
Discussion
The inherited portion of breast cancer susceptibility is complex and likely involves numerous genetic factors [51], [52]. With the results from genome-wide association studies (GWAS) it became clear that the genetic landscape of breast cancer susceptibility largely consists of low-penetrance alleles that are common in the population [53]. Many such alleles are located in non-protein coding regions of the genome, including in gene deserts, such as the one on human chromosomal band 8q24 [5]. Mechanisms underlying the genetic associations are largely unknown. It is generally hypothesized that non-protein coding variants could modulate disease processes through the regulation of gene expression.
Like for human breast cancer susceptibility, many loci associated with rat mammary cancer susceptibility have been discovered over the last decade [54]. Multiple of these QTL have been identified by our laboratory through linkage analysis and fine-mapping using congenic recombinant lines [32], [33], [55], [56], [57]. For some of the rat loci, common alleles associated with breast cancer susceptibility in the human orthologous loci were found [58], [59]. One major advantage of such rat-human comparative genetics approach is the availability of a highly relevant genetic mammalian model system for mechanistic studies [30]. Understanding how loci affect breast cancer susceptibility will be informative in the design of preventative or early intervention strategies that would be applicable to many women at risk.
In this study, we identified a 277 Kb critical interval for the previously discovered Mcs1a resistance allele that is derived from the Cop inbred rat strain [33]. The allele when introgressed on the susceptible genetic background from the WF inbred rat strain modulates mammary carcinoma multiplicity by approximately 50%. The protective effect of the allele works against three distinctly acting carcinogenic treatments, indicating that the mechanism modulates mammary carcinogenesis beyond a carcinogen-specific initiation stage. Since the susceptibility or resistance phenotype of the WF or Cop Mcs1a allele, respectively, is transferrable in a mammary gland transplantation/carcinogenesis study, we concluded that the locus modifies mammary carcinoma development in a mammary cell-autonomous manner. This is in contrast to the Wistar-Kyoto (WKy) inbred strain-derived Mcs5a resistance locus, for which we previously published a non-mammary cell-autonomous mode of mammary carcinoma development modulation using a similar transplantation/carcinogenesis assay [60].
Markedly, the location of the 277 Kb critical interval lays within a 3 Mb gene desert, which classifies the Mcs1a allele as non-protein coding. To identify the gene targets for regulation by the Mcs1a associated non-protein coding region, we developed a mouse model lacking a 535 Kb gene desert region orthologous to Mcs1a. The mouse model organism was chosen, as a large deletion (i.e. megadeletion; MD) engineering resource by means of MICER vectors was readily available. A MICER vector-assisted large deletion mouse model had aided before in discovering the gene targets of regulation by a non-protein coding region associated with coronary artery disease [61]. At the time we developed our MD mouse model, targeted rat genetic manipulation technologies were still under development. With the current maturation of zinc-finger nuclease-mediated genome editing technology [62], [63], a similar MD approach will be applicable to the rat model organism in the near future. Using RNA-seq we characterized mammary gland gene expression of MD and WT mice. Of genes surrounding the gene desert within 2.5 Mb, we only found the transcript level of the orphan nuclear receptor gene Nr2f1/Coup-tf1 to be strongly reduced upon deletion of the non-protein coding region. In addition, in the global RNA-seq gene expression analysis, Nr2f1 had the lowest P-value of all differentially expressed genes with annotated 1-1-1 mouse-rat-human orthologs. This gene is located at a genomic distance of over 800 Kb from the MD mutation, suggesting the presence of a strong Nr2f1 distal enhancer in the deleted region. Nr2f1 transcript levels were found to be downregulated in whole mammary gland, RMEC and mammary carcinoma samples from susceptible congenic controls as compared with Mcs1a resistant congenic rats. These results identify Nr2f1 as a strong candidate breast cancer susceptibility gene whose increased mammary transcript levels are associated with resistance to mammary carcinoma development. It is worth mentioning that the difference in Nr2f1 transcript levels between the susceptible and resistant Mcs1a alleles are more substantial in tumors as compared with untransformed cell types of the mammary gland. A plausible explanation for this observation could be that Nr2f1 transcript levels in an unidentified progenitor (or perhaps cancer-initiating) RMEC population may show similar substantial differences, which could be masked by other cell types present in the whole mammary gland or RMEC samples. The presence of a higher-order chromatin structure connecting the Nr2f1 promoter with a strongly conserved element within Mcs1a supports the long-range (∼820 Kb) regulatory potential of the Mcs1a locus. It should also be noted that the 3C assay was biased towards elements with the strongest evolutionary conservation (through fishes). Potentially interesting interacting elements in less conserved sequences may have been overlooked. Because the intensity of the chromatin loop is not affected by the Mcs1a alleles, but Nr2f1 transcript levels are, we hypothesize that the proteins involved in the higher-order chromatin interaction may be not be the same factors regulating Nr2f1. Resequencing of the interacting region in the Cop and WF parental inbred strains revealed the presence of 17 polymorphisms. Only one polymorphism, a 14 bp deletion in the Cop strain, affects a human-rat-mouse conserved binding motif, which is a COUP-TF binding site. Since the resistance (Cop) allele is associated with increased Nr2f1 (Coup-tf1) transcript levels we hypothesize that the 14 bp deletion removes a repressive autoregulatory module of Nr2f1 communicating with its own promoter. Since the MD mutation of the entire locus profoundly downregulates Nr2f1 transcript levels, the entire region is acting as a strong enhancer. Thus, we propose that in the susceptible strain harboring the WF allele with the intact COUP-TF binding motif, the repressive autoregulatory mechanism may modulate Nr2f1 transcription in the context of the activity of the enhancer. A germ-line mutation in the orthologous binding motif is not known to exist in mice or humans. Other variants outside of the conserved element (perhaps located in closer genomic proximity to the NR2F1 promoter) may confer similar NR2F1 regulation and thus potentially associate with breast cancer risk.
By taking advantage of the available congenic rat and genetic mouse models, we focused on dissecting the mechanisms underlying the non-protein coding Mcs1a locus on the organismal level. Because of the mammary cell-autonomous mechanism and change in mammary Nr2f1 transcript levels, we looked for differences in MEC biology between susceptible and resistant Mcs1a congenic rats. We found in a limiting dilution RMEC transplantation assay for repopulation ability that mammary stem cell activity is not affected by Mcs1a. Next, we tested the proliferation potential of a specific clonogenic population of RMECs. Clonogenic RMECs have previously been described to stain brightly with peanut lectin (PNL) and to be mostly located within the luminal population [25], [26]. In this study, we show that the luminal clonogenic RMEC population with colony-forming ability in Matrigel is indeed marked by bright PNL staining and not by high CD61 expression, which was shown to enrich for luminal progenitor cells with colony-forming ability in the mouse mammary gland [22]. In later studies, c-kit and ALDH have been identified as more specific markers for luminal progenitor cell populations, illustrating the heterogenity of the luminal MEC population [23], [24]. In the future, these markers can be tested on RMECs in combination with PNL staining to pinpoint the rat luminal progenitor population, provided good antibodies are available for the rat. Interestingly, the colony-forming ability of the luminal PNLhi population was found to be reduced in animals carrying the Mcs1a resistance allele, as compared with susceptible controls. As determined by multiparameter FACS analysis of freshly isolated RMECs, the abundance of PNLhi and luminal PNLhi cells among CD31–CD45 − RMECs was not significantly different. Hence, we concluded that the proliferation potential of the colony-forming luminal population is affected by Mcs1a. The FACS analysis, however, did reveal a RMEC differentiation phenotype associated with Mcs1a. Resistant congenic animals have a higher abundance of luminal and lower abundance of basal RMECs, as compared with susceptible congenic control animals. Basal RMEC are mainly characterized by high β1-integrin (CD29) expression and loss of β1-integrin in the mouse mammary gland impairs mammary cancer development [64], suggesting that lower abundance of basal RMECs in the resistant Mcs1a congenics may contribute to lower mammary carcinoma susceptibility. Interestingly, in both the Mcs1a congenic rat model and genetically engineered mouse model, higher expression of Nr2f1 in the mammary gland is associated with higher abundance of luminal MMECs, identifying Nr2f1 as a candidate MEC differentiation gene modulating luminal cell fate. Since in the MD mouse model the abundance of mature luminal cells was significantly affected, and the abundance of luminal progenitors and basal cells were not, we propose that the Mcs1a-associated locus may impact luminal cell fate through activities in the luminal progenitors. Several other genes have been shown to regulate luminal cell fate mainly through activities in luminal progenitors. Downregulation of Gata-3 and upregulation of FoxM1 have been demonstrated to lead to impaired luminal cell differentiation [22], [65]. Interestingly, we found the transcript level of FoxM1 significantly upregulated in the MD mammary gland samples, whereas the Gata3 transcript level was not affected (Table S4). FoxM1 is predicted not to have a COUP-TF binding motif in its vicinity, thus the exact relationship of FoxM1 and Nr2f1 transcript levels remains to be investigated.
NR2F1 is an orphan nuclear receptor of the steroid hormone receptor superfamily [66]. Homodimers of NR2F1 bind the DR1 (direct repeats with 1 spacer) motif with the highest affinity [67]. NR2F1 is thought to act as a transcriptional repressor [68], [69], but can activate target genes as well [70], [71]. Nr2f1 has been previously recognized as an important factor in the development of the mouse nervous system [72], [73], [74] and the inner ear [75], [76]. Interestingly, ectopic Nr2f1 expression in the developing telencephalon and knockdown of Nr2f1 in primary neurospheres have been shown to result in defect neuronal cell fate determination [77], [78], suggesting that Nr2f1 may function as a neuronal as well as a MEC differentiation gene. The MD mice generated in this study have normal bodyweight, lifespan, and startle response to finger flicking above the cage (to test for hearing loss), but do display a delayed eyelid opening phenotype. Delayed eyelid opening could be indicative of an eye development defect or an eyelid epidermal apoptotic defect [79]. Interestingly, Nr2f1 has previously been implicated in eye development and was found to be highly expressed in progenitor cells of the developing eye [80], suggesting that the delayed eyelid opening phenotype in the MD mice is likely due to aberrant Nr2f1 expression in the differentiating eye progenitors.
There is a moderate amount of evidence that NR2F1 is involved in breast cancer, mainly through its cross-talk activities with the ER - [81], the arylhydrocarbon receptor - [82], and/or retinoic acid-mediated signaling [83]. Again, several studies emphasize NR2F1's dual role as a transcriptional repressor and activator, depending on the promoter its acting on and the cellular context, i.e. presence of other nuclear factors such as ER [84], [85]. We show in this paper that in all large human breast cancer gene expression studies examined, triple-negative (aggressive, therapy-resistant) and histological grade 3 (poorly differentiated, highly proliferative) breast cancers display lower NR2F1 transcript levels as compared with ‘receptor-positive’ and histological grade 1/2 breast cancers, respectively. This observation is in accordance with the mouse and rat MEC differentiation and mouse mammary gland gene expression studies that show reduced Nr2f1 transcript levels associated with less luminal differentiation and a more proliferative epithelial environment. Recently, NR2F1 was presented in a breast cancer dormancy gene signature as a gene upregulated in dormant cells [86]. Notably, in the same study, MCF7 cells with siRNA-mediated depletion of NR2F1, when injected into the mammary fat pad of immunosuppressed mice resulted in increased growth as compared with negative control siRNA-treated MCF7 cells [86]. Again, consistent with our findings, this result provides functional evidence that lower NR2F1 transcript levels increase the proliferative potential of breast cancer cells in an in vivo model system. In addition, we found in the MCF10A and MCF7 cell lines that siRNA-mediated reduction of NR2F1 transcript levels results in increased expression of CD24. CD24 has previously been implicated in breast cancer, for example as a marker for the breast cancer-initiating cell population [87]. Ectopic expression of CD24 in breast cancer cells has been shown to result in increased proliferation, as well as cell motility and invasion [88] and the expression of CD24 in breast carcinomas has been associated with poor prognosis [89].
It should be noted that according to available HER2 status classification in the human breast cancer gene expression studies, the more aggressive HER2-positive breast cancers (also associated with poorer clinical outcome) were found to express higher NR2F1 transcript levels, as compared with HER2-negative breast cancers (that are mostly ER-positive and less aggressive). In addition, we show for the GSE5460 gene expression data set that within both HER2 classes, histological grade 3 tumors have lower NR2F1 transcript levels as compared with grade 2 tumors. In this data set, the grade 3 tumors from the HER2-positive class have higher NR2F1 transcript levels as compared with grade 3 tumors from the HER2-negative class. We speculate that over expression of HER2 and subsequent stimulation of downstream signaling pathways increases NR2F1 transcript levels. The cellular effects of higher NR2F1 transcript levels may be very different for the amplified and unamplified HER2 backgrounds.
NR2F1 is located on human chromosomal band 5q15. Interestingly, a hotspot for copy number alterations (CNA) in breast cancer maps to chromosomal arm 5q [90], [91], with deletions most frequently occurring at 5q11-5q34 [92]. These CNA have been associated with high histological grade, basal-like tumors, p53-mutation status, triple-negative tumors, and tumors from BRCA1 carriers [90], [91], [93]. A recently published study describing comprehensive molecular portraits of human breast tumors identified the 5q deletion hotspot as a large trans-eQTL, as the expression levels of hundreds of genes across the genome are associated with occurrence of 5q deletions [93]. Interestingly, this study found the associated genes to enrich in GO categories involved in cell cycle processes, FoxM1 transcriptional regulation and proliferation, many of which are also found in our MD and WT RNA-seq study to be anti-correlated to Nr2f1 transcript levels. Placement of the Mcs1a-orthologous gene desert and NR2F1 within the deletion hotspot suggests that NR2F1 may play a role in deregulation of a fraction of these cell cycle-related genes associated with the triple-negative breast cancer-specific 5q deletions.
In summary, we describe the genetic dissection of the gene desert breast cancer susceptibility locus Mcs1a. We hypothesize that the resistance allele (from the Cop strain) carrying a truncated, potential transcriptionally suppressive COUP-TF (autoregulatory) binding motif, leads to increased Nr2f1 transcript levels in the mammary gland, which increases luminal RMEC differentiation and creates a less proliferative, more differentiated mammary epithelium with decreased mammary carcinoma susceptibility (Figure 8). We present NR2F1 as a strong candidate breast cancer susceptibility gene and MEC differentiation gene. In addition to a potential role in breast cancer susceptibility, we propose that reduced NR2F1 transcript levels associated with the human breast cancer 5q chromosomal deletions play a role in high-grade, poorly differentiated, proliferative breast cancer, including therapy-resistant triple-negative breast cancer. The human non-coding region orthologous to Mcs1a as well as NR2F1 are located on chromosomal band 5q in the region of frequent deletion. Raising NR2F1 transcript levels, or enhancing NR2F1's activities has great potential as a strategy to aid in breast cancer prevention or breast cancer intervention, including for triple-negative breast cancer (and possibly excluding HER2-positive breast cancer). As a steroid hormone receptor family member, NR2F1 potentially is an attractive therapeutic target. To our current knowledge NR2F1 is still an orphan nuclear receptor, which means a ligand has not been identified yet. Based on strong amino-acid conservation of the NR2F1 ligand binding domain (96%) with that of NR2F2, the crystal structure of the NR2F2 ligand binding domain suggests that NR2F1 may also be activated by retinoic acid through coactivator recruitment-based release of its autorepressed conformation [94]. Identification of ligand-mediated activator mechanisms for NR2F1 is important to begin to exploit its therapeutic potential in the near future.

Materials and Methods
Ethics statement
All animal protocols were approved by the University of Wisconsin School of Medicine and Public Health Animal Care and Use Committee.
Rats
The congenic rat lines were established and maintained in an AAALAC-approved facility as previously published [57]. Congenics are defined as genetic lines developed on a Wistar-Furth (WF; susceptible) genetic background and carrying the selected Copenhagen (Cop; resistant) Mcs1a alleles in homozygous fashion [33]. Resistant congenic lines with decreased susceptibility phenotypes (Q, R3, V4, W4, Y4, W5) carry Cop alleles that define the Mcs1a locus critical interval. The susceptible congenic lines (P5, V5, R5, A4, Y3) are WF-homozygous at the newly defined Mcs1a locus. The susceptible congenic control line (WF.Cop) was derived from congenic line W5 and is WF-homozygous for all Mcs1 loci. The primer sequences for the genetic markers polymorphic between the WF and Cop inbred parental stains that are used to define the congenic lines are listed in Table S1.
Carcinogenesis
Female rats, 7–8 weeks of age, were either orally gavaged with 7,12-dimethylbenz(a)anthracene (DMBA) at 65 mg/kg of body weight, injected intraperitoneally with N-nitroso-N-methylurea (MNU) at 50 mg/kg of body weight, or subjected to mammary ductal infusion of replication-defective retrovirus expressing the activated HER2/neu oncogene (HER2/neu) at a concentration of 1×10⁵ Colony Forming Units (CFU)/ml [34]. To obtain multiplicities, mammary carcinomas >3×3 mm were counted at 15 weeks post-DMBA, 15 weeks post-MNU, and 7 weeks post-HER2/neu treatment. Multiplicity data were statistically analyzed using Mann-Whitney nonparametric tests.
Mice
All mice are maintained in an AAALAC-approved facility. The megadeletion mice were produced in collaboration with the University of Wisconsin Biotechnology Center Transgenic Animal Facility (http://www.biotech.wisc.edu/facilities/transgenicanimal). MICER clones (MHPP256h04; MHPN5k06; Sanger Institute, UK) were obtained and the vectors were purified. To ensure proper directionality of the construct upon insertion, the genomic insert from vector MHPP256h04 was flipped by AscI digestion and religation. The vectors were prepared by creating a gap in the genomic insert, as efficient targeting using MICER vectors relies on the embryonic stem (ES) cell's gap repair mechanism [95]. AB2.2 (HPRT deficient) ES cells from the 129/SvEv strain were transfected by electroporation in the presence of a linear gap-containing MICER vector. The first electroporation was done in the presence of the (flipped) gap-containing MHPP256h04 vector. Puromycin-resistant ES cell clones were expanded and checked for proper targeting by Southern blot analysis (Figure S1). Following karyotyping, karyotypically normal clones were selected and expanded for targeting with the second MICER vector. After electroporation in the presence of the gap-containing MHPN5k06 vector, neomycin-resistant clones were expanded and checked for proper targeting by Southern blot analysis. A karyotypically normal doubly targeted ES cell clone was expanded. To excise the 535 Kb region (megadeletion, MD) between the loxP sites present in both inserted vectors, a Cre-recombinase expressing vector (pTurbo-Cre) was introduced through electroporation. As proper Cre-loxP recombination restores the functional HPRT gene [95], hypoxanthine/aminopterin/thymidine (HAT) resistant clones were expanded and checked for recombination by PCR using 2 primer combinations spanning the deletion (mmMICERdel:TGTCTAGAGCTTGGGCTGCAG mmMICERdel:AGACAGAATGCTATGCAACCT and Del2F:CATGGACTAATTATGGACAGG Del2R:CTCCTTCATCACATCTCGAGC). Karyotypically normal ES cell clones were monodispersed and microinjected into C57Bl/6 blastocysts to produce chimeric founders. After germ line establishment, the MD mutation was introgressed onto the FVB/N and C57Bl/6 inbred genetic backgrounds for >10 generations. Deletion of the 535 Kb region was further verified by PCR using 4 primer combinations within the deleted sequence (mmdelNeg:TGGACTTGATGTGCTCCTTG mmdelNeg:TGCCATCAATGAGTTTGAGG, 2F:AAGTGAAAGATGCTGACATTTCC 2R:AAGACTGAATTCTTGCCACTCAC, 3F:GGGAGCCATTTATCACAGTCCTA 3R:GACCCTCACAAAAGCTGGTTTA, 4F:ACACATTTGGAGATGCAAACAG 4R:CACAAAAGTCACCTAAAAGGATCA). Examples of genotyping images for primers mmMICERdel and mmdelNeg are shown in Figure S1.
Mammary gland transplantation
Females from the susceptible (S) inbred strain WF, the resistant (R) congenic line Y4, and WFxY4 or Y4×WF intercross (F1) were used. Donor mammary glands with lymph nodes (LN) excised (both abdominal and adjacent inguinal glands) from 30–35 day old females were finely minced over ice and divided into four equal volumes. One volume was transplanted onto the interscapular white fat pad of each 30–35 day old recipient (1 donor/4 recipients). Three weeks after transplantation, all recipients were treated with DMBA. At 15 weeks post-DMBA, interscapular fat pads were examined for carcinoma development. In addition, each fat pad was whole mounted and stained with aluminum carmine to verify mammary gland establishment. As only 15 out of 228 rats developed multiple carcinomas in the transplant sites, the mammary carcinoma incidence data were analyzed as a binary response by logistic regression. The four transplant groups (S:S, S:F1, R:F1, R:R) form a 2×2 factorial design with donor and recipient genotypes as the main effects. Standard logistic regression was applied to the binary response data with two main effects and an interaction term.
Quantitative real-time PCR
Female rats (11 weeks of age) of the susceptible congenic line WF.Cop (susc.) and resistant congenic lines W4 and W5 (res.), or female MD and WT mice (9 weeks of age; FVB) were used as tissue donors. RNA was extracted from snap-frozen mammary gland and mammary carcinoma tissues, from fresh RMEC samples, or from siRNA-treated human cell line samples. To synthesize cDNA from 800 ng of TURBO-free DNaseI-treated total RNA, the reverse transcriptase Superscript II kit (Invitrogen) was used according to manufacturer's directions. Quantitative real-time PCR was used to quantify transcript levels. TaqMan quantitative PCR primers and probes were ordered as premade assays (ABI/Applied Biosystems): rat Nr2f1 Rn01489978_m1 (FAM), mouse Nr2f1 Mm01354342_m1 (FAM), human NR2F1 Hs00818842_m1 (FAM), rat ActB Rn00667869_m1 (VIC, endogenous control), mouse ActB Mm00607939_s1 (VIC, endogenous control) and human GAPDH Hs03929097_g1(VIC, endogenous control). Reactions were run as described previously [96]. Quantities of transcripts were measured by comparison of Ct values with a standard curve calculated from serial dilutions made from reverse transcriptase reactions that contained 2 µg of total RNA. Sample measurements are an average of three or four replicates within 0.5 Ct value. Sample measurements were normalized by dividing the gene specific transcript quantity over the endogenous control quantity. For each sample, the ratio was scaled to the average ratio of the control group from the same experiment, which are the susceptible congenic control group (rat), the WT group (mouse) or the siCONTROL-treated group (human cell lines). Data were analyzed using Mann-Whitney nonparametric tests.
RNA-seq
RNA was extracted from snap-frozen mammary gland tissue from MD and WT mice (FVB) using the MagMax-96 Total RNA isolation kit (Ambion) according to manufacturer's directions. RNA samples were checked for integrity using Agilent 2100 Bioanalyzer. Two RNA samples were pooled using 5 µg of each for 10 µg of total RNA per library preparation sample. Sample preparation and next-generation sequencing was done at the University of Wisconsin Biotechnology Center Gene Expression Center. Sample preparation was done using the Rev.D mRNA sample preparation kit (Illumina), according to the manufacturer's recommendations. Samples were run on the Illumina GAIIx. Reads that made the quality cut-off were aligned to the mouse Ensembl set of 82,508 transcripts (http://genome.ucsc.edu) using Bowtie (v0.12.3; http://bowtie-bio.sourceforge.net/index.shtml) with the following settings: -f –v 1 −3 0 –a –m 100. Transcript levels were estimated using the RSEM algorithm [37]. Differential expression between the MD and WT samples was determined using edgeR [38]. Correlation analysis of gene expression was done on the 1,531 DE mouse genes and 412 DE mouse genes with 1-1-1 mouse-rat-human Affy (U133a probe set) orthologues. The Pearson correlation between the mean-centered RSEM tau expression values was calculated and visualized in R using the gplots library. Similar correlation analysis was done on the 412 human orthologous genes for which microarray data (Affy U133a) was available from a human breast cancer gene expression study. For this analysis, the GSE3494 dataset was downloaded from the Gene Expression Omnibus (GEO; www.ncbi.nlm.nih.gov/geo). The raw data was normalized using the RMA approach in R [97]. The online functional annotation tools GOrilla (http://cbl-gorilla.cs.technion.ac.il) and DAVID (http://david.abcc.ncifcrf.gov) were used to find Gene Ontology (GO) categories and biological processes enriched with DE genes [43], [44]. For the 412 DE mouse-rat-human orthologs genes analysis, the full mouse-rat-human orthologues gene list (9,828 genes, Table S5, S6) was used as the background list.
Chromosome Conformation Capture (3C) assay
Templates were prepared from isolated RMECs from 6 animals of the susceptible congenic control line WF.Cop and 6 animals from the Mcs1a resistant congenic line, as described previously [96]. The restriction enzyme of choice was BglII. The fixed primer was chosen to be located in the predicted promoter of the Nr2f1 gene. The experimental primers were chosen to be located within the Mcs1a critical interval, biased towards regions of evolutionary sequence conservation (Figure 3d). Primer sequences are listed in Table S2. The relative interaction frequency for each experimental primer in combination with the fixed primer was determined for each sample as the average of 3 replicate measurements divided by the average of a positive control (BAC-derived) template run in the same PCR plate [96]. A non-parametric Mann-Whitney test was performed to test for differences between genotypes. Since no genotype differences were detected, data for the Mcs1a profile were taken from all samples. Next, non-parametric Krukal-Wallis tests were performed to test for increased (P<0.05) interaction frequency of a primer pair above the background levels. The interaction frequencies of peak fragments were tested against interaction frequencies below two background cut-offs, namely 0.05 and 0.1.
Resequencing
Genomic DNA was isolated from spleens of inbred WF and Cop rats using phenol and chloroform extractions. A total of 10 ng of genomic DNA was used in each PCR reaction. Primers were designed using Primer3 software and are listed in Table S3. Successful PCR reactions as verified by agarose gel electrophoresis were diluted 6 times. Of this dilution, 1 µl was used in a BigDye sequencing reaction in a total volume of 15 µl, according to the vendor's (Applied Biosystems) specifications with the exception that we used 0.7 µl BigDye enzyme mix. Sequencing reactions were cleaned-up using the CleanSeq kit (Agencourt) and submitted for sequencing through the UW Biotechnology DNA Sequencing Facility. Reads were visualized using 4Peaks software (Meckentosj) and scanned for mutations using BLAT (UCSC Genome Browser).
FACS analysis of monodispersed rat and mouse MECs
Rat and mouse mammary epithelial cells (RMECs and MMECs) were prepared from LN-excised abdominal and adjacent inguinal mammary glands, as described previously [25], [42]. For phenotyping RMECs and MMECs, staining was done using the low-volume staining method to reduce antibody costs [42]. To stain the single RMECs, antibodies against rat CD49f (Santa Cruz), CD24, CD29, CD31, CD45, and CD61 (BD Biosciences) or peanut lectin (Sigma) were used. To stain MMECs, antibodies against mouse CD24, CD29, CD31, CD45, CD49f, and CD61 (BD Biosciences) were used. Live cells were gated based on FSC, SSC, and Hoechst staining for 2n–4n DNA content. Single cells were gated using forward scatter (FSC) and side scatter (SSC) width. For phenotyping, the stained samples were acquired on a BD LSR II flow cytometer equipped with 4 lasers (multi-line UV, 405 nm, 488 nm and 633 nm). The data were collected as fcs3 files using FACS Diva software and analyzed using FlowJo software (Treestar Inc). Data files obtained from cell samples stained with single antibodies and control unstained cell samples were used for compensation. Data on percentages of cells in various gated populations or mean fluorescence intensities of entire populations were exported and statistically analyzed using Student's t-test.
For RMEC sorting, 50–70 million single cells were stained with anti-rat CD24, CD29, CD31, CD45, CD61 and peanut lectin at a concentration recommended by the vendor's specifications. Sorting was done on a BD FACSAria flow cytometer equipped with 5 lasers (multi-line UV, 405 nm, 488 nm, 540 nm and 640 nm). Cells were collected in 50% FBS.
RMEC transplantation and matrigel assays
We have previously shown that the clonogenic cells assayed in our transplant system are capable of dividing and differentiating into morphologically and functionally normal mammary parenchyma [41]. For this RMEC transplantation assay, donor and recipients from the susceptible congenic control line WF.Cop and Mcs1a resistant congenic lines W4 and W5 were used. The final dilutions of single RMECs were mixed with an equal volume of a 50% brain homogenate, which was extracted from the donor rats. Aliquots of 40 µl of the mixture containing a known number of cells were then injected into the interscapular fat pad of recipient animals of the same genotype. The frequency of viable clonogenic stem-like cells in a cell suspension was quantitated using a limiting dilution assay as previously described [98], [99]. In each rat, two sites were used for grafting. For each cell dilution, between 8 and 32 sites were transplanted per genotype. Recipient rats were sacrificed 6 weeks after mammary cell grafting, and the fat pads injection sites were removed, fixed, stained, and examined for the growth of mammary tissue. The percentages of transplant sites with a mammary outgrowth were then plotted against the number of cells injected per site. The data were fit to the transplantation model of Porter et al. [100] and according to the statistical methodology for this model there was no significant difference between any of the 3 groups in the estimated number of cells required to give 50% outgrowth occurrence. For display purposes, the data for transplant sites from congenic lines W4 and W5 were combined and plotted in Figure 4A as a single line for the resistant genotype. A second statistical approach was taken to detect a possible difference in outgrowths at each cell number individually between the susceptible and resistant (W4 and W5 combined) genotypes. Therefore, Chi-square tests for independent distributions in a 2×2 contingency matrix were conducted for comparing susceptible to resistant for each cell number. The P-values were adjusted for multiple comparisons.
For the matrigel assay, single sorted RMEC suspensions containing 10,000 cells were spun 450× g for 5 minutes at 4°C. Supernatant was discarded, the cell pellet was resuspended in 100 uL phenol red free Matrigel (BD Biosciences) and immediately plated in 12 - or 24-well plates while on ice. Plates were placed at 37°C (with 5% CO2) for 30–60 minutes to allow gelling process. Mammary Epithelial Cell Medium (PromoCell) with 5% bovine calf serum and antibiotics was then added to the wells containing the sorted cells in matrigel. Fresh media was provided on days 2 and 5. On day 10, Matrigel containing RMEC colonies was fixed with 2% paraformaldehyde in phosphate buffer pH 7.4 (PB) for 30 minutes at 37°C followed by staining with 0.5% methylene blue in PB for 5 minutes at 37°C. Colonies were counted using a microscope. Count data were normalized to the average colony count of the susceptible congenic control line run in the same experiment and was statistically analyzed using Student's t-test.
Cell culture and transfection
MCF10A and MCF7 cell lines were obtained (ATCC) and cultivated according to the manufacturer's recommendations. Transient transfections were done in 24-well plates using the Lipofectamin2000 reagent (Invitrogen). Short interfering RNAs (NR2F1 SMARTpool and Non-targeting pool) were obtained (Dharmacon) and used at a final concentration of 125 nM in the transfection media. The transfection media was washed off the cells after 6 hours. The cells were cultured for 40 additional hours before harvesting for FACS and expression analysis.
NR2F1 transcript levels in human breast cancer data sets
The Oncomine database (www.oncomine.org) was queried using the following filters: Gene: NR2F1, Cancer Type: Breast carcinoma, Sample Type: Clinical Specimen. Only studies with 120+ samples were considered. If available, the median levels of NR2F1 for the clinical parameters, histological grade, ER-status, PR-status, HER2-status, TN-status were entered in Excel. To be able to compare clinical parameters across studies, the median levels for each clinical parameter in a study were normalized by the median level for the entire study. The average of the normalized median values was plotted. For statistical analysis, the non-parametric Kruskal-Wallis test was used.
To ask if lower NR2F1 levels are associated with histological grade 3 in both ER-positive and ER-negative breast cancers or HER2-positive and HER2-negative breast cancers, the RMA normalized NR2F1 probe set levels (probe ID 209505_at) from the GSE3494 and GSE5460 studies were used, respectively. To match the Y-axis scale in panel A, the RMA normalized values were expressed relative to the median level for the entire study. The values were statistically compared between groups using the non-parametric Mann-Whitney U test.
Supporting Information
Zdroje
1. AntoniouAC, EastonDF (2006) Models of genetic susceptibility to breast cancer. Oncogene 25 : 5898–5905.
2. MikiY, SwensenJ, Shattuck-EidensD, FutrealPA, HarshmanK, et al. (1994) A strong candidate for the breast and ovarian cancer susceptibility gene BRCA1. Science 266 : 66–71.
3. WoosterR, BignellG, LancasterJ, SwiftS, SealS, et al. (1995) Identification of the breast cancer susceptibility gene BRCA2. Nature 378 : 789–792.
4. AhmedS, ThomasG, GhoussainiM, HealeyCS, HumphreysMK, et al. (2009) Newly discovered breast cancer susceptibility loci on 3p24 and 17q23.2. Nat Genet 41 : 585–590.
5. EastonDF, PooleyKA, DunningAM, PharoahPD, ThompsonD, et al. (2007) Genome-wide association study identifies novel breast cancer susceptibility loci. Nature 447 : 1087–1093.
6. FletcherO, JohnsonN, GibsonL, CouplandB, FraserA, et al. (2008) Association of genetic variants at 8q24 with breast cancer risk. Cancer Epidemiol Biomarkers Prev 17 : 702–705.
7. FletcherO, JohnsonN, OrrN, HoskingFJ, GibsonLJ, et al. (2011) Novel breast cancer susceptibility locus at 9q31.2: results of a genome-wide association study. J Natl Cancer Inst 103 : 425–435.
8. GhoussainiM, FletcherO, MichailidouK, TurnbullC, SchmidtMK, et al. (2012) Genome-wide association analysis identifies three new breast cancer susceptibility loci. Nat Genet 44 : 312–318.
9. HunterDJ, KraftP, JacobsKB, CoxDG, YeagerM, et al. (2007) A genome-wide association study identifies alleles in FGFR2 associated with risk of sporadic postmenopausal breast cancer. Nat Genet 39 : 870–874.
10. StaceySN, ManolescuA, SulemP, RafnarT, GudmundssonJ, et al. (2007) Common variants on chromosomes 2q35 and 16q12 confer susceptibility to estrogen receptor-positive breast cancer. Nat Genet 39 : 865–869.
11. StaceySN, ManolescuA, SulemP, ThorlaciusS, GudjonssonSA, et al. (2008) Common variants on chromosome 5p12 confer susceptibility to estrogen receptor-positive breast cancer. Nat Genet 40 : 703–706.
12. ThomasG, JacobsKB, KraftP, YeagerM, WacholderS, et al. (2009) A multistage genome-wide association study in breast cancer identifies two new risk alleles at 1p11.2 and 14q24.1 (RAD51L1). Nat Genet 41 : 579–584.
13. TurnbullC, AhmedS, MorrisonJ, PernetD, RenwickA, et al. (2010) Genome-wide association study identifies five new breast cancer susceptibility loci. Nat Genet 42 : 504–507.
14. ZhengW, LongJ, GaoYT, LiC, ZhengY, et al. (2009) Genome-wide association study identifies a new breast cancer susceptibility locus at 6q25.1. Nat Genet 41 : 324–328.
15. WacholderS, HartgeP, PrenticeR, Garcia-ClosasM, FeigelsonHS, et al. (2010) Performance of common genetic variants in breast-cancer risk models. N Engl J Med 362 : 986–993.
16. van ZitterenM, van der NetJB, KunduS, FreedmanAN, van DuijnCM, et al. (2011) Genome-based prediction of breast cancer risk in the general population: a modeling study based on meta-analyses of genetic associations. Cancer Epidemiol Biomarkers Prev 20 : 9–22.
17. MeyerKB, MaiaAT, O'ReillyM, TeschendorffAE, ChinSF, et al. (2008) Allele-specific up-regulation of FGFR2 increases susceptibility to breast cancer. PLoS Biol 6: e108.
18. SunC, OlopadeOI, Di RienzoA (2010) rs2981582 is associated with FGFR2 expression in normal breast. Cancer Genet Cytogenet 197 : 193–194.
19. VisvaderJE (2009) Keeping abreast of the mammary epithelial hierarchy and breast tumorigenesis. Genes Dev 23 : 2563–2577.
20. ShackletonM, VaillantF, SimpsonKJ, StinglJ, SmythGK, et al. (2006) Generation of a functional mammary gland from a single stem cell. Nature 439 : 84–88.
21. StinglJ, EirewP, RicketsonI, ShackletonM, VaillantF, et al. (2006) Purification and unique properties of mammary epithelial stem cells. Nature 439 : 993–997.
22. Asselin-LabatML, SutherlandKD, BarkerH, ThomasR, ShackletonM, et al. (2007) Gata-3 is an essential regulator of mammary-gland morphogenesis and luminal-cell differentiation. Nat Cell Biol 9 : 201–209.
23. ReganJL, KendrickH, MagnayFA, VafaizadehV, GronerB, et al. (2012) c-Kit is required for growth and survival of the cells of origin of Brca1-mutation-associated breast cancer. Oncogene 31 : 869–883.
24. ShehataM, TeschendorffA, SharpG, NovcicN, RussellA, et al. (2012) Phenotypic and functional characterization of the luminal cell hierarchy of the mammary gland. Breast Cancer Res 14: R134.
25. SharmaD, SmitsBM, EichelbergMR, MeilahnAL, MuelblMJ, et al. (2011) Quantification of epithelial cell differentiation in mammary glands and carcinomas from DMBA - and MNU-exposed rats. PLoS One 6: e26145.
26. KimND, CliftonKH (1993) Characterization of rat mammary epithelial cell subpopulations by peanut lectin and anti-Thy-1.1 antibody and study of flow-sorted cells in vivo. Exp Cell Res 207 : 74–85.
27. RudlandPS (1992) Use of peanut lectin and rat mammary stem cell lines to identify a cellular differentiation pathway for the alveolar cell in the rat mammary gland. J Cell Physiol 153 : 157–168.
28. LimE, VaillantF, WuD, ForrestNC, PalB, et al. (2009) Aberrant luminal progenitors as the candidate target population for basal tumor development in BRCA1 mutation carriers. Nat Med 15 : 907–913.
29. BaiF, SmithMD, ChanHL, PeiXH (2012) Germline mutation of Brca1 alters the fate of mammary luminal cells and causes luminal-to-basal mammary tumor transformation. Oncogene [Epub ahead of print] doi: 10.1038/onc.2012.293
30. DrinkwaterNR, GouldMN (2012) The Long Path from QTL to Gene. PLoS Genet 8: e1002975.
31. HsuLC, KennanWS, ShepelLA, JacobHJ, SzpirerC, et al. (1994) Genetic identification of Mcs-1, a rat mammary carcinoma suppressor gene. Cancer Res 54 : 2765–2770.
32. ShepelLA, LanH, HaagJD, BrasicGM, GheenME, et al. (1998) Genetic identification of multiple loci that control breast cancer susceptibility in the rat. Genetics 149 : 289–299.
33. HaagJD, ShepelLA, KolmanBD, MonsonDM, BentonME, et al. (2003) Congenic rats reveal three independent Copenhagen alleles within the Mcs1 quantitative trait locus that confer resistance to mammary cancer. Cancer Res 63 : 5808–5812.
34. WoditschkaS, HaagJD, WallerJL, MonsonDM, HittAA, et al. (2006) Neu-induced retroviral rat mammary carcinogenesis: a novel chemoprevention model for both hormonally responsive and nonresponsive mammary carcinomas. Cancer Res 66 : 6884–6891.
35. DunhamI, KundajeA, AldredSF, CollinsPJ, DavisCA, et al. (2012) An integrated encyclopedia of DNA elements in the human genome. Nature 489 : 57–74.
36. LangmeadB, TrapnellC, PopM, SalzbergSL (2009) Ultrafast and memory-efficient alignment of short DNA sequences to the human genome. Genome Biol 10: R25.
37. LiB, DeweyCN (2011) RSEM: accurate transcript quantification from RNA-Seq data with or without a reference genome. BMC Bioinformatics 12 : 323.
38. RobinsonMD, McCarthyDJ, SmythGK (2010) edgeR: a Bioconductor package for differential expression analysis of digital gene expression data. Bioinformatics 26 : 139–140.
39. DekkerJ, RippeK, DekkerM, KlecknerN (2002) Capturing chromosome conformation. Science 295 : 1306–1311.
40. TolhuisB, PalstraRJ, SplinterE, GrosveldF, de LaatW (2002) Looping and interaction between hypersensitive sites in the active beta-globin locus. Mol Cell 10 : 1453–1465.
41. GouldMN, BielWF, CliftonKH (1977) Morphological and quantitative studies of gland formation from inocula of monodispersed rat mammary cells. Exp Cell Res 107 : 405–416.
42. SharmaD, EichelbergMR, HaagJD, MeilahnAL, MuelblMJ, et al. (2012) Effective flow cytometric phenotyping of cells using minimal amounts of antibody. Biotechniques 53 : 57–60.
43. EdenE, NavonR, SteinfeldI, LipsonD, YakhiniZ (2009) GOrilla: a tool for discovery and visualization of enriched GO terms in ranked gene lists. BMC Bioinformatics 10 : 48.
44. Huang daW, ShermanBT, LempickiRA (2009) Systematic and integrative analysis of large gene lists using DAVID bioinformatics resources. Nat Protoc 4 : 44–57.
45. MillerLD, SmedsJ, GeorgeJ, VegaVB, VergaraL, et al. (2005) An expression signature for p53 status in human breast cancer predicts mutation status, transcriptional effects, and patient survival. Proc Natl Acad Sci U S A 102 : 13550–13555.
46. WhitfieldML, GeorgeLK, GrantGD, PerouCM (2006) Common markers of proliferation. Nat Rev Cancer 6 : 99–106.
47. ReyalF, van VlietMH, ArmstrongNJ, HorlingsHM, de VisserKE, et al. (2008) A comprehensive analysis of prognostic signatures reveals the high predictive capacity of the proliferation, immune response and RNA splicing modules in breast cancer. Breast Cancer Res 10: R93.
48. DaiH, van't VeerL, LambJ, HeYD, MaoM, et al. (2005) A cell proliferation signature is a marker of extremely poor outcome in a subpopulation of breast cancer patients. Cancer Res 65 : 4059–4066.
49. HuZ, FanC, OhDS, MarronJS, HeX, et al. (2006) The molecular portraits of breast tumors are conserved across microarray platforms. BMC Genomics 7 : 96.
50. RhodesDR, YuJ, ShankerK, DeshpandeN, VaramballyR, et al. (2004) ONCOMINE: a cancer microarray database and integrated data-mining platform. Neoplasia 6 : 1–6.
51. NathansonKL, WeberBL (2001) “Other” breast cancer susceptibility genes: searching for more holy grail. Hum Mol Genet 10 : 715–720.
52. PharoahPD, AntoniouA, BobrowM, ZimmernRL, EastonDF, et al. (2002) Polygenic susceptibility to breast cancer and implications for prevention. Nat Genet 31 : 33–36.
53. MavaddatN, AntoniouAC, EastonDF, Garcia-ClosasM (2010) Genetic susceptibility to breast cancer. Mol Oncol 4 : 174–191.
54. SzpirerC, SzpirerJ (2007) Mammary cancer susceptibility: human genes and rodent models. Mamm Genome 18 : 817–831.
55. LanH, KendziorskiCM, HaagJD, ShepelLA, NewtonMA, et al. (2001) Genetic loci controlling breast cancer susceptibility in the Wistar-Kyoto rat. Genetics 157 : 331–339.
56. SamuelsonDJ, AperavichBA, HaagJD, GouldMN (2005) Fine mapping reveals multiple loci and a possible epistatic interaction within the mammary carcinoma susceptibility quantitative trait locus, Mcs5. Cancer Res 65 : 9637–9642.
57. SamuelsonDJ, HaagJD, LanH, MonsonDM, ShultzMA, et al. (2003) Physical evidence of Mcs5, a QTL controlling mammary carcinoma susceptibility, in congenic rats. Carcinogenesis 24 : 1455–1460.
58. SamuelsonDJ, HesselsonSE, AperavichBA, ZanY, HaagJD, et al. (2007) Rat Mcs5a is a compound quantitative trait locus with orthologous human loci that associate with breast cancer risk. Proc Natl Acad Sci U S A 104 : 6299–6304.
59. DendekkerAD, XuX, VaughnMD, PuckettAH, GardnerLL, et al. (2012) Rat Mcs1b is concordant to the genome wide association identified breast cancer risk locus at human 5q11.2 and MIER3 is a candidate cancer susceptibility gene. Cancer Res 72(22): 6002–12.
60. SmitsBM, SharmaD, SamuelsonDJ, WoditschkaS, MauB, et al. (2011) The non-protein coding breast cancer susceptibility locus Mcs5a acts in a non-mammary cell-autonomous fashion through the immune system and modulates T-cell homeostasis and functions. Breast Cancer Res 13: R81.
61. ViselA, ZhuY, MayD, AfzalV, GongE, et al. (2010) Targeted deletion of the 9p21 non-coding coronary artery disease risk interval in mice. Nature 464 : 409–412.
62. GeurtsAM, CostGJ, FreyvertY, ZeitlerB, MillerJC, et al. (2009) Knockout rats via embryo microinjection of zinc-finger nucleases. Science 325 : 433.
63. CuiX, JiD, FisherDA, WuY, BrinerDM, et al. (2011) Targeted integration in rat and mouse embryos with zinc-finger nucleases. Nat Biotechnol 29 : 64–67.
64. WhiteDE, KurpiosNA, ZuoD, HassellJA, BlaessS, et al. (2004) Targeted disruption of beta1-integrin in a transgenic mouse model of human breast cancer reveals an essential role in mammary tumor induction. Cancer Cell 6 : 159–170.
65. CarrJR, KieferMM, ParkHJ, LiJ, WangZ, et al. (2012) FoxM1 regulates mammary luminal cell fate. Cell Rep 1 : 715–729.
66. WangLH, TsaiSY, CookRG, BeattieWG, TsaiMJ, et al. (1989) COUP transcription factor is a member of the steroid receptor superfamily. Nature 340 : 163–166.
67. CooneyAJ, TsaiSY, O'MalleyBW, TsaiMJ (1992) Chicken ovalbumin upstream promoter transcription factor (COUP-TF) dimers bind to different GGTCA response elements, allowing COUP-TF to repress hormonal induction of the vitamin D3, thyroid hormone, and retinoic acid receptors. Mol Cell Biol 12 : 4153–4163.
68. ZhangLJ, LiuX, GafkenPR, KioussiC, LeidM (2009) A chicken ovalbumin upstream promoter transcription factor I (COUP-TFI) complex represses expression of the gene encoding tumor necrosis factor alpha-induced protein 8 (TNFAIP8). J Biol Chem 284 : 6156–6168.
69. DaiK, HussainMM (2012) NR2F1 disrupts synergistic activation of the MTTP gene transcription by HNF-4alpha and HNF-1alpha. J Lipid Res 53 : 901–908.
70. KuriharaI, ShibataH, KobayashiS, SudaN, IkedaY, et al. (2005) Ubc9 and Protein Inhibitor of Activated STAT 1 Activate Chicken Ovalbumin Upstream Promoter-Transcription Factor I-mediated Human CYP11B2 Gene Transcription. J Biol Chem 280 : 6721–6730.
71. SagamiI, TsaiSY, WangH, TsaiMJ, O'MalleyBW (1986) Identification of two factors required for transcription of the ovalbumin gene. Mol Cell Biol 6 : 4259–4267.
72. QiuY, PereiraFA, DeMayoFJ, LydonJP, TsaiSY, et al. (1997) Null mutation of mCOUP-TFI results in defects in morphogenesis of the glossopharyngeal ganglion, axonal projection, and arborization. Genes Dev 11 : 1925–1937.
73. ZhouC, QiuY, PereiraFA, CrairMC, TsaiSY, et al. (1999) The nuclear orphan receptor COUP-TFI is required for differentiation of subplate neurons and guidance of thalamocortical axons. Neuron 24 : 847–859.
74. ZhouC, TsaiSY, TsaiMJ (2001) COUP-TFI: an intrinsic factor for early regionalization of the neocortex. Genes Dev 15 : 2054–2059.
75. TangLS, AlgerHM, LinF, PereiraFA (2005) Dynamic expression of COUP-TFI and COUP-TFII during development and functional maturation of the mouse inner ear. Gene Expr Patterns 5 : 587–592.
76. TangLS, AlgerHM, PereiraFA (2006) COUP-TFI controls Notch regulation of hair cell and support cell differentiation. Development 133 : 3683–3693.
77. FaedoA, TomassyGS, RuanY, TeichmannH, KraussS, et al. (2008) COUP-TFI coordinates cortical patterning, neurogenesis, and laminar fate and modulates MAPK/ERK, AKT, and beta-catenin signaling. Cereb Cortex 18 : 2117–2131.
78. NakaH, NakamuraS, ShimazakiT, OkanoH (2008) Requirement for COUP-TFI and II in the temporal specification of neural stem cells in CNS development. Nat Neurosci 11 : 1014–1023.
79. SharovAA, WeinerL, SharovaTY, SiebenhaarF, AtoyanR, et al. (2003) Noggin overexpression inhibits eyelid opening by altering epidermal apoptosis and differentiation. Embo J 22 : 2992–3003.
80. TangK, XieX, ParkJI, JamrichM, TsaiS, et al. (2010) COUP-TFs regulate eye development by controlling factors essential for optic vesicle morphogenesis. Development 137 : 725–734.
81. KlingeCM, SilverBF, DriscollMD, SathyaG, BambaraRA, et al. (1997) Chicken ovalbumin upstream promoter-transcription factor interacts with estrogen receptor, binds to estrogen response elements and half-sites, and inhibits estrogen-induced gene expression. J Biol Chem 272 : 31465–31474.
82. KlingeCM, KaurK, SwansonHI (2000) The aryl hydrocarbon receptor interacts with estrogen receptor alpha and orphan receptors COUP-TFI and ERRalpha1. Arch Biochem Biophys 373 : 163–174.
83. TranP, ZhangXK, SalbertG, HermannT, LehmannJM, et al. (1992) COUP orphan receptors are negative regulators of retinoic acid response pathways. Mol Cell Biol 12 : 4666–4676.
84. MetivierR, GayFA, HubnerMR, FlouriotG, SalbertG, et al. (2002) Formation of an hER alpha-COUP-TFI complex enhances hER alpha AF-1 through Ser118 phosphorylation by MAPK. Embo J 21 : 3443–3453.
85. KlingeCM (1999) Role of estrogen receptor ligand and estrogen response element sequence on interaction with chicken ovalbumin upstream promoter transcription factor (COUP-TF). J Steroid Biochem Mol Biol 71 : 1–19.
86. KimRS, Avivar-ValderasA, EstradaY, BragadoP, SosaMS, et al. (2012) Dormancy signatures and metastasis in estrogen receptor positive and negative breast cancer. PLoS One 7: e35569.
87. Al-HajjM, WichaMS, Benito-HernandezA, MorrisonSJ, ClarkeMF (2003) Prospective identification of tumorigenic breast cancer cells. Proc Natl Acad Sci U S A 100 : 3983–3988.
88. BaumannP, CremersN, KroeseF, OrendG, Chiquet-EhrismannR, et al. (2005) CD24 expression causes the acquisition of multiple cellular properties associated with tumor growth and metastasis. Cancer Res 65 : 10783–10793.
89. AthanassiadouP, GrapsaD, GonidiM, AthanassiadouAM, TsipisA, et al. (2009) CD24 expression has a prognostic impact in breast carcinoma. Pathol Res Pract 205 : 524–533.
90. TirkkonenM, JohannssonO, AgnarssonBA, OlssonH, IngvarssonS, et al. (1997) Distinct somatic genetic changes associated with tumor progression in carriers of BRCA1 and BRCA2 germ-line mutations. Cancer Res 57 : 1222–1227.
91. BergamaschiA, KimYH, WangP, SorlieT, Hernandez-BoussardT, et al. (2006) Distinct patterns of DNA copy number alteration are associated with different clinicopathological features and gene-expression subtypes of breast cancer. Genes Chromosomes Cancer 45 : 1033–1040.
92. JohannsdottirHK, JonssonG, JohannesdottirG, AgnarssonBA, EerolaH, et al. (2006) Chromosome 5 imbalance mapping in breast tumors from BRCA1 and BRCA2 mutation carriers and sporadic breast tumors. Int J Cancer 119 : 1052–1060.
93. NetworkCGA (2012) Comprehensive molecular portraits of human breast tumours. Nature 490 : 61–70.
94. KruseSW, Suino-PowellK, ZhouXE, KretschmanJE, ReynoldsR, et al. (2008) Identification of COUP-TFII orphan nuclear receptor as a retinoic acid-activated receptor. PLoS Biol 6: e227.
95. AdamsDJ, BiggsPJ, CoxT, DaviesR, van der WeydenL, et al. (2004) Mutagenic insertion and chromosome engineering resource (MICER). Nat Genet 36 : 867–871.
96. SmitsBM, TraunBD, DevriesTL, TranA, SamuelsonD, et al. (2012) An insulator loop resides between the synthetically interacting elements of the human/rat conserved breast cancer susceptibility locus MCS5A/Mcs5a. Nucleic Acids Res 40 : 132–147.
97. IrizarryRA, BolstadBM, CollinF, CopeLM, HobbsB, et al. (2003) Summaries of Affymetrix GeneChip probe level data. Nucleic Acids Res 31: e15.
98. GouldMN, CliftonKH (1977) The survival of mammary cells following irradiation in vivo: a directly generated single-dose-survival curve. Radiat Res 72 : 343–352.
99. ZhangR, HaagJD, GouldMN (1991) Quantitating the frequency of initiation and cH-ras mutation in in situ N-methyl-N-nitrosourea-exposed rat mammary gland. Cell Growth Differ 2 : 1–6.
100. PorterEH, HewittHB, BlakeER (1973) The transplantation kinetics of tumour cells. Br J Cancer 27 : 55–62.
Štítky
Genetika Reprodukční medicínaČlánek vyšel v časopise
PLOS Genetics
2013 Číslo 6
Nejčtenější v tomto čísle
- BMS1 Is Mutated in Aplasia Cutis Congenita
- Sex-stratified Genome-wide Association Studies Including 270,000 Individuals Show Sexual Dimorphism in Genetic Loci for Anthropometric Traits
- Distinctive Expansion of Potential Virulence Genes in the Genome of the Oomycete Fish Pathogen
- Distinct Neuroblastoma-associated Alterations of Impair Sympathetic Neuronal Differentiation in Zebrafish Models