
N-Acetylglucosamine Induces White to Opaque Switching, a Mating Prerequisite in
To mate, the fungal pathogen Candida albicans must undergo homozygosis at the mating-type locus and then switch from the white to opaque phenotype. Paradoxically, opaque cells were found to be unstable at physiological temperature, suggesting that mating had little chance of occurring in the host, the main niche of C. albicans. Recently, however, it was demonstrated that high levels of CO2, equivalent to those found in the host gastrointestinal tract and select tissues, induced the white to opaque switch at physiological temperature, providing a possible resolution to the paradox. Here, we demonstrate that a second signal, N-acetylglucosamine (GlcNAc), a monosaccharide produced primarily by gastrointestinal tract bacteria, also serves as a potent inducer of white to opaque switching and functions primarily through the Ras1/cAMP pathway and phosphorylated Wor1, the gene product of the master switch locus. Our results therefore suggest that signals produced by bacterial co-members of the gastrointestinal tract microbiota regulate switching and therefore mating of C. albicans.
Published in the journal:
. PLoS Pathog 6(3): e32767. doi:10.1371/journal.ppat.1000806
Category:
Research Article
doi:
https://doi.org/10.1371/journal.ppat.1000806
Summary
To mate, the fungal pathogen Candida albicans must undergo homozygosis at the mating-type locus and then switch from the white to opaque phenotype. Paradoxically, opaque cells were found to be unstable at physiological temperature, suggesting that mating had little chance of occurring in the host, the main niche of C. albicans. Recently, however, it was demonstrated that high levels of CO2, equivalent to those found in the host gastrointestinal tract and select tissues, induced the white to opaque switch at physiological temperature, providing a possible resolution to the paradox. Here, we demonstrate that a second signal, N-acetylglucosamine (GlcNAc), a monosaccharide produced primarily by gastrointestinal tract bacteria, also serves as a potent inducer of white to opaque switching and functions primarily through the Ras1/cAMP pathway and phosphorylated Wor1, the gene product of the master switch locus. Our results therefore suggest that signals produced by bacterial co-members of the gastrointestinal tract microbiota regulate switching and therefore mating of C. albicans.
Introduction
The white-opaque transition in MTL-homozygous strains of Candida albicans affects cellular physiology, cell morphology, gene expression, virulence and biofilm formation [1]–[3]. It is repressed by the a1-α2 co-repressor in a/α cells and derepressed in cells that have undergone MTL-homozygosis to become either a/a or α/α [4]. White-opaque switching, which occurs spontaneously and reversibly, is controlled through expression of a master switch locus, WOR1, which also has been referred to as TOS9 [5]–[7]. The frequency of switching is regulated in part at the level of WOR1 transcription by a number of genes through a network of positive and negative regulatory loops [8],[9] and through changes in chromatin state [10]–[12].
After the discovery of a mating system in C. albicans [13], it was demonstrated that MTL-homozygous cells had to switch from white to opaque in order to mate [4],[14]. Paradoxically, it was demonstrated that in vitro this switch was sensitive to physiological temperature [15],[16]. When the temperature of opaque cell cultures grown at 25°C was raised to 37°C, cells switched en masse and semi-synchronously to white [17], suggesting that the opaque phenotype was unstable at physiological temperatures and that mating would, therefore, be compromised in a host, the major niche of C. albicans. Recently, we demonstrated that high levels of CO2 comparable to those found in the host gastrointestinal tract and some host tissues induced switching from white to opaque, maintained cells in the opaque phenotype, and blocked switching from opaque to white [18]. CO2 had been demonstrated previously to be a potent inducer of filamentation as well [19],[20]. Because N-acetylglucosamine (GlcNAc), which is produced by bacteria in the gastrointestinal tract [21], is also a potent inducer of filamentation [22], we therefore considered the possibility that it, like CO2, was an inducer of the white to opaque transition.
We found that G1cNAc represents a second strong inducer of the white to opaque transition and stabilizes the opaque phenotype. GlcNAc induction occurs at 25°C and is enhanced at 37°C. In addition, because there were indications that the induction of filamentation by GlcNAc was mediated by the Ras1/cAMP pathway [23]–[30], we tested whether G1cNAc induction of switching was regulated by this pathway. Our results demonstrate that GlcNAc induction is transduced primarily by the same Ras1/cAMP pathway that has been implicated in the regulation of filamentation and requires phosphorylated Wor1, the product of the master switch locus. We therefore suggest that two different signals in the host gastrointestinal tract, both produced by bacterial co-members of the gastrointestinal tract microbiota, can regulate the white to opaque transition, an essential step in C. albicans mating.
Results
GlcNAc Induction of Switching
To test whether GlcNAc induces the white to opaque transition and does so as a function of culture age, as is the case for the induction of filamentation [22],[24], white cells of a/a and α/α derivatives of strain SC5314, 5314a and 5314α, respectively, were first grown at 25°C in suspension in liquid modified Lee's medium in which glucose was the sole carbon source (“liquid glucose medium”) [31] (Figure 1A). To assess GlcNAc induction as a function of culture growth [23], cells were removed at time intervals from the liquid culture, plated on nutrient agar containing either 1.25% (w/v) glucose (“glucose agar”) or 1.25% (w/v) GlcNAc (“GlcNAc agar”) as the sole carbon source (Figure 1A), and incubated at 25°C. This temperature was selected to assess induction initially, because physiological temperature (37°C) induces the reverse switch from opaque to white [15],[17], and we wanted the initial assessment to be performed in the absence of reverse induction. After five days on agar, the proportion of opaque colonies plus white colonies with opaque sectors was measured in glucose or GlcNAc agar. This proportion will be referred to as the “switching frequency” for convenience, but should not be confused with the rate of switching [1],[16],[32]. Although a/a and α/α cultures reached different final cell densities, they entered the saturation phase in liquid glucose medium at approximately the same time (Figure 1B).

For a/a cells plated on glucose agar at 25°C, the switching frequency increased from 0.4±0.4% for cells taken from exponential phase cultures after one day, to 3.5±1.2% for cells taken from late saturation phase cultures after 10 days (Figure 1C, D). For α/α cells, the proportion increased similarly from 0.5±0.5% to 2.9±0.2% (Figure 1C, D). Hence, the switching frequency of a/a and α/α cells grown in liquid glucose medium increased 9.5 - and 6.0-fold, respectively, over the course of exponential growth and entrance into the saturation phase. For a/a cells plated on GlcNAc agar, the frequency of switching increased from 5.1±1.3% after one day to 88.7±4.9% after 10 days, and for α/α cells, the frequency increased from 7.3±3.4% to 92.5±3.3% (Figure 1C, D). Plating on GlcNAc agar, therefore, caused an increase in the frequency of switching of a/a and α/α cells after one day that was approximately 13 - and 15-fold higher, respectively, than the frequencies on glucose agar after one day (Figure 1C, D). After 10 days, the frequency was 25 - and 32-fold higher, respectively, than the frequency on glucose agar (Figure 1C, D). In Figure 1E, examples are presented of cultures from three day liquid glucose cultures of a/a cells plated on glucose agar or GlcNAc agar. Note that on GlcNAc agar, the majority of colonies were completely opaque rather than sectored, indicating that in these cases GlcNAc induction occurred very early in the life history of the colonies. Similar results were obtained for cells grown in liquid glucose medium for five days and plated on agar containing either glucose or GlcNAc ranging in concentration from 0.2% to 5% (w/v), indicating that the concentration employed (1.25%, w/v) resulted in maximum G1cNAc induction (data not shown).
GlcNAc Induction at 37°C
The preceding experiments were performed at 25°C. To test whether GlcNAc also induced white to opaque switching at physiological temperature (37°C), we then performed experiments in which white cells of a/a and α/α derivatives of strain SC5314 were grown to mid-log phase on liquid glucose medium for 48 hr at 25°C, then plated on glucose or GlcNAc agar at either 25 or 37°C. Increasing the temperature from 25 to 37°C on glucose agar resulted in a lower frequency of switching for white cells of both the a/a and α/α strains (Table 1, data in air). In direct contrast, when white cells of both strains were grown in liquid glucose medium at 25°C and then plated on GlcNAc agar at 37°C, there was a dramatic increase in the switching frequency (Table 1, data in air). These data demonstrate that physiological temperature enhances GlcNAc induction.

The Role of Ras1
The cAMP pathway, which plays a role in filamentation, includes Ras1, Cdc35, Pde2 and the protein kinase isoforms Tpk1 and Tpk2 [25]–[30]. To test whether GlcNAc induction of white to opaque switching was mediated by the cAMP pathway, we first analyzed the RAS1 deletion mutant, ras1/ras1. These experiments were performed at 25°C because a temperature of 37°C induced a portion of the cells of mutants of the Ras1/cAMP pathway to undergo filamentation (data not shown), making it difficult to assess switching from white to opaque at the level of cell phenotype. White cells of ras1/ras1 and the control strain (WT) were grown at 25°C in liquid glucose medium to saturation phase (seven days), plated on either glucose or GlcNAc agar, and analyzed for switching frequencies after five days at 25°C. The switching frequency on GlcNAc agar was 90.5±3.8% for WT cells, and 11.2±1.5% for ras1/ras1 cells (Figure 2A), indicating that Ras1 played a major, but not exclusive, role in GlcNAc induction. The frequency of switching of ras1/ras1 cells on GlcNAc agar was 9-fold lower than that of WT cells, and 16-fold higher than that on glucose agar (Figure 2A). Complementation of ras1/ras1 with RAS1 under the control of the MET3 promoter partially rescued the mutant phenotype in the activated state (Figure 2A). Rescue was incomplete due to the fact that RAS1 was controlled in the complemented strain by the MET3 rather than the natural promoter [7],[33]. It should also be noted that on glucose agar, the frequency of switching of WT cells was two-fold higher than that of ras1/ras1 cells (Figure 2A), indicating that a RAS1-dependent pathway also played a role in spontaneous switching on glucose agar.

To explore further the role of RAS1 in G1cNAc induction, we transformed strain WUM5A, a derivative of α/α strain WO-1, with RAS1V13, which encodes a constitutively activated form of Ras1 (Ras1V13 [25]) under the control of the MET3 promoter MET3p [33], to generate strain WT+MET3p-RAS1V13. The control strain was also transformed with the vector lacking the RAS1V13 to generate the control strain WT+vector. The addition of 2.5 mM methionine plus 2.5 mM cysteine (+Met, +Cys) represses MET3 promoter activity (the repressed state) and the absence (-Met, -Cys) activates it (the activated state) [33]. White cells of WT+METp-RAS1V13 and WT+vector were plated directly onto glucose agar in the presence or absence of methionine and cysteine at 25°C. In the repressed state (+Met, +Cys), the majority of colonies were white, with few sectors, but in the activated state (-Met, -Cys), nearly every colony was highly sectored (Figure 2B), indicating that overexpression of RAS1V13 in the absence of GlcNAc induced switching. Next, white cells of strains WT+vector and WT+METp-RAS1V13 were grown in liquid glucose medium in the repressed state for one day to the mid-exponential phase, then plated on either glucose or GlcNAc agar in the induced state. On glucose agar, the switching frequency of white WT+vector cells was 2.1±1.0%, and for the overexpression strain, 100% (Figure 2C). The majority of colonies of the overexpression mutant on glucose agar were highly sectored white colonies (Figure 2D). Only 2.3±1.2% were homogeneous opaque colonies. On GlcNAc agar, the switching frequency of control cells was 3.2±0.2%, while that of the overexpression mutant was 100% (Figure 2C). All of the latter colonies were homogeneously opaque (Figure 2D). The near uniformity of the opaque phenotype in the latter colonies was evident at the cellular level (Figure 2E). These results reinforce the conclusion that induction of white to opaque switching by GlcNAc is mediated primarily by Ras1.
The Role of cAMP
In the cAMP pathway that is involved in filamentation, Ras1 activates adenylate cyclase, which is encoded by CDC35 [26]. The resulting increase in cAMP is kept in check by a cAMP-phosphodiesterase, which is encoded by PDE2 [34],[35]. If GlcNAc induction of white-opaque switching is mediated by the same cAMP pathway, then deletion of CDC35 should reduce the effect, while deletion of PDE2 should enhance it. When white cdc35/cdc35 cells were grown at 25°C to saturation phase in liquid glucose medium (seven days) and then plated on GlcNAc agar, the frequency of switching was 8.0±3.5%, whereas that of the WT parental control was 86.9±4.3% (Figure 3A). Complementation of the mutant cdc35/cdc35 with CDC35 under control of the MET3 promoter partially rescued the mutant phenotype (Figure 3A). These results indicate that CDC35 is necessary for the major response to GlcNAc, as was the case for RAS1. GlcNAc did, however, induce low level switching in white cdc35/cdc35 cells, indicating that although CDC35 is necessary for the major response to GlcNAc, there is a minor response that is CDC35-independent, just as we observed there is a minor response that is RAS1-independent.
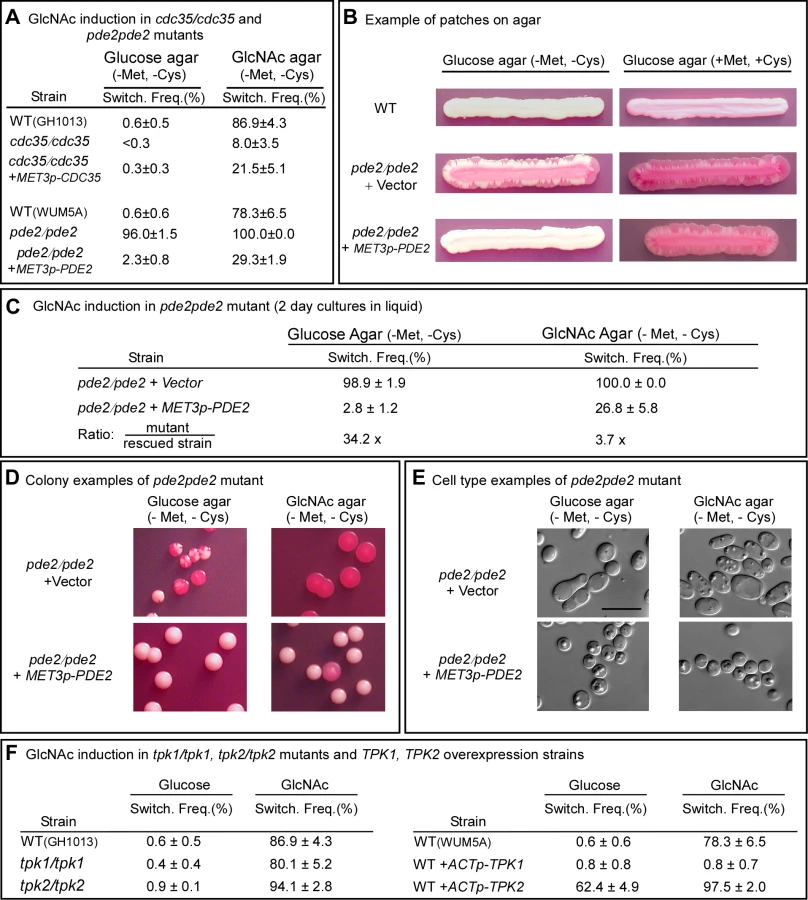
When white pde2/pde2 cells were grown at 25°C to saturation phase in liquid glucose medium (five days) and then plated on GlcNAc agar, the switching frequency was 100%, compared to 78.6±6.5% for control cells (Figure 3A). When plated on glucose agar, the frequency of switching was 96.0±1.5%, compared to 0.6±0.6 for WT cells (Figure 3A). Complementation of the pde2/pde2 mutant with PDE2 under the control of the MET3 promoter partially rescued the mutant phenotype (Figure 3A).
To explore further the role of Pde2 in switching, the deletion mutant pde2/pde2 was also transformed with a vector containing PDE2 under the control of the MET3 promoter to generate the strain pde2/pde2+MET3p-PDE2. The deletion mutant pde2/pde2 was transformed with the vector lacking PDE2 to generate the control strain pde2/pde2+vector. When white cells of the parental control (WT) were grown at 25°C as a streak on glucose agar lacking methionine and cysteine (activating conditions), only rare opaque sectors formed at the periphery (Figure 3B). When the mutant pde2/pde2+vector was streaked at 25°C, opaque sectors rimmed the entire streak (Figure 3B). In contrast, opaque sectors were absent at the periphery of the streak of the overexpression mutant pde2/pde2+MET3p-PDE under activating conditions (Figure 3B). When the overexpression mutant pde2/pde2+MET3p-PDE was grown at 25°C in liquid glucose medium under activating conditions to early exponential phase (two days), then plated on glucose agar at 25°C under activating conditions, the frequency of sectoring was 2.8±1.2%, compared to 98.9±1.9% for the deletion mutant (Figure 3C). When plated at 25°C on GlcNAc agar under activating conditions, the frequency of switching of the rescued strain was 26.8±5.8% compared to 100% for the mutant (Figure 3C). Examples of colonies of strain pde2/pde2+vector and pde2/pde2+MET3p-PDE grown at 25°C on glucose or GlcNAc agar under activating conditions are presented in Figure 3D, and examples of cells from these colonies are presented in Figure 3E. These results support the conclusion that cAMP is involved in the regulation of the GlcNAc response and that Pde2 plays the role of a negative regular.
The Role of the Protein Kinases
In the Ras1/cAMP pathway, cAMP activates protein kinase A (PKA) [27],[36]. In S. cerevisiae there are three PKA catalytic subunits, Tpk1, Tpk2 and Tpk3, which play roles in the cAMP pathway regulating pseudohypha formation [36],[37]. C. albicans possesses two isoforms, Tpk1 and Tpk2, which have been demonstrated to play functionally different roles in filamentation, depending upon environmental conditions [27],[38]. Consistent with previous reports [27], our lack of success in generating a double mutant of TPK1 and TPK2 suggested that this mutant may not be viable. We therefore analyzed the individual deletion mutants tpk1/tpk1 and tpk2/tpk2. White cells of the individual deletion mutants were grown at 25°C in liquid glucose medium to saturation phase (seven days) and then plated on glucose or GlcNAc agar and examined for switching after five days. Deletion of either TPK1 or TPK2 had no detectable effect on the frequency of switching on glucose or on GlcNAc agar (Figure 3F). There was, however, one noticeable difference in the GlcNAc-induced opaque colonies of tpk1/tpk1. They possessed a mixture of opaque cells and cells that had formed hyphae, suggesting that Tpk1 plays a role in the regulation of the bud-hyphae transition (data not shown).
Given that each of the alternative PKA isoforms may perform redundant function in the two mutants tpk1/tpk1 or tpk2/tpk2, we generated overexpression mutants in the wild type background WUM5A (WT) in which TPK1 or TPK2 was placed under the regulation of the strong constitutive ACT1 promoter [5]. White cells of the overexpression strains WT+ACTp-TPK1 and WT+ACTp-TPK2, as well as white cells of the control strain, were grown for five days at 25°C to saturation phase in liquid glucose medium and then plated on glucose or GlcNAc agar and examined after five days at 25°C for switching (Figure 1A). Overexpression of TPK1 had no effect on the switching frequency on glucose agar and actually suppressed switching on GlcNAc agar (Figure 3F). Overexpression of TPK2, however, caused a tenfold increase in the switching frequency on glucose agar over that of wild type cells and enhanced the frequency of switching by approximately 20% on GlcNAc agar (Figure 3F). These results suggested that in wild type cells, Tpk2 may function as the major downstream kinase in the GlcNAc induction pathway.
Ras1/cAMP Pathway at 37°C
At 37°C, GlcNAc induction was impaired in the mutants ras1/ras1 and cdc35/cdc35 (supplemental Table S1) but to a lesser extent than at 25°C. High temperature induction, however, reinforced our conclusion that it is Tpk2 that plays the crucial role in wild type cells in transducing GlcNAc induction. Whereas at 25°C GlcNAc induction was unaffected in tpk1/tpk1 and tpk2/tpk2, at 37°C it was reduced in the tpk2/tpk2, but not tpk1/tpk1 (supplemental Table S1). These results supported our conclusion based on overexpression data (Figure 3B-E) that Tpk2 plays a role in transducing GlcNAc induction in wild type cells.
The Role of WOR1
The WOR1 (TOS9) locus has been demonstrated to regulate spontaneous white-opaque switching [5]–[7]. It has been proposed that a stochastic increase in WOR1 expression above a threshold causes cells to switch from white to opaque, and that continued expression above that threshold maintains the opaque phenotype [5]–[7]. Wor1 has been shown to auto-induce at the level of transcription [5]–[7]. When activated, the cAMP pathway, which traditionally functions by cAMP-activation of protein kinase A, might increase the frequency of switching by phosphorylating either Wor1 or one of the several proteins that modulate WOR1 function through transcriptional regulatory loops [8],[9] or chromatin modification [10]–[12]. Interestingly, Wor1 possesses a single consensus PKA phosphorylation motif, between amino acids 64 and 69 with a phosphorylatable threonine at amino acid 67 [5].
To test whether Wor1 was essential for GlcNAc-activated switching, white cells of the parental strain (WT) and the WOR1 deletion mutant wor1/wor1 were grown at 25°C to saturation phase (seven days) in liquid glucose medium and then plated on nutrient agar containing glucose or GlcNAc at 25°C. The wor1/wor1 mutant did not switch on either glucose or GlcNAc agar (Figure 4A, B). Neither a single opaque colony or opaque sector was observed among more than 1,000 colonies. This was also true at 37°C (data not shown).

We then tested whether overexpression of WOR1 drove the phenotype to opaque in the ras1/ras1, pde2/pde2, cdc35/cdc35, tpk1/tpk1 and tpk2/tpk2 mutants by transforming these mutants with a construct in which WOR1 was under the regulation of the inducible MET3 promoter [33]. In the activated state, 100% of white cells of all five strains, when plated on either glucose or GlcNAc agar at 25°C, switched to opaque (Figure 4C). These results demonstrated that WOR1 is essential for the induction of switching by GlcNAc and that it plays a role downstream of the Ras1/cAMP pathway.
To test whether threonine phosphorylation is necessary for Wor1 function, the homozygous deletion mutant wor1/wor1 was transformed with the WOR1TA construct, in which the phosphorylatable threonine 67 residue was replaced with the nonphosphorylatable amino acid alanine and the construct placed under the control of the inducible tetracycline promoter (TETp) to generate strain wor1/wor1+TETp-WOR1TA. A control strain wor1/wor1+TETp-WOR1, was generated in which the mutant wor1/wor1 was transformed with a construct containing the native WOR1 ORF under the regulation of the tetracycline promoter. A second control strain, wor1/wor1+vector, was also generated in which wor1/wor1 was transformed with the vector lacking a WOR1 derivative. White cells of the three test strains were grown in liquid glucose medium at 25°C to saturation phase (five days) and then plated on glucose or GlcNAc agar at 25°C. Both the liquid and agar media contained either 50 or 200 µg per ml of the tetracycline analog doxycycline, which had been shown to induce submaximal and maximal levels of expression, respectively [39]. When native WOR1 was overexpressed both in glucose liquid medium and on glucose agar, the switching frequency was 100% at both 50 and 200 µg per ml of doxycycline (Figure 4D). When WOR1TA was overexpressed in both liquid glucose medium and then after plating on glucose agar at either 50 or 200 µg per ml of doxycycline, the frequency of switching was zero percent (Figure 4D). When native WOR1 was overexpressed in both GlcNAc liquid medium and then after plating on GlcNAc agar at 50 and 200 µg per ml of doxycycline, 100% of the colonies underwent switching (Figure 4D). At 200 µg per ml of doxycycline, over 70% of the cells in the opaque colonies exhibited the elongate opaque cell phenotype (Figure 4E). When WOR1TA was overexpressed in both GlcNAc liquid medium and then after plating on GlcNAc agar at 50 µg per ml of doxycycline, 0% of the colonies exhibited switching (Figure 4D). However, when WOR1TA was overexpressed in GlcNAc media at 200 µg per ml of doxycycline, 100% of the colonies were light pink (Figure 4D). Microscopic analysis revealed that 10% of the cells in these pink colonies exhibited the elongate opaque phenotype (Figure 4E). These results suggested that expression of the unphosphorylatable derivative of Wor1, Wor1TA, was capable of inducing switching, but with a 10-fold reduction in efficiency.
Because WOR1 and WOR1TA were fused in frame with GFP in the overexpression mutants, we used confocal microscopy to test whether Wor1TA localized normally to the nucleus and was expressed at the same level as Wor1. Both Wor1 and Wor1TA localized to the nucleus of a majority of cells of the overexpression mutants treated with doxycycline, as demonstrated by overlapping GFP fluorescence and staining with DAPI, a DNA indicator (Figure 5A). Moreover, GFP fluorescence of nuclei was qualitatively comparable for Wor1-GFP and Wor1TA-GFP (Figure 5A). These results demonstrated that although the replacement of threonine with alanine caused a dramatic decrease in its capacity to support switching, it did not affect nuclear localization or cause a decrease in the transcript level. The levels of the Wor1 and Wor1TA protein were then compared by western blot analysis using anti-GFP antibody. The levels of Wor1 and Wor1TA expressed in white cells of strains wor1/wor1+TETp-WOR1 and wor1/wor1+TETp-WOR1TA, respectively, treated with 200 µg per ml of doxycycline were similar (Figure 5B). These results indicate that the decrease in Wor1 function resulting from the replacement of threonine with alanine in the PKA consensus motif of Wor1 was due to a decrease in function, rather than to a decrease in the level of the Wor1 protein or mis-localization.

Low CO2 Enhances GlcNAc Induction
We had demonstrated that 1% CO2 induced switching submaximally and that at this concentration induction was dependent primarily upon the Ras1/cAMP signal transduction pathway [18]. We have shown here that GlcNAc induction was also submaximal when cells were grown for only two days in glucose liquid medium to mid-log phase (Figure 1C, D). We therefore tested whether cells growing at 25 or 37°C in a suboptimal concentration of CO2 (1%) and for a suboptimal period of time in glucose liquid medium enhanced GlcNAc induction. White cells of an a/a and an α/α strain were first grown at 25°C in glucose liquid medium in air for two days and then plated on either glucose or GlcNAc agar either in air or in air containing 1% CO2 at 25 or 37°C. On glucose agar in 1% CO2 at both temperatures, cells of the a/a and α/α strains exhibited switching frequencies that were significantly higher than in air alone (Table 1). When plated on GlcNAc agar in air at 25°C, the respective frequencies of the two strains were 26.7±1.2% and 22.4±3.3%, but at 37°C, they were 98.9±2% and 99.7±0.6%. However, when plated on GlcNAc agar in 1% CO2, the switching frequency at the two temperatures were 99 to 100% in both strains (Table 1). These results indicate synergy for CO2 and GlcNAc induction, and enhancement by physiological temperature.
Discussion
Recently, high CO2 was demonstrated to be a potent inducer of the white-opaque transition at 37°C [18]. The high concentrations of CO2 that induce and maintain the opaque phenotype at 37°C are found in select host tissues and in the gastrointestinal tract [40],[41]. The main source of CO2 in the gastrointestinal tract is the result of metabolism by colonic bacteria [40]. Here, we demonstrate GlcNAc, also a product primarily of bacteria that cohabit the host gastrointestinal tract with C. albicans [21]–[23],[42] represents a second potent inducer of the white to opaque transition.
By mutational analyses, we have found that the components of the Ras1/cAMP pathway, Ras1, Cdc35, Pde2 and PKA (Tpk1, Tpk2), mediate the major portion of GlcNAc induction. Our results also indicate that switching in glucose medium, which is at a far lower frequency than that in GlcNAc medium, is mediated in part by the Ras1/cAMP pathway. The low level of induction in deletion mutants of the Ras1/cAMP pathway is still approximately ten-fold higher than the level caused by glucose in wild type cells. Because the pathway that transduces high CO2 induction is also Ras1/cAMP-independent and unidentified, the possibility must be entertained that it may be the same Ras1/cAMP-independent pathway that mediates the minor portion of GlcNAc induction.
Our results, especially those at 37°C, suggest that the PKA isoform Tpk2 functions as the major downstream target of cAMP in the GlcNAc response pathway. Tpk1 appears to be capable of substituting for Tpk2 in the mutant tpk2/tpk2, but when overexpressed, inhibits GlcNAc-induced switching. One possible explanation is that the two Tpk isoforms play inhibiting and stimulating roles, respectively, in the white to opaque transition, especially in light of the fact that Efg1, a negative regulator of Wor1 [8], contains a PKA phosphorylation site. Tpk isoforms have been found to play different roles in the same regulatory networks in other systems. In S. cerevisiae, while Tpk2 activates filamentation downstream of cAMP in the glucose induced pathway, Tpk1 and Tpk3 inhibit filamentation by a feedback loop [36]. In addition, in the pheromone response pathway of C. albicans, the downstream MAP kinases Cek1 and Cek2 also play both distinct and overlapping roles [43], suggesting a general pattern of functional complexity of downstream protein kinase isoforms in signal transduction pathways.
Mutant analysis revealed that both the major and minor GlcNAc induction pathways required the master switch locus WOR1. Because cAMP activates PKA, we considered the possibility that Wor1, which contains one conserved PKA phosphorylation motif between amino acids 64 and 69, might have to be phosphorylated to function in the switch event. By converting the single threonine residue at that site to alanine, GlcNAc induction was impaired dramatically, indicating that phosphorylation of threonine 67 of Wor1 is necessary for maximum induction by GlcNAc. The observation that GlcNAc induction was completely blocked in the wor1/wor1 mutant, but only impaired in the wor1/wor1+TETp-WOR1TA mutant suggested that the constitutively unphosphorylated form of Wor1 was still functional, but at far lower efficiency than the phosphorylated form. In Schizosaccharomyces pombe, the gluconate transport inducer 1 (Gti1), an ortholog of Wor1, also harbors one conserved PKA phosphorylation motif between amino acids 65 and 70, and conversion of the single threonine residue at that site to alanine causes severe impairment of function [44]. As is the case in C. albicans, Pka1, which is the only PKA in S. pombe, is involved in the regulation of Gtil. Given that in C. albicans, Wor1 has one conserved PKA phosphorylation site that must be phosphorylated to attain the major portion of GlcNAc induction, and that Tpk2 appears to be the downstream PKA involved in GlcNAc induction, it seems reasonable to suggest that GlcNAc induction may involve the direct phosphorylation of Wor1 by Tpk2, but that remains to be demonstrated.
The Ras1/cAMP-dependent pathway has been found to be the predominant one for GlcNAc induction and the minor one for low level CO2 induction [18] (Figure 6). An unidentified pathway has been found to be the predominant one for CO2 induction [18] and an unidentified pathway has the minor one for GlcNAc induction (Figure 6). Our data further suggest that glucose represents a weak but significant inducer of switching that also functions through both a Ras1/cAMP-dependent pathway and a Ras1/cAMP-independent pathway, the latter again unidentified (Figure 6). The fact that each inducer functions not only through the Ras1/cAMP pathway, but also through an unidentified pathway, leaves open the possibility that the Ras1/cAMP-independent pathway may also be common to all three inducers. We demonstrated previously that both the Ras1/cAMP-dependent and -independent pathways for CO2 induction are dependent on Wor1 [18], and we have demonstrated here that the dependent and independent pathways for G1cNAc and glucose induction are also dependent on Wor1. We have demonstrated that only the major portion of G1cNAc induction, which is transduced by the Ras1/cAMP pathway, requires the phosphorylated form of Wor1.

The induction of switching by environmental cues shares several characteristics with that of filamentation. First, both CO2 and GlcNAc induce filamentation [19],[20],[24] as they do switching. Second, the Ras1/cAMP pathway has been demonstrated to play a role in the induction of filamentation by CO2 [20], as it does in switching. The Ras1/cAMP pathway has also been demonstrated to play a role in the induction of filamentation in S. cerevisiae [36],[45], suggesting that the pathways regulating of filamentation represent an ancestral process conserved in the evolution of both the Candida and Saccharomyces groups of the hemiascomycetes. Several characteristics of the opaque phenotype are shared with hyphae, including an elongate shape, a prominent vacuole and cell surface antigens [46],[47]. Because white-opaque switching is a specific and unique characteristic of C. albicans and the closely related species Candida dubliniensis [48], it represents a newly evolved developmental process, in contrast to filamentation.
Switching of C. albicans from white to opaque at physiological temperature can therefore be influenced by two factors in the gastrointestinal tract that result primarily from gastrointestinal bacteria: high CO2 [18] and free GlcNAc. In host tissue, high CO2 is the result of metabolism by the host, but in the gastrointestinal tract, it is the product of bacterial metabolism [40],[41]. GlcNAc in the gastrointestinal tract is also a product primarily of gastrointestinal tract bacteria, but also to a lesser extent of host goblet cells [41]. Hence, bacteria of the gastrointestinal tract produce two potent inducers of the white to opaque transition, a prerequisite for mating between a/a and α/α cells [4]. These results suggest that two developmental programs of C. albicans, filamentation and switching, have evolved to respond to signals originating from bacterial co-members of the gastrointestinal microbiota.
Materials and Methods
Strain Maintenance and Growth
The strains of C. albicans used in this study are listed in supplemental Table S2. For routine growth, modified Lee's medium without methionine was used [31], unless stated otherwise. For repression of MET3 promoter-controlled gene expression, 2.5 mM methionine and 2.5 mM cysteine were added to the medium. For GlcNAc induction, the carbon source glucose was replaced with GlcNAc (1.25% w/v) in nutrient medium. Here, agar containing Lee's medium, in which glucose was the carbon source, was referred to as glucose agar and Lee's medium containing GlcNAc as a carbon source was referred to as GlcNAc agar. Agar cultures were grown at a density of 80–120 colonies per 85 mm plate. Phloxine B was added to nutrient agar for opaque colony staining [46].
Construction of C. albicans Deletion Mutants
The PDE2 gene was disrupted using a modified Ura-blaster method [49]. Two long primers (PDE2-5DR, PDE2-3DR), each containing a different 60 nucleotide sequence homologous to the gene PDE2, were used for PCR amplification (supplemental Table S3). pDDB57, which contains the recyclable URA3-dpl200 marker, was used as template. The PCR product was transformed into WUM5A, a WO-1 derivative [50]. Transformants were grown on selective synthetic defined (SD) medium SD-Ura agar plates. To delete the second allele of PDE2, the PCR product was transformed into a spontaneous Ura - derivative of PDE2/pde2 obtained from SD agar containing 5-fluoro-orotic acid. pde2/pde2 null mutants were selected from SD-Ura agar plates and confirmed by PCR.
TPK1 and TPK2 were deleted by a PCR product-directed disruption protocol, as described in [18]. Briefly, the HIS1 and ARG4 markers were amplified by PCR from pGEM-HIS1 and pRS-ARG4-SpeI, respectively. The oligonucleotide pairs TPK1-5DR, TPK1-3DR; TPK2-5DR, TPK2-3DR (supplemental Table S3) were used for PCR amplification. The HIS1 and ARG4 markers were sequentially transformed into the host strains GH1013 [51], and heterozygous mutants. The null mutants were selected on SD-His-Arg plates and confirmed by PCR.
Construction of Plasmids
The primers used for plasmid constructions are listed in supplemental Table S3. To generate pMET-RAS1V13, the RAS1 ORF containing a mutation at the thirteenth amino acid (glycine to valine mutation) was amplified from pQF145.2 [25] by using primers including PstI and SphI sites, and then cloned into pCaEXP [33]. pMET-CDC35 was constructed by inserting the BamHI-SphI digested CDC35 ORF fragment into pCaEXP. To generate pMET-PDE2, the PDE2 ORF was amplified from CAI4 genomic DNA by using the primers PDE2F and PDE2R that contained BamHI and SphI sites (supplemental Table S3) and the PDE2 ORF was cloned into pCaEXP. To generate pACT-TPK1, the TPK1 ORF was amplified from CAI4 genomic DNA by using the primers TPK1F and TPK1R that included EcoRV and HindIII sites (supplemental Table S3), and the TPK1 ORF was cloned into pACT1 [18]. The TPK2 ORF was amplified from CAI4 genomic DNA by using primers TPK2F and TPK2R (supplemental Table S3). To generate pACT-TPK2, the PCR product was digested by HindIII and cloned into EcoRV/HindIII-digested pACT1. pNIM-WOR1 was constructed by inserting a SalI digested PCR fragment of WOR1 into the SalI site of pNIM1 [52]. The WOR1 ORF was amplified from CAI4 genomic DNA. The primers WOR1salF and WOR1salR were used for PCR amplification (supplemental Table S3). To generate a mutation in which threonine 67 is replaced with alanine in the WOR1 gene, a two-step PCR method [53] was used with slight modification. The primers WOR1TAF and WOR1TAR (supplemental Table S3) were used to generate site-directed mutation. The second-round PCR product was digested with SalI and subcloned into the SalI site of pNIM1. The resulting plasmid was referred to as pNIM-WOR1TA. The correct direction of WOR1 ORF and WOR1TA fragment in pNIM1 was confirmed by sequencing.
Regular White-Opaque Switching Assay (from Agar to Agar)
White-opaque switching on agar was analyzed as described previously [15]. Briefly, strains were first grown on agar containing supplemented Lee's medium for 6 days at 25°C. Colonies were then replated onto plates containing supplemented Lee's medium [31]. These plates were then incubated at 25°C for five days, and the proportion of colonies exhibiting different phenotypes counted.
White to Opaque Switching of Cells in Different Growth Phases
White colonies were inoculated into a test tube containing 1 ml of supplemented Lee's medium [31] with glucose as carbon source and incubated at 25°C. The overnight culture was diluted (to 2×10⁵ cells/ml) in 20 ml of fresh medium with glucose as the carbon source and incubated at 22°C in a shaker. Aliquots were taken out at different time points, diluted and plated onto both glucose agar and GlcNAc agar plates (Figure 1A). The plates were then incubated at 25°C for five days, and the colonies exhibiting different colony phenotypes counted. For the experiments performed at 37°C, plates were cultured at both 25 and 37°C.
Western Blot Analysis
Cells from liquid cultures were spun down following doxycycline treatment for 12 hours. Total protein extract was obtained using a bead beater in lysis buffer that contained 50 mM Tris-HCl, 100 mM NaCl, 5 mM MgCl2, 1 mM DTT, 1 mM EDTA, 1 mM EGTA, 0.1% Tween-20, and 5% glycerol, supplemented with a protease inhibitor cocktail (Sigma-Aldrich, St Louis, MO) and 1 mM phenyl-methylsulphonyl fluoride. An equal amount of total protein from each sample was then subjected to protein G beads (Active Motif, Carlsbad, California) for pre-clearing, followed by immuno-precipitation (IP) using rabbit GFP antibody-conjugated agarose beads (Santa Cruz Biotechnology, Santa Cruz, California). IP protein samples were subjected to SDS-PAGE (8% polyacrylamide) electrophoresis. After electrophoresis, the SDS-PAGE protein gel was transferred to a PVDF membrane (Immobilon-P, Millipore Corporation, Bedford, MA), blocked for 1 h in 3% non-fat dry milk in TBS-T (20 mM Tris-HCl, pH 7.5, 150 mM NaCl, 0.05% Tween-20), and then incubated with rabbit polyclonal GFP antibody (Santa Cruz Biotechnology, Santa Cruz, CA) overnight at 4°C [54]. After washing six times in TBS-T, the proteins on the membrane were detected with horseradish peroxidase-labelled goat anti-rabbit IgG (Promega, Madison, WI) and SuperSignal West Pico Chemiluminescent Substrate (Pierce, Rockford, IL).
Co-localization of GFP-Wor1p and Nuclei
Cells expressing tetracycline (doxycycline)-inducible GFP-labeled Wor1p were grown to midlog phase in the presence of 50 µg/ml doxycycline (Sigma-Aldrich, St Louis, MO, USA), harvested and simultaneously permeabilized and the nuclei labeled with 4′,6′-Diamidino-2-phenylindole (DAPI, Invitrogen, Inc.) by incubating them for 10 min at room temperature in the dark in a solution containing 5 µg/ml DAPI in 1 M Sorbitol, 0.1% Saponin, 150 mM NaCl and 20 mM Tris buffer, pH 7.4, followed by a 15–20 min incubation period on ice. Without washing, the cells were imaged using a Bio-Rad Radiance 2100 MP multi-photon microscope (Bio-Rad, Hermel, Hamstead, UK). Cells were excited at 780 nm by a Mai-Tai laser (Spectra - Physics, Newport Corp., Mountain View, CA) and three channel emission images (GFP, DAPI and transmitted) were gathered using a sequential 2.0 µm Z-series, gathered at 0.2 µm intervals to include the entire cell nucleus. GFP and DAPI images were visualized as Z-series projections. Transmitted images were a single scan at the focal plane selected from the Z-series.
Supporting Information
Zdroje
1. SollDR
1992 High-frequency switching in Candida albicans. Clin Microbiol Rev 5 183 203
2. SollDR
2009 Why does Candida albicans switch? FEMS Yeast 9 973 89
3. LanCY
NewportG
MurilloLA
JonesT
SchererS
2002 Metabolic specialization associated with phenotypic switching in Candida albicans. Proc Natl Acad Sci U S A 99 14907 14912
4. MillerMG
JohnsonAD
2002 White-opaque switching in Candida albicans is controlled by mating-type locus homeodomain proteins and allows efficient mating. Cell 110 293 302
5. HuangG
WangH
ChouS
NieX
ChenJ
2006 Bistable expression of WOR1, a master regulator of white-opaque switching in Candida albicans. Proc Natl Acad Sci U S A 103 12813 12818
6. SrikanthaT
BornemanAR
DanielsKJ
PujolC
WuW
2006 TOS9 regulates white-opaque switching in Candida albicans. Eukaryot Cell 5 1674 1687
7. ZordanRE
GalgoczyDJ
JohnsonAD
2006 Epigenetic properties of white-opaque switching in Candida albicans are based on a self-sustaining transcriptional feedback loop. Proc Natl Acad Sci U S A 103 12807 12812
8. ZordanRE
MillerMG
GalgoczyDJ
TuchBB
JohnsonAD
2007 Interlocking transcriptional feedback loops control white-opaque switching in Candida albicans. PLoS Biol 5(10) e256 doi:10.1371/journal.pbio.0050256
9. VincesMD
KumamotoCA
2007 The morphogenetic regulator Czf1p is a DNA-binding protein that regulates white opaque switching in Candida albicans. Microbiology 153 2877 2884
10. KlarAJ
SrikanthaT
SollDR
2001 A histone deacetylation inhibitor and mutant promote colony-type switching of the human pathogen Candida albicans. Genetics 158 919 924
11. SrikanthaT
TsaiL
DanielsK
KlarAJ
SollDR
2001 The histone deacetylase genes HDA1 and RPD3 play distinct roles in regulation of high-frequency phenotypic switching in Candida albicans. J Bacteriol 183 4614 4625
12. HniszD
SchwarzmullerT
KuchlerK
2009 Transcriptional loops meet chromatin: a dual-layer network controls white-opaque switching in Candida albicans. Mol Microbiol 74 1 15
13. HullCM
JohnsonAD
1999 Identification of a mating type-like locus in the asexual pathogenic yeast Candida albicans. Science 285 1271 1275
14. LockhartSR
PujolC
DanielsKJ
MillerMG
JohnsonAD
PfallerMA
SollDR
2002 In Candida albicans, white-opaque switchers are homozygous for mating type. Genetics 162 737 745
15. SlutskyB
StaebellM
AndersonJ
RisenL
PfallerM
SollDR
1987 “White-opaque transition”: a second high-frequency switching system in Candida albicans. J Bacteriol 169 189 197
16. RikkerinkEH
MageeBB
MageePT
1988 Opaque-white phenotype transition: a programmed morphological transition in Candida albicans. J Bacteriol 170 895 899
17. SrikanthaT
SollDR
1993 A white-specific gene in the white-opaque switching system of Candida albicans. Gene 131 53 60
18. HuangG
SrikanthaT
SahniN
YiS
SollDR
2009 CO2 regulates white-to-opaque switching in Candida albicans. Curr Biol 19 330 334
19. MockRC
PollackJH
HashimotoT
1990 Carbon dioxide induces endotrophic germ tube formation in Candida albicans. Can J Microbiol 36 249 253
20. KlengelT
LiangWJ
ChaloupkaJ
RuoffC
SchroppelK
2005 Fungal adenylyl cyclase integrates CO2 sensing with cAMP signaling and virulence. Curr Biol 15 2021 2026
21. GhuysenJ.-M
HakenbeckR
1994 Bacterial cell wall. Amsterdam Elsevier 581
22. SimonettiN
StrippoliV
CassoneA
1974 Yeast-mycelial conversion induced by N-acetyl-D-glucosamine in Candida albicans. Nature 250 344 346
23. ChoT
HamatakeH
KaminishiH
HagiharaY
WatanabeK
1992 The relationship between cyclic adenosine 3′,5′-monophosphate and morphology in exponential phase Candida albicans. J Med Vet Mycol 30 35 42
24. CassoneA
SullivanPA
ShepherdMG
1985 N-acetyl-D-glucosamine-induced morphogenesis in Candida albicans. Microbiologica 8 85 99
25. FengQ
SummersE
GuoB
FinkG
1999 Ras signaling is required for serum-induced hyphal differentiation in Candida albicans. J Bacteriol 181 6339 6346
26. RochaCR
SchroppelK
HarcusD
MarcilA
DignardD
2001 Signaling through adenylyl cyclase is essential for hyphal growth and virulence in the pathogenic fungus Candida albicans. Mol Biol Cell 12 3631 3643
27. BockmühlDP
KrishnamurthyS
GeradsM
SonnebornA
ErnstJF
2001 Distinct and redundant roles of the two protein kinase A isoforms Tpk1p and Tpk2p in morphogenesis and growth of Candida albicans. Mol Microbiol 42 1243 1257
28. CastillaR
PasseronS
CantoreML
1998 N-acetyl-D-glucosamine induces germination in Candida albicans through a mechanism sensitive to inhibitors of cAMP-dependent protein kinase. Cell Signal 10 713 719
29. BahnYS
MolendaM
StaabJF
LymanCA
GordonLJ
2007 Genome-wide transcriptional profiling of the cyclic AMP-dependent signaling pathway during morphogenic transitions of Candida albicans. Eukaryot Cell 6 2376 2390
30. WilsonD
Tutulan-CunitaA
JungW
HauserNC
HernandezR
2007 Deletion of the high-affinity cAMP phosphodiesterase encoded by PDE2 affects stress responses and virulence in Candida albicans. Mol Microbiol 65 841 856
31. BedellGW
SollDR
1979 Effects of low concentrations of zinc on the growth and dimorphism of Candida albicans: evidence for zinc-resistant and -sensitive pathways for mycelium formation. Infect Immun 26 348 354
32. BergenMS
VossE
SollDR
1990 Switching at the cellular level in the white-opaque transition of Candida albicans. J Gen Microbiol 136 1925 1936
33. CareRS
TrevethickJ
BinleyKM
SudberyPE
1999 The MET3 promoter: a new tool for Candida albicans molecular genetics. Mol Microbiol 34 792 798
34. BahnYS
StaabJ
SundstromP
2003 Increased high-affinity phosphodiesterase PDE2 gene expression in germ tubes counteracts CAP1-dependent synthesis of cyclic AMP, limits hypha production and promotes virulence of Candida albicans. Mol Microbiol 50 391 409
35. JungWH
StatevaLI
2003 The cAMP phosphodiesterase encoded by CaPDE2 is required for hyphal development in Candida albicans. Microbiology 149 2961 2976
36. PanX
HarashimaT
HeitmanJ
2000 Signal transduction cascades regulating pseudohyphal differentiation of Saccharomyces cerevisiae. Curr Opin Microbiol 3 567 572
37. NikawaJ
CameronS
TodaT
FergusonKM
WiglerM
1987 Rigorous feedback control of cAMP levels in Saccharomyces cerevisiae. Genes Dev 1 931 937
38. CloutierM
CastillaR
BolducN
ZeladaA
MartineauP
2003 The two isoforms of the cAMP-dependent protein kinase catalytic subunit are involved in the control of dimorphism in the human fungal pathogen Candida albicans. Fungal Genet Biol 38 133 141
39. SahniN
YiS
DanielsKJ
SrikanthaT
PujolC
2009 Genes Selectively Up-Regulated by Pheromone in White Cells Are Involved in Biofilm Formation in Candida albicans. PLoS Pathog 5(10) e1000601 doi:10.1371/journal.ppat.1000601
40. LevittMD
BondJHJr
1970 Volume, composition, and source of intestinal gas. Gastroenterology 59 921 929
41. AvundukC
2002 Manual of Gastroenterology: Diagnosis and Therapy. Philadelphia Lippincott Williams & Wilkins 505
42. O'HaraAM
ShanahanF
2006 The gastrointestinal tract flora as a forgotten organ. EMBO Rep 7 688 693
43. ChenJ
ChenJ
LaneS
LiuH
2002 A conserved mitogen-activated protein kinase pathway is required for mating in Candida albicans. Mol Microbiol 46 1335 1344
44. CaspariT
1997 Onset of gluconate-H+ symport in Schizosaccharomyces pombe is regulated by the kinases Wis1 and Pka1, and requires the gti1+ gene product. J Cell Sci 110 2599 2608
45. MadhaniHD
FinkGR
1998 The control of filamentous differentiation and virulence in fungi. Trends Cell Biol 8 348 353
46. AndersonJM
SollDR
1987 Unique phenotype of opaque cells in the white-opaque transition of Candida albicans. J Bacteriol 169 5579 5588
47. AndersonJ
MihalikR
SollDR
1990 Ultrastructure and antigenicity of the unique cell wall pimple of the Candida opaque phenotype. J Bacteriol 172 224 235
48. PujolC
DanielsKJ
LockhartSR
SrikanthaT
RadkeJB
2004 The closely related species Candida albicans and Candida dubliniensis can mate. Eukaryot Cell 3 1015 1027
49. WilsonRB
DavisD
EnloeBM
MitchellAP
2000 A recyclable Candida albicans URA3 cassette for PCR product-directed gene disruptions. Yeast 16 65 70
50. StraussA
MichelS
MorschhäuserJ
2001 Analysis of phase-specific gene expression at the single-cell level in the white-opaque switching system of Candida albicans. J Bacteriol 183 3761 3769
51. WilsonRB
DavisD
MitchellAP
1999 Rapid hypothesis testing with Candida albicans through gene disruption with short homology regions. J Bacteriol 181 1868 1874
52. ParkYN
MorschhüuserJ
2005 Tetracycline-inducible gene expression and gene deletion in Candida albicans. Eukaryot Cell 4 1328 1342
53. KeSH
MadisonEL
1997 Rapid and efficient site-directed mutagenesis by single-tube ‘megaprimer’ PCR method. Nucleic Acids Res 25 3371 3372
54. YiS
SahniN
PujolC
DanielsKJ
SrikanthaT
2009 A Candida albicans-specific region of the alpha-pheromone receptor plays a selective role in the white cell pheromone response. Mol Microbiol 71 925 947
Štítky
Hygiena a epidemiologie Infekční lékařství LaboratořČlánek vyšel v časopise
PLOS Pathogens
2010 Číslo 3
- Farmakovigilanční studie perorálních antivirotik indikovaných v léčbě COVID-19
- Jak souvisí postcovidový syndrom s poškozením mozku?
- Měli bychom postcovidový syndrom léčit antidepresivy?
- 10 bodů k očkování proti COVID-19: stanovisko České společnosti alergologie a klinické imunologie ČLS JEP
Nejčtenější v tomto čísle
- Kaposi's Sarcoma-Associated Herpesvirus ORF57 Protein Binds and Protects a Nuclear Noncoding RNA from Cellular RNA Decay Pathways
- Endocytosis of the Anthrax Toxin Is Mediated by Clathrin, Actin and Unconventional Adaptors
- Perforin and IL-2 Upregulation Define Qualitative Differences among Highly Functional Virus-Specific Human CD8 T Cells
- Exoerythrocytic Parasites Secrete a Cysteine Protease Inhibitor Involved in Sporozoite Invasion and Capable of Blocking Cell Death of Host Hepatocytes