
Perforin and IL-2 Upregulation Define Qualitative Differences among Highly Functional Virus-Specific Human CD8 T Cells
The prevailing paradigm of T lymphocyte control of viral replication is that the protective capacity of virus-specific CD8+ T cells is directly proportional to the number of functions they can perform, with IL-2 production capacity considered critical. Having recently defined rapid perforin upregulation as a novel effector function of antigen-specific CD8+ T cells, here we sought to determine whether new perforin production is a component of polyfunctional CD8+ T cell responses that contributes to the control of several human viral infections: cytomegalovirus (CMV), Epstein-Barr virus (EBV), influenza (flu), and adenovirus (Ad). We stimulated normal human donor PBMC with synthetic peptides whose amino acid sequences correspond to defined CTL epitopes in the aforementioned viruses, and then used polychromatic flow cytometry to measure the functional capacity and the phenotype of the responding CD8+ T cells. While EBV and flu-specific CD8+ T cells rarely upregulate perforin, CMV-specific cells often do and Ad stimulates an exceptionally strong perforin response. The differential propensity of CD8+ T cells to produce either IL-2 or perforin is in part related to levels of CD28 and the transcription factor T-bet, as CD8+ T cells that rapidly upregulate perforin harbor high levels of T-bet and those producing IL-2 express high amounts of CD28. Thus, “polyfunctional” profiling of antigen-specific CD8+ T cells must not be limited to simply the number of functions the cell can perform, or one particular memory phenotype, but should actually define which combinations of memory markers and functions are relevant in each pathogenic context.
Published in the journal:
. PLoS Pathog 6(3): e32767. doi:10.1371/journal.ppat.1000798
Category:
Research Article
doi:
https://doi.org/10.1371/journal.ppat.1000798
Summary
The prevailing paradigm of T lymphocyte control of viral replication is that the protective capacity of virus-specific CD8+ T cells is directly proportional to the number of functions they can perform, with IL-2 production capacity considered critical. Having recently defined rapid perforin upregulation as a novel effector function of antigen-specific CD8+ T cells, here we sought to determine whether new perforin production is a component of polyfunctional CD8+ T cell responses that contributes to the control of several human viral infections: cytomegalovirus (CMV), Epstein-Barr virus (EBV), influenza (flu), and adenovirus (Ad). We stimulated normal human donor PBMC with synthetic peptides whose amino acid sequences correspond to defined CTL epitopes in the aforementioned viruses, and then used polychromatic flow cytometry to measure the functional capacity and the phenotype of the responding CD8+ T cells. While EBV and flu-specific CD8+ T cells rarely upregulate perforin, CMV-specific cells often do and Ad stimulates an exceptionally strong perforin response. The differential propensity of CD8+ T cells to produce either IL-2 or perforin is in part related to levels of CD28 and the transcription factor T-bet, as CD8+ T cells that rapidly upregulate perforin harbor high levels of T-bet and those producing IL-2 express high amounts of CD28. Thus, “polyfunctional” profiling of antigen-specific CD8+ T cells must not be limited to simply the number of functions the cell can perform, or one particular memory phenotype, but should actually define which combinations of memory markers and functions are relevant in each pathogenic context.
Introduction
Understanding the mechanisms by which human T cells provide effective control of pathogens is important for designing interventions against those that persist to cause severe morbidity and/or mortality. T cells generally limit the replication of Epstein Barr virus (EBV)[1],[2], Cytomegalovirus (CMV)[3],[4],[5], and Hepatitis viruses B[6],[7],[8] and C[9],[10], but only rarely of the Human Immunodeficiency Virus (HIV), as the majority of HIV infections inevitably result in progressive disease. Cytotoxic T lymphocytes (CTL) are thought to be a primary mediator of viral control, due in large part to their ability to recognize and eliminate virally infected autologous cells. Although CD8+ T cells respond to viral infection with a plethora of effector functions, the identification of a definite immune correlate of protection has not been forthcoming for any human pathogen.
Recent strategies of assessing human antiviral T cell responses focus on the quality of the T cell response, defined by its polyfunctional nature. Briefly, the more effector functions that constitute the overall response, the more protective the response is considered[11],[12]. Typically, the functions quantified simultaneously include upregulation of interferon gamma (IFN-γ) and interleukin-2 (IL-2)[13],[14],[15]. A more elaborate assessment of the T cell response may include a measurement of tumour necrosis factor alpha (TNF-α), a chemokine such as MIP-1β, and degranulation measured by CD107a exposure. A high frequency, multi-functional CD4+ T cell response composed of IFN-γ, IL-2, and TNF-α provides protection against Leishmania major infection in mice[16], however a similar correlation in humans for antiviral CD8+ T cells has not been formally proven. This is likely because none, or any combination, of these functions may directly inhibit pathogen replication.
CTL clear virally infected target cells primarily via the exocytosis of cytotoxic granules containing granzymes and perforin[17],[18],[19],[20]. The manifestations of genetic mutation or deletion of perforin are impaired cellular cytotoxicity and profound immunodeficiency[21],[22]. We have recently shown that human CD8+ T cells can rapidly upregulate perforin de novo after antigen-specific stimulation[23], which is immediately transported to the immunological synapse where it likely potentiates cytotoxicity[24]. The measurement of new perforin is different from that of pre-formed perforin stored in cytotoxic granules, in that it indicates the potential of the cell to rapidly reconstitute its cytotoxic nature. In contrast, the assessment of pre-formed perforin in granules indicates immediate killing potential, but likely does not predict the sustainability of the cytotoxic response. Thus, analyzing this novel aspect of T cell functionality could provide new insight into how CD8+ T cells mediate pathogenic control.
Here we examine perforin upregulation ability in the context of polyfunctional CD8+ T cell responses to several common human viral pathogens: Cytomegalovirus (CMV), Epstein-Barr virus (EBV), Adenovirus (Ad), or Influenza (flu). Infection by EBV, CMV, flu, or Ad stimulates robust memory T cell responses that are associated with protection from viral pathogenesis. However, each course of infection is different: CMV establishes latency but remains lytically active, thereby creating a constant supply of antigen to the immune system, whereas EBV enters the lytic phase infrequently after establishing latency. Thus, EBV-specific CD8+ T cells likely only receive periodic restimulation. Primary Ad and flu infections are quickly resolved by the host immune response, but since Ad may become persistent, and there are many Ad serotypes whose sequences are highly conserved[25],[26], Ad-specific CD8+ T cells are likely repeatedly stimulated. In contrast, flu infections are seasonal and readily cleared, thus flu-specific CD8+ T cell restimulation is likely more intermittent than that for other viruses. We show that the measurement of perforin upregulation redefines our interpretation of polyfunctional CD8+ T cell responses and memory phenotypes that we associate with control of these pathogens, and represents a novel correlate of antiviral immunity that should be considered in assessments of human antiviral CD8+ T cell responses.
Results
We assayed 23 normal donors for memory CD8+ T cell responses against CMV, EBV, Ad, or flu, as defined by the ability to upregulate IFN-γ, TNF-α, IL-2, and/or perforin, or to degranulate, in response to stimulation with individual or pools of synthetic peptides that represent defined CTL epitope(s) in the amino acid sequence of the corresponding virus (Table 1). Individual peptide stimuli were determined by prior epitope mapping experiments, whereas pools of peptides were used on subjects for whom specific epitopes were not identified. We used IFN-γ production as a basal readout of activation; as shown in Figure 1A, we were able to detect CD8+ T cell responses against at least one viral peptide or peptide pool in each of the 23 donors. Two individuals did not produce IFN-γ in response to peptide stimulation (1 EBV, 1 flu) but instead produced TNF-α and/or IL-2 (data not shown). The largest virus specific responses we noted were CMV - or EBV-specific, with some individuals exhibiting responses up to ∼5% of total CD8+ T cells against a single epitope [median (black bar on Figure 1A) CMV = 0.28%, median EBV = 0.40%]. Ad-specific responses were found up to ∼1% of total CD8+ T cells against pools of hexon or E1A-derived peptides (median = 0.15%). Flu-specific IFN-γ production tended to be of lower magnitude than that for other viruses (median flu = 0.029%). Despite the low magnitude, flu-specific IFN-γ responses were readily detectable (Figure 1B). All subjects produced strong CD8+ T cell IFN-γ responses after SEB stimulation (Figure 1A, median = 2.76%).


IFN-γ producing virus-specific CD8+ T cells differentially express other functions
While IFN-γ production is commonly measured to identify virus-specific CD8+ T cells, it is unclear whether or not it represents a true correlate of immune protection for EBV, CMV, flu, or Ad. We therefore assessed the capacity of IFN-γ producing CD8+ T cells to perform other functions which might be associated with viral control, including rapid perforin upregulation, TNF-α, IL-2, and degranulation.
We recently characterized rapid perforin upregulation as a novel function of antigen-specific CD8+ T cells[24], the measurement of which indicates the cells' potential to sustain cytotoxicity. Briefly, newly produced perforin can be detected by a specific anti-perforin antibody (clone D48) which recognizes both pre-formed perforin stored in cytotoxic granules as well as new perforin that has been rapidly produced in response to antigenic stimulation. In contrast, a second perforin antibody (clone δG9) primarily recognizes perforin within cytotoxic granules. By quantifying perforin with the D48 antibody together with another function such as IFN-γ, it is possible to discriminate new perforin from pre-formed granule-associated perforin in activated CD8+ T cells. As shown in Figure 2A (top row), the activated cells that produced IFN-γ but failed to degranulate possessed the most perforin (Q3, green). Activated CD8+ T cells that both degranulated and upregulated IFN-γ harbored an intermediate amount of perforin (Q2, blue). Perforin was essentially absent in degranulating cells that failed to also produce IFN-γ (Q1, red). The Q1 and Q2 populations were both degranulating to the same degree, yet they represent responding cells that differentially upregulate perforin production. This may simply be an issue of kinetics, in that the cells that only degranulate may not have yet upregulated perforin, or signify a truly separate subpopulation that cannot upregulate perforin. Similarly, the IFN-γ producing responder population (Q2 and Q3) is divided into distinct functional (perforin ± CD107a) subsets. In contrast, the δG9 antibody, specific only for granule-associated perforin, failed to detect perforin in any of the functional subpopulations (Figure 2A, bottom row). Together, these data indicate that antigen-specific human CD8+ T cells are capable of upregulating perforin rapidly after stimulation, in the absence of cellular proliferation, and without the addition of exogenous cytokines or other co-factors.

We next examined whether rapid perforin upregulation was characteristic of EBV, CMV, flu, and Ad-specific CD8+ T cell responses in our subject cohort. First, we determined what proportion of every antigen-specific IFN-γ response also upregulated perforin in each donor. A representative example is shown in Figure 2B (left panel), where 87.2% of the IFN-γ producing cells concomitantly upregulated perforin. The cohort results are illustrated in the right panel of Figure 2B. Whereas nearly all IFN-γ+ Ad-specific CD8+ T cells upregulated perforin [orange group, median (black bar) = 73.6%], those responding to EBV and flu displayed limited perforin upregulation [blue group, median = 4.95% and black group, median = 0%, respectively]. Only donor U mounted a substantial EBV-specific perforin response (58.3% of the IFN-γ+ CD8+ T cells). CMV-specific perforin upregulation was highly variable between subjects [red group, median (black bar) = 25.1%, range: 5.39%–78.0%]; while some donors exhibited strong perforin upregulation (donors D = 78.0% and E = 60.9%), others were more limited [donor B, red open diamond: CMV peptide 20 = 5.39%, CMV peptide 23 = 12.8%]. Polyclonal SEB stimulation also resulted in varying degrees of perforin responsiveness [green group, median = 26.0%, range: 1.02%–62.8%]. Thus, immediate perforin upregulation is not an effector function common to all antigen-specific CD8+ T cells; rather it seems to be characteristic of CD8+ T cells specific for particular viral infections.
Since perforin is typically expressed with other cytotoxic proteins[19],[27],[28], we assayed for concomitant granzyme B and perforin upregulation in response to SEB stimulation in a small cohort of normal PBMC donors. As depicted in Figure 2C, perforin and granzyme B upregulation are tightly linked functions of responsive CD8+ T cells [r = 0.9135, 95% C.I. = 0.5861 to 0.9845, two tailed p value = 0.0015; Pearson correlation]. Thus, it is reasonable to infer CD8+ T cells that upregulate perforin are also producing new granzyme B.
Next, we examined the capacity of virus-specific IFN-γ+ CD8+ T cells to also produce IL-2 (Figure 3A). In contrast to perforin, IL-2 production was elevated in EBV - and flu-specific CD8+ T cells [EBV: blue group, median = 71.7%, flu: black group, median = 55.7%, respectively], whereas in CMV and Ad it was much lower [CMV: red group, median (black bar) = 39.4%, Ad: orange group, median = 0.21%, respectively].
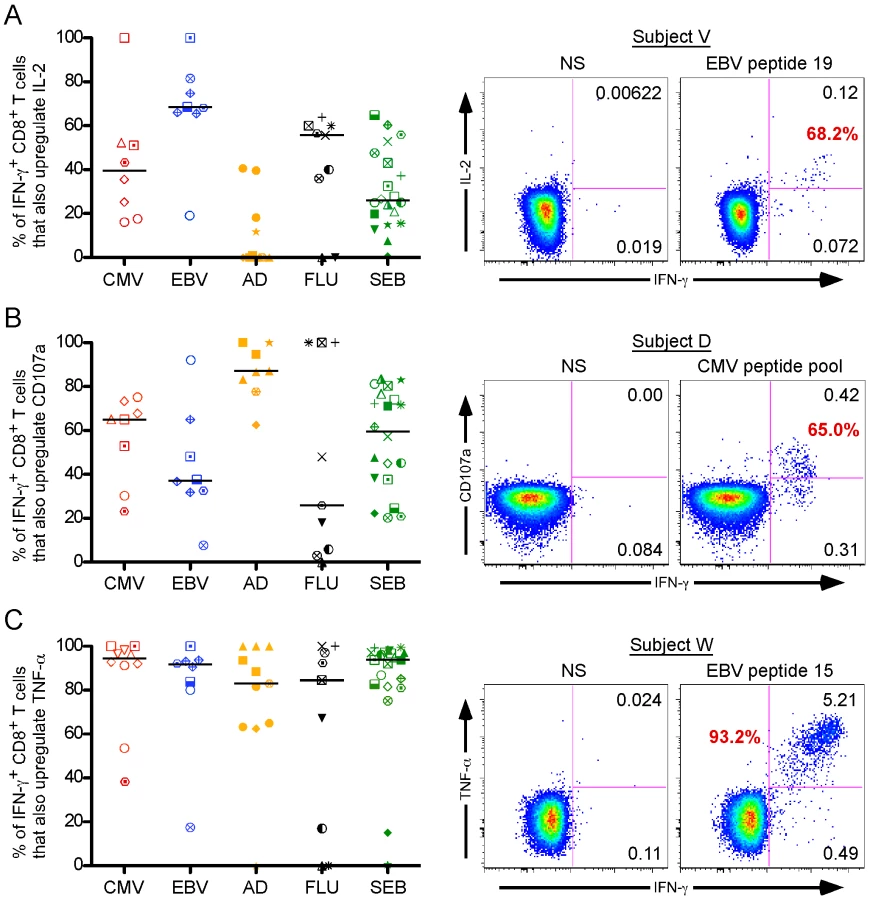
Finally, we analyzed degranulation capacity using the lysosomal and granule resident marker CD107a[29],[30], as well as TNF-α production [Figure 2B and 2C, respectively]. The CD107a response pattern across all the viral settings was similar to that of perforin: CMV and Ad stimuli induced strong CD8+ T cell degranulation [Figure 2B; CMV: red group, median (black bar) = 65.05%, Ad: orange group, median = 87.2%], whereas EBV and flu did to a lesser extent [EBV: blue group, median = 37.2%, flu: black group, median = 25.8%]. Unlike both CD107a and perforin, TNF-α production was ubiquitously expressed, as nearly every virus-specific IFN-γ+ CD8+ T cell also produced TNF-α [Figure 2C; CMV: red group, median (black bar) = 94.6%; EBV: blue group, median (black bar) = 91.35%; Ad: orange group, median (black bar) = 83.0%; flu: black group, median (black bar) = 84.6%].
Taken together, these results suggest that there are substantially different CD8+ T cell functional profiles against CMV, EBV, Ad, and flu, and that no single function (or pair of functions) likely defines a universal correlate of immune protection for all of these viruses.
Polyfunctional profiles of virus-specific CD8+ T cell responses
We next characterized the polyfunctionality of the virus-specific CD8+ T cells from each donor to see if a particular response profile(s) was consistently detected in all viral contexts. We grouped donor responses according to viral specificity, and then assessed the average CD8+ T cell polyfunctional profile specific for that viral infection. As shown in Figure 4A, each viral antigen stimulated a unique functional profile consisting of varying degrees of polyfunctionality. Perforin production (designated by purple arcs around the pies) dominated the Ad-specific response profile compared to the other viral stimulations, and was highly expressed in a 4+ population (orange pie slice) together with CD107a, IFN-γ, and TNF-α. In the case of CMV, perforin upregulation was somewhat less dominant, but was similarly co-expressed with CD107a, IFN-γ, and TNF-α (Figure 4B) to form a substantial 4+ population (Figure 4A, orange pie slice). EBV also generated a highly multi-functional response, however the 4+ population (orange pie slice) was composed entirely of an IL-2+CD107a+IFN-γ+TNF-α+ CD8+ T cell subset (Figure 4B). IL-2 production also dominated the 4+ polyfunctional profile of flu, as the IL-2+CD107a+IFN-γ+TNF-α+ subset was again the principal multi-functional population (Figure 4B). In fact, as depicted by the arcs around the pies in Figure 4A, it appears that IL-2 production (black arcs) and perforin upregulation (purple arcs) generally are not co-expressed within any polyfunctional population. Thus, while every virus stimulated a high frequency of CD8+ T cells capable of four effector functions simultaneously, CMV and Ad induced a perforin driven 4+ responder population, whereas EBV and flu preferentially stimulated an IL-2 dominated 4+ subset.

An inverse relationship exists between perforin and IL-2 upregulation
Strikingly, none of the virus-specific CD8+ T cell response profiles included a 5+ subset, suggesting that responding CD8+ T cells rarely upregulate perforin and IL-2 simultaneously. To further explore this possibility, we plotted the proportion of antigen-specific IFN-γ+ cells producing either new perforin or IL-2. As depicted in Figure 5A, a statistically significant inverse correlation exists between IL-2 and perforin positivity in virus-specific IFN-γ+ CD8+ T cells (r = −0.5684, 95% C.I. = −0.7604 to −0.2849, p<0.0005; Pearson correlation). A strong correlation also results if only SEB-induced responses are considered (Figure 5B; r = −0.6011, 95% C.I. = −0.8244 to −0.2159, p<0.0051; Pearson correlation). We performed our analysis on total CD8+ T cells, even though naïve cells preferentially produce IL-2 over IFN-γ and perforin. In our data set, however, the contribution of IL-2 from naïve CD8+ T cells in response to SEB stimulation is minimal compared to the antigen-experienced cells (not shown), and does not change the relationship we observe between IL-2 and perforin.

Thus, although not absolute, simultaneous production of IL-2 and perforin within the same CD8+ T cell, or within a virus-specific CD8+ T cell population, is exceptionally rare, suggesting a mutually exclusive relationship between these functions.
The transcription factor T-bet preferentially accumulates in CD8+ T cells that rapidly upregulate perforin while those producing IL-2 express CD28
There are several precedents characterizing the functional attributes of particular CD8+ T cell memory phenotypes in the context of specific viral infections[31],[32],[33],[34], however the basis for these differences remains unknown. We investigated the potential role of two cellular factors in determining the preferential expression of either perforin or IL-2 by virus-specific human effector CD8+ T cells: CD28, a co-receptor whose signaling is critical for the induction of IL-2 production[35],[36], and T-bet, the T-box transcription factor associated with effector function[37],[38],[39]. As illustrated in Figure 6A, CD28 is commonly detected on IL-2 producing CD8+ T cells (mean = 65.4%, SEM = 6.125, 95% C.I. 52.2–78.5%), whereas its expression is significantly lower on those upregulating perforin (mean = 19.7%, SEM = 5.047, 95% C.I 8.85–30.5%; p = <0.0001, Paired t-test). Within all subjects tested (each represented by a unique symbol), CD28 expression was always higher on the antigen-specific CD8+ T cells (each stimuli represented by a unique colour) producing IL-2 than their counterparts upregulating perforin (Figure 6A). A phenotypic evaluation of IL-2 producing and perforin upregulating cells reveals that the former cells bear relatively high levels of CD27 and CD28 but low levels of CD57, whereas the latter cells are mostly CD27+/−CD28loCD57hi (Supplementary Figure S1). Thus, CD28, which is important mechanistically for IL-2 production, is not commonly detected on CD8+ T cells that are rapidly upregulating perforin.

Although T-bet has been linked to the development of TH1 responses and effector function in murine CD4+ and CD8+ T cells, respectively[38],[39], a similar relationship has yet to be formally demonstrated in humans. The only possible exception is a clinical study of ICOS-deficient sibling patients in whom impaired CD8+ T cell effector function and decreased development of memory T cell populations was indirectly linked to T-bet [40]. As illustrated in Figure 6B, we first examined the levels of T-bet in resting human CD8+ T cell memory subsets directly ex vivo. Effector cells (CCR7−CD45RO−), and to a lesser degree effector memory cells (CCR7−CD45RO+), exhibited concordant levels of perforin and T-bet, whereas both factors were absent in naïve (CCR7+CD45RO−) and central memory cells (CCR7+CD45RO+). We then stimulated the PBMC from the same donor with SEB to activate all the functional subsets and assessed T-bet expression in the fraction of CD8+ T cells that rapidly upregulates perforin, compared to that producing IL-2 (Figure 6C). T-bet expression was most pronounced in perforin-producing cells compared to both IL-2 producing cells and naïve CD8+ T cells, although IL-2 producing cells did harbor more T-bet than naïve CD8+ T cells. Overall, in 6 separate individuals we observed T-bet in a higher proportion of CD8+ T cells upregulating perforin than in those producing IL-2 (Figure 6D: median = 91.75% vs. 58.1%, mean = 89.05±7.77% vs. 57.25±20.93%, p = 0.0068, Paired t-test). Furthermore, CD8+ T cells that rapidly upregulate perforin express more T-bet on a per cell basis than those that produce IL-2 (Figure 6E: median = 1476 vs. 893.5, mean = 1491±205.9 vs. 967.2±248.7 median fluorescence intensity, p = 0.004, Paired t-test).
In conclusion, the preferential expression of the transcription factor T-bet in CD8+ T cells that rapidly upregulate perforin over those that produce IL-2 supports a significant role for T-bet in the differentiation of antigen-specific human CD8+ T cells into cytotoxic effector cells. Furthermore, the expression of CD28 co-receptor is correlated to IL-2 production.
Discussion
What defines the “optimal” CD8+ T cell polyfunctional profile for viral infections in humans? The data we have presented here suggest that based upon the characteristics of replication, latency, persistence, and antigen load, every virus will potentially stimulate multiple polyfunctional profiles distinct from those of other viral infections. Here we examined four different viral infections, each of which is controlled or eliminated at least in part by viral-specific CD8+ T cells, and for each of these viral specificities we have found unique polyfunctional profiles. At the simplest level, it appears that rapid perforin upregulation and IL-2 production define complementary functional CD8+ T cell subsets that bear unique phenotypic profiles and predominate according to antigenic burden.
It has long been appreciated that CD8+ T cells play a pivotal role in the direct elimination of virally infected cells, and that perforin is a key mediator of this process through its distinct ability to enable the entry of apoptosis-inducing granzymes[17],[20]. We previously demonstrated that virus-specific CD8+ T cells rapidly upregulate perforin after activation and then target the protein directly to the interface between the CTL and its target[24]. This sustained production and targeted release of new perforin after stimulation may allow the CD8+ T cell to recognize and kill additional targets after the initial release and depletion of pre-formed perforin stored in cytotoxic granules. The measurement of new perforin production is significant because it serves as a gauge of a CD8+ T cells' potential to repeatedly eliminate infected host cells and, hence, control viral pathogenesis. Here we show that rapid perforin upregulation is a highly specialized ability not common to all CD8+ T cells. Rather, it appears to be tied to the antigenic history of the cell.
Whereas perforin upregulation and degranulation are commonly associated functions of CTL, there appears to be a mutually exclusive relationship between new perforin and IL-2 upregulation. Rapid perforin upregulation ability is not commonly observed against influenza and EBV. The fact that these pathogens establish latency (EBV) or are rapidly cleared (flu) suggests that antigen load or continual antigen exposure may in part maintain perforin upregulation ability and drive effector phenotype differentiation. For these viruses, proliferation and/or consequent differentiation of the EBV and flu-specific memory CD8+ T cells may be necessary to induce perforin upregulation. In contrast, perforin upregulation is more prominent in response to CMV and Adenovirus. CMV infection is characterized by continual low-level viral replication, and can induce massive expansions of CMV-specific effector CD8+ T cells[41]. Hence, it is not entirely surprising that CMV-specific CD8+ T cells should be capable of rapid perforin upregulation. The potent ability of Ad-specific CD8+ T cells to upregulate perforin, on the other hand, was unexpected since Ad, much like flu, should be rapidly cleared. However, there is evidence that Ad can become persistent[42]. Furthermore, there are at least 51 different Ad serotypes in circulation around the world, with differential levels of neutralizing antibodies against each serotype being present within a given individual[43]. As there is a high degree of sequence conservation between various Ad serotypes[26], cross-reactive CD8+ T cells are quite common, even between distantly related Ad serotypes[25]. Therefore, it is likely that exposure to Ad antigen from persisting virus or exposure to different Ad serotypes repeatedly activates Ad-specific CD8+ T cells, thereby driving the maintenance of a stable Ad-specific effector population. In contrast, EBV - and flu-specific CD8+ T cells typically produce IL-2 and bear a central memory phenotype. Since antigen load in the chronic phase of these infections is low or absent, the responding CD8+ T cell populations have likely differentiated to a resting memory state, where immediate cytotoxic potential is not critical.
An alternative interpretation of our data is that control of some viruses requires differential functional profiles: a polyfunctional response led by IL-2 is necessary for EBV and influenza, while CMV and Adenovirus may need to be controlled or cleared by a perforin-dominated response. Our phenotypic profiling of the perforin and IL-2 functional subsets as effector and central memory-like T cells, respectively, (Supplementary Figure S2) is in agreement with previous work on CD8+ T cell maturation, which included the measurement of pre-formed perforin, to ascribe discrete functional attributes to specific stages of differentiation[31],[33],[44],[45]. On this basis, several studies have related particular memory phenotypes to control of certain viral infections[32],[34],[46],[47],[48]. Our work elaborates on these earlier studies by correlating specific, complex functional profiles to immunity against different viral pathogens, irrespective of stage of differentiation. The D48 perforin antibody used here enabled the measurement of both pre-formed and new perforin, permitting a detailed characterization of the complete perforin compartment and a sharper definition of the mutually exclusive relationship between the perforin and IL-2 CD8+ T cell functional subsets. Given the cross-sectional nature of our study, it is not possible to ascertain whether new perforin and IL-2 dominated functional subsets represent stable CD8+ T cell populations that actually abrogate their respective viral burdens, or if they are subsets that result as a consequence to a waning antigenic presence. A longitudinal analysis of CD8+ T cells responding to the live yellow fever virus and smallpox vaccines recently showed that both vaccines generated a primary virus-specific CD8+ T cell response that passed through an obligate effector phase in which the cells abundantly expressed perforin and granzyme B[49]. The cells then differentiated into long-lived memory cells that maintained the ability to proliferate and secrete effector cytokines in response to antigen[49]. Thus, the perforin and IL-2 functional subsets we describe herein likely serve to mediate protective immunity at different stages of infection.
What is responsible for the transition from a polyfunctional response highlighted by rapid perforin upregulation to an IL-2-dominated response? What determines the array of functions a CD8+ T cell can perform? Antigen sensitivity has recently been reported to be required for the development of a polyfunctional CD8+ T cell response[50], but the mechanism behind this phenomenon remains to be elucidated. Our association between elevated CD28 levels and IL-2 production by antigen-specific CD8+ T cells confirms published findings describing a direct role for CD28 signaling in IL-2 induction[35],[36]. Our observation that new perforin preferentially accumulates in human CD8+ T cells that express the transcription factor T-bet supports the role of T-bet as a ‘master regulator’ of effector CD8+ T cell responses[37],[38],[51],[52]. Corollary, the relatively reduced levels of T-bet in the IL-2 producing CD8+ T cells supports data from mouse models of T cell differentiation which demonstrate that T-bet is also a transcriptional repressor of IL-2[53],[54]. Furthermore, T-bet expression correlates with the development of short-lived effector cells in mice, whereas a moderate decrease in T-bet expression promotes long-lived memory [51],[52],[55]. Thus, our data suggest that T-bet is intimately involved in determining the functional capabilities of virus-specific CD8+ T cells, and provide an important premise in humans on which to explore the relationship between T-bet and the perforin gene.
The interplay between IL-2 and perforin thus necessitates a re-evaluation of our current interpretation of CD8+ T cell polyfunctionality. The prevailing rationale is that antigen-specific polyfunctional CD8+ T cell responses containing IL-2 are most effective at controlling viral replication[13]; a premise that is driving current T cell based vaccine strategies. Our data suggest that we need to reclassify CD8+ T cell polyfunctionality into at least two distinct types: polyfunctional memory (IL-2 + IFN-γ + other functions without perforin) or polyfunctional effector (perforin + IFN-γ + other functions without IL-2), each profile being distinct and worthy of independent consideration. In reality, both functional subsets will likely be required for a protective immune response, each being instrumental at different stages of infection.
Materials and Methods
Ethics statement
The University of Pennsylvania's Center for AIDS Research Human Immunology Core (IRB# 705906), The Wistar Institute (IRB#2506215), and Duke University (IRB exempt) obtained written, informed consent from every donor subject in order to collect PBMC samples and approved the methods employed in this study.
Cells and peptides
PBMC were cryopreserved in fetal bovine serum (FBS; ICS Hyclone, Logan, Utah) containing 10% dimethyl sulfoxide (DMSO; Fisher Scientific, Pittsburgh, Pennsylvania). Individual peptide stimuli were determined by prior epitope mapping by IFN-γ Elispot experiments. In subjects for whom epitopes were not identified, pools of peptides (15mers overlapping by 11 amino acids) were used. Regarding the use of 15 versus 9 amino acid individual peptides, several studies have shown that although some variation in function and magnitude can be present between some epitopes, on average the magnitude and functionality of responses to CTL epitopes represented as a 9 mer or within a 15 mer peptide are generally equivalent. As a proof of concept, we stimulated Subject E with both an optimal and a 15 amino acid peptide containing the epitope TPRVTGGGA and quantified very similar responses (Supplemental Figure S3).
Antibodies
Antibodies for surface staining included anti-CD4 PE Cy5-5 (Invitrogen; Carlsbad, California), anti-CD107a FITC (BD Biosciences; San Jose, California), anti-CD8 Qdot 655 (custom) or TRPE (Invitrogen; Carlsbad, California), anti-CD14 Pac Blue (BD Biosciences; San Jose, California), anti-CD16 Pac Blue (BD Biosciences; San Jose, California), and anti-CD19 Pac Blue (Invitrogen; Carlsbad, California), anti-CD57 Qdot 565 (custom), anti-CD27 PE Cy5 (Beckman Coulter, Inc; Fullerton, California) or PerCP Cy5-5 (Biolegend; San Diego, California), anti-CD28 ECD (Beckman Coulter, Inc; Fullerton, California) and anti-CD45RO Qdot 605/705 (custom) or ECD (Beckman Coulter, Inc; Fullerton, California). Antibodies for intracellular staining included anti-CD3 Qdot 585 (custom), anti-Granzyme B Texas Red PE (BD Pharmingen; San Diego, California), anti-IFN-γ Alexa 700 (BD Pharmingen; San Diego, California), anti-IL-2 APC (BD Pharmingen; San Diego, California), anti-TNF-α PE Cy7 (BD Biosciences; San Jose, California), and anti-T-bet (Santa Cruz Biotechnology; Santa Cruz, California). Custom conjugations to Quantum (Q) dot nanocrystals were performed in our laboratory as previously described[56], with reagents purchased from Invitrogen (Carlsbad, California). Anti-human perforin antibodies were purchased from Tepnel (clone D48, Besancon, France) and BD Biosciences (clone δG9, San Jose, California).
FACS staining assay
Cryopreserved PBMC were thawed, and then rested overnight at 37°C, 5% CO2 in complete medium [RPMI (Mediatech Inc; Manassas, Virginia) supplemented with 10% FBS, 1% L-glutamine (Mediatech Inc; Manassas, Virginia), and 1% penicillin-streptomycin (Lonza; Walkersville, Maryland), sterile filtered] at a concentration of 2×10⁶ cells per ml medium in 12-well plates. The next day, the cells were washed with complete medium and resuspended at a concentration of 1×10⁶ cells/ml with costimulatory antibodies (anti-CD28 and anti-CD49d; 1 µg/ml final concentration; BD Biosciences; San Jose, California), in the presence of monensin (0.7 µg/ml final concentration; BD Biosciences; San Jose, California) and brefeldin A (1 µg/ml final concentration; Sigma-Aldrich; St. Louis, Missouri). Anti-CD107a was always added at the start of all stimulation periods, as described previously[29]. As a negative control, 5 µl of DMSO was added to the cells, an equivalent concentration compared to the peptide stimulus. SEB served as the positive control (1 µg/ml final concentration; Sigma-Aldrich; St. Louis, Missouri). Peptide stimulations were performed at a final concentration of 2 µM. Stimulation tubes were incubated at 37°C, 5% CO2 for six hours, after which cells were washed once with PBS and then stained for viability with Aqua amine-reactive viability dye (Invitrogen; Carlsbad, California) for ten minutes in the dark at room temperature. A cocktail of antibodies was then added to the cells to stain for surface markers for an additional twenty minutes. The cells were washed with PBS containing 1% bovine serum albumin (BSA, Fisher Scientific; Pittsburgh, Pennsylvania) and 0.1% sodium azide (Fisher Scientific; Pittsburgh, Pennsylvania), and permeabilized using the Cytofix/Cytoperm kit (BD Biosciences; San Jose, California) according to the manufacturer's instructions. A cocktail of antibodies against intracellular markers was then added to the cells and allowed to incubate for one hour in the dark at room temperature. The cells were then washed once with Perm Wash buffer (BD Biosciences; San Jose, California) and fixed in PBS containing 1% paraformaldehyde (Sigma-Aldrich; St. Louis, Missouri). Fixed cells were stored in the dark at 4°C until the time of collection.
Flow cytometric analysis
For each specimen, between 500,000 and 1,000,000 total events were acquired on a modified flow cytometer (LSRII; BD Immunocytometry Systems; San Jose, California) equipped for the detection of 18 fluorescent parameters. Antibody capture beads (BD Biosciences; San Jose, California) were used to prepare individual compensation tubes for each antibody used in the experiment. Data analysis was performed using FlowJo version 8.7.3 (TreeStar, Ashland, Oregon). Reported data have been corrected for background.
Figures
Canvas software, version 10.4.9 (ACD Systems; Miami, Florida), and Prism software, version 5.0 (Graphpad; La Jolla, California), were used to create the figures. Labels and boxes were added to raw data images in Canvas. The dots for Subject C in the bottom right panel of Figure 6 were enlarged in Canvas to facilitate visual identification and discrimination.
Statistical analyses
Correlation between %IL-2 and %perforin of IFN-γ producing CD8+ T cells was determined by a two-tailed Pearson correlation test. A two-tailed Paired t-test was used to define statistically significant differences in CD28 and T-bet expression between IL-2 and perforin producing CD8+ T cells. Both analyses were performed using Prism software.
Supporting Information
Zdroje
1. AmyesE
HattonC
Montamat-SicotteD
GudgeonN
RickinsonAB
2003 Characterization of the CD4+ T cell response to Epstein-Barr virus during primary and persistent infection. J Exp Med 198 903 911
2. CallanMF
2003 The evolution of antigen-specific CD8+ T cell responses after natural primary infection of humans with Epstein-Barr virus. Viral Immunol 16 3 16
3. BelzGT
DohertyPC
2001 Virus-specific and bystander CD8+ T-cell proliferation in the acute and persistent phases of a gammaherpesvirus infection. J Virol 75 4435 4438
4. DohertyPC
ChristensenJP
BelzGT
StevensonPG
SangsterMY
2001 Dissecting the host response to a gamma-herpesvirus. Philos Trans R Soc Lond B Biol Sci 356 581 593
5. GillespieGM
WillsMR
AppayV
O'CallaghanC
MurphyM
2000 Functional heterogeneity and high frequencies of cytomegalovirus-specific CD8(+) T lymphocytes in healthy seropositive donors. J Virol 74 8140 8150
6. GuidottiLG
IshikawaT
HobbsMV
MatzkeB
SchreiberR
1996 Intracellular inactivation of the hepatitis B virus by cytotoxic T lymphocytes. Immunity 4 25 36
7. GuidottiLG
RochfordR
ChungJ
ShapiroM
PurcellR
1999 Viral clearance without destruction of infected cells during acute HBV infection. Science 284 825 829
8. MoriyamaT
GuilhotS
KlopchinK
MossB
PinkertCA
1990 Immunobiology and pathogenesis of hepatocellular injury in hepatitis B virus transgenic mice. Science 248 361 364
9. LechnerF
WongDK
DunbarPR
ChapmanR
ChungRT
2000 Analysis of successful immune responses in persons infected with hepatitis C virus. J Exp Med 191 1499 1512
10. ThimmeR
BukhJ
SpangenbergHC
WielandS
PembertonJ
2002 Viral and immunological determinants of hepatitis C virus clearance, persistence, and disease. Proc Natl Acad Sci U S A 99 15661 15668
11. MakedonasG
BettsMR
2006 Polyfunctional analysis of human t cell responses: importance in vaccine immunogenicity and natural infection. Springer Semin Immunopathol 28 209 219
12. SederRA
DarrahPA
RoedererM
2008 T-cell quality in memory and protection: implications for vaccine design. Nat Rev Immunol 8 247 258
13. HarariA
DutoitV
CelleraiC
BartPA
Du PasquierRA
2006 Functional signatures of protective antiviral T-cell immunity in human virus infections. Immunol Rev 211 236 254
14. PantaleoG
HarariA
2006 Functional signatures in antiviral T-cell immunity for monitoring virus-associated diseases. Nat Rev Immunol 6 417 423
15. ZimmerliSC
HarariA
CelleraiC
VallelianF
BartPA
2005 HIV-1-specific IFN-gamma/IL-2-secreting CD8 T cells support CD4-independent proliferation of HIV-1-specific CD8 T cells. Proc Natl Acad Sci U S A 102 7239 7244
16. DarrahPA
PatelDT
De LucaPM
LindsayRW
DaveyDF
2007 Multifunctional TH1 cells define a correlate of vaccine-mediated protection against Leishmania major. Nat Med 13 843 850
17. HeuselJW
WesselschmidtRL
ShrestaS
RussellJH
LeyTJ
1994 Cytotoxic lymphocytes require granzyme B for the rapid induction of DNA fragmentation and apoptosis in allogeneic target cells. Cell 76 977 987
18. PodackER
YoungJD
CohnZA
1985 Isolation and biochemical and functional characterization of perforin 1 from cytolytic T-cell granules. Proc Natl Acad Sci U S A 82 8629 8633
19. PetersPJ
BorstJ
OorschotV
FukudaM
KrahenbuhlO
1991 Cytotoxic T lymphocyte granules are secretory lysosomes, containing both perforin and granzymes. J Exp Med 173 1099 1109
20. ShiverJW
HenkartPA
1991 A noncytotoxic mast cell tumor line exhibits potent IgE-dependent cytotoxicity after transfection with the cytolysin/perforin gene. Cell 64 1175 1181
21. BolithoP
VoskoboinikI
TrapaniJA
SmythMJ
2007 Apoptosis induced by the lymphocyte effector molecule perforin. Curr Opin Immunol 19 339 347
22. VoskoboinikI
SmythMJ
TrapaniJA
2006 Perforin-mediated target-cell death and immune homeostasis. Nat Rev Immunol 6 940 952
23. HerspergerAR
MakedonasG
BettsMR
2008 Flow cytometric detection of perforin upregulation in human CD8 T cells. Cytometry A
24. MakedonasG
BanerjeePP
PandeyR
HerspergerAR
SanbornKB
2009 Rapid up-regulation and granule-independent transport of perforin to the immunological synapse define a novel mechanism of antigen-specific CD8+ T cell cytotoxic activity. J Immunol 182 5560 5569
25. LeenAM
SiliU
VaninEF
JewellAM
XieW
2004 Conserved CTL epitopes on the adenovirus hexon protein expand subgroup cross-reactive and subgroup-specific CD8+ T cells. Blood 104 2432 2440
26. Crawford-MikszaL
SchnurrDP
1996 Analysis of 15 adenovirus hexon proteins reveals the location and structure of seven hypervariable regions containing serotype-specific residues. J Virol 70 1836 1844
27. SmythMJ
KellyJM
SuttonVR
DavisJE
BrowneKA
2001 Unlocking the secrets of cytotoxic granule proteins. J Leukoc Biol 70 18 29
28. CatalfamoM
HenkartPA
2003 Perforin and the granule exocytosis cytotoxicity pathway. Curr Opin Immunol 15 522 527
29. BettsMR
BrenchleyJM
PriceDA
De RosaSC
DouekDC
2003 Sensitive and viable identification of antigen-specific CD8+ T cells by a flow cytometric assay for degranulation. J Immunol Methods 281 65 78
30. BettsMR
KoupRA
2004 Detection of T-cell degranulation: CD107a and b. Methods Cell Biol 75 497 512
31. HamannD
BaarsPA
RepMH
HooibrinkB
Kerkhof-GardeSR
1997 Phenotypic and functional separation of memory and effector human CD8+ T cells. J Exp Med 186 1407 1418
32. AppayV
DunbarPR
CallanM
KlenermanP
GillespieGM
2002 Memory CD8+ T cells vary in differentiation phenotype in different persistent virus infections. Nat Med 8 379 385
33. BaarsPA
Ribeiro Do CoutoLM
LeusenJH
HooibrinkB
KuijpersTW
2000 Cytolytic mechanisms and expression of activation-regulating receptors on effector-type CD8+CD45RA+CD27 − human T cells. J Immunol 165 1910 1917
34. GamadiaLE
RemmerswaalEB
WeelJF
BemelmanF
van LierRA
2003 Primary immune responses to human CMV: a critical role for IFN-gamma-producing CD4+ T cells in protection against CMV disease. Blood 101 2686 2692
35. HardingFA
AllisonJP
1993 CD28-B7 interactions allow the induction of CD8+ cytotoxic T lymphocytes in the absence of exogenous help. J Exp Med 177 1791 1796
36. KoulovaL
ClarkEA
ShuG
DupontB
1991 The CD28 ligand B7/BB1 provides costimulatory signal for alloactivation of CD4+ T cells. J Exp Med 173 759 762
37. IntlekoferAM
TakemotoN
WherryEJ
LongworthSA
NorthrupJT
2005 Effector and memory CD8+ T cell fate coupled by T-bet and eomesodermin. Nat Immunol 6 1236 1244
38. SullivanBM
JuedesA
SzaboSJ
von HerrathM
GlimcherLH
2003 Antigen-driven effector CD8 T cell function regulated by T-bet. Proc Natl Acad Sci U S A 100 15818 15823
39. SzaboSJ
SullivanBM
StemmannC
SatoskarAR
SleckmanBP
2002 Distinct effects of T-bet in TH1 lineage commitment and IFN-gamma production in CD4 and CD8 T cells. Science 295 338 342
40. TakahashiN
MatsumotoK
SaitoH
NankiT
MiyasakaN
2009 Impaired CD4 and CD8 effector function and decreased memory T cell populations in ICOS-deficient patients. J Immunol 182 5515 5527
41. SylwesterAW
MitchellBL
EdgarJB
TaorminaC
PelteC
2005 Broadly targeted human cytomegalovirus-specific CD4+ and CD8+ T cells dominate the memory compartments of exposed subjects. J Exp Med 202 673 685
42. GarnettCT
ErdmanD
XuW
GoodingLR
2002 Prevalence and quantitation of species C adenovirus DNA in human mucosal lymphocytes. J Virol 76 10608 10616
43. De JongJC
WermenbolAG
Verweij-UijterwaalMW
SlaterusKW
Wertheim-Van DillenP
1999 Adenoviruses from human immunodeficiency virus-infected individuals, including two strains that represent new candidate serotypes Ad50 and Ad51 of species B1 and D, respectively. J Clin Microbiol 37 3940 3945
44. LanzavecchiaA
SallustoF
2000 Dynamics of T lymphocyte responses: intermediates, effectors, and memory cells. Science 290 92 97
45. SallustoF
LenigD
ForsterR
LippM
LanzavecchiaA
1999 Two subsets of memory T lymphocytes with distinct homing potentials and effector functions. Nature 401 708 712
46. FaintJM
AnnelsNE
CurnowSJ
ShieldsP
PillingD
2001 Memory T cells constitute a subset of the human CD8+CD45RA+ pool with distinct phenotypic and migratory characteristics. J Immunol 167 212 220
47. WillsMR
OkechaG
WeekesMP
GandhiMK
SissonsPJ
2002 Identification of naive or antigen-experienced human CD8(+) T cells by expression of costimulation and chemokine receptors: analysis of the human cytomegalovirus-specific CD8(+) T cell response. J Immunol 168 5455 5464
48. RoosMT
van LierRA
HamannD
KnolGJ
VerhoofstadI
2000 Changes in the composition of circulating CD8+ T cell subsets during acute epstein-barr and human immunodeficiency virus infections in humans. J Infect Dis 182 451 458
49. MillerJD
van der MostRG
AkondyRS
GlidewellJT
AlbottS
2008 Human effector and memory CD8+ T cell responses to smallpox and yellow fever vaccines. Immunity 28 710 722
50. AlmeidaJR
SauceD
PriceDA
PapagnoL
ShinSY
2009 Antigen sensitivity is a major determinant of CD8+ T-cell polyfunctionality and HIV-suppressive activity. Blood 113 6351 6360
51. IntlekoferAM
TakemotoN
KaoC
BanerjeeA
SchambachF
2007 Requirement for T-bet in the aberrant differentiation of unhelped memory CD8+ T cells. J Exp Med 204 2015 2021
52. JoshiNS
CuiW
ChandeleA
LeeHK
UrsoDR
2007 Inflammation directs memory precursor and short-lived effector CD8(+) T cell fates via the graded expression of T-bet transcription factor. Immunity 27 281 295
53. HwangES
HongJH
GlimcherLH
2005 IL-2 production in developing Th1 cells is regulated by heterodimerization of RelA and T-bet and requires T-bet serine residue 508. J Exp Med 202 1289 1300
54. SzaboSJ
KimST
CostaGL
ZhangX
FathmanCG
2000 A novel transcription factor, T-bet, directs Th1 lineage commitment. Cell 100 655 669
55. TakemotoN
IntlekoferAM
NorthrupJT
WherryEJ
ReinerSL
2006 Cutting Edge: IL-12 inversely regulates T-bet and eomesodermin expression during pathogen-induced CD8+ T cell differentiation. J Immunol 177 7515 7519
56. ChattopadhyayPK
PriceDA
HarperTF
BettsMR
YuJ
2006 Quantum dot semiconductor nanocrystals for immunophenotyping by polychromatic flow cytometry. Nat Med 12 972 977
Štítky
Hygiena a epidemiologie Infekční lékařství LaboratořČlánek vyšel v časopise
PLOS Pathogens
2010 Číslo 3
- Farmakovigilanční studie perorálních antivirotik indikovaných v léčbě COVID-19
- Jak souvisí postcovidový syndrom s poškozením mozku?
- Měli bychom postcovidový syndrom léčit antidepresivy?
- 10 bodů k očkování proti COVID-19: stanovisko České společnosti alergologie a klinické imunologie ČLS JEP
Nejčtenější v tomto čísle
- Kaposi's Sarcoma-Associated Herpesvirus ORF57 Protein Binds and Protects a Nuclear Noncoding RNA from Cellular RNA Decay Pathways
- Endocytosis of the Anthrax Toxin Is Mediated by Clathrin, Actin and Unconventional Adaptors
- Perforin and IL-2 Upregulation Define Qualitative Differences among Highly Functional Virus-Specific Human CD8 T Cells
- Exoerythrocytic Parasites Secrete a Cysteine Protease Inhibitor Involved in Sporozoite Invasion and Capable of Blocking Cell Death of Host Hepatocytes