
A Splice Mutation in the Gene Causes High Glycogen Content and Low Meat Quality in Pig Skeletal Muscle
Glycogen storage diseases (GSD) are a group of inherited disorders characterized by storage of excess glycogen, which are mainly caused by the abnormality of a particular enzyme essential for releasing glucose from glycogen. GSD-like conditions have been described in a wide variety of species. Pigs are a valuable model for the study of human GSD. Moreover, pigs affected by GSD usually produce inferior pork with a lower ultimate pH (so-called “acid meat”) and less processing yield due to post-mortem degradation of the excess glycogen. So far, only one causal variant, PRKAG3 R225Q, has been identified for GSD in pigs. Here we reported a loss-of-function mutation in the PHKG1 gene that causes the deficiency of the glycogen breakdown, consequently leading to GSD and acid meat in Duroc-sired pigs. Eliminating the undesirable mutation from the breeding stock by a diagnostic DNA test will greatly reduce the incidence of GSD and significantly improve pork quality and productivity in the pig.
Published in the journal:
. PLoS Genet 10(10): e32767. doi:10.1371/journal.pgen.1004710
Category:
Research Article
doi:
https://doi.org/10.1371/journal.pgen.1004710
Summary
Glycogen storage diseases (GSD) are a group of inherited disorders characterized by storage of excess glycogen, which are mainly caused by the abnormality of a particular enzyme essential for releasing glucose from glycogen. GSD-like conditions have been described in a wide variety of species. Pigs are a valuable model for the study of human GSD. Moreover, pigs affected by GSD usually produce inferior pork with a lower ultimate pH (so-called “acid meat”) and less processing yield due to post-mortem degradation of the excess glycogen. So far, only one causal variant, PRKAG3 R225Q, has been identified for GSD in pigs. Here we reported a loss-of-function mutation in the PHKG1 gene that causes the deficiency of the glycogen breakdown, consequently leading to GSD and acid meat in Duroc-sired pigs. Eliminating the undesirable mutation from the breeding stock by a diagnostic DNA test will greatly reduce the incidence of GSD and significantly improve pork quality and productivity in the pig.
Introduction
In past decades, thousands of quantitative trait loci (QTLs) have been detected for economically important traits in livestock through genetic linkage studies [1]. The recent availability of livestock genome sequences and high-density SNP chips has allowed detection of significant association of nucleotide polymorphisms with complex traits, and effective identification of causal mutations for some monogenic traits [2]–[4]. Despite these progresses, uncovering the quantitative trait genes (QTGs) or nucleotides (QTNs) for complex traits remains a challenging task. Only a handful of QTNs have been convincingly identified in livestock [5]–[7].
More recently, several studies in human, mouse and Drosophila have shown that the integration of phenotypic traits, genetic and gene transcript data enables researchers to identify expression QTL (eQTL), untangle gene-based regulatory networks, infer relationship between gene expression levels and phenotypic traits, and thereby detect novel trait-causing genes [8]–[10]. Therefore, the integrative analysis would play a key role in acquiring the knowledge of mechanisms responsible for livestock complex traits. Indeed, some researchers have identified a number of promising candidate genes for muscle traits and blood lipid traits of pig by integrative analyses of GWAS (or linkage mapping), eQTL and trait-correlated expression [11]–[14].
Glycogen storage diseases (GSD) characterized by defects in glycogen metabolism and excess glycogen stored in liver and muscle are multifactorial disorders. Both human and animals suffer from GSD. Agricultural researchers often measure the glycogen content or glycolytic potential [GP = 2× (glucose + glycogen + glucose-6-phosphate) + lactate] in skeletal muscle of farm animals at slaughter. However, instead of the GSD diagnostic indicator, the GP value is mainly used for the prediction of meat quality development during the conversion of muscle to meat, because GP is a determinant of multiple meat quality characteristics, such as pH, color, water holding capacity (drip loss), tenderness and processing yields [15], [16].
GSD or extreme GP phenotype can be caused by genetic variation of various enzymes or transporters, which are involved either directly in the synthesis or breakdown of glycogen or in the utilization of its catabolite, glucose-1-phosphate [17]. To date, only one responsible gene, PRKAG3, has been elaboratively evidenced to impact glycogen and GP levels in Hampshire and its related synthetic lines [18], [19]. Although more than 10 different QTLs for the trait have been reported (http://cn.animalgenome.org/cgi-bin/QTLdb/index), QTGs or QTNs underlying these QTLs remain unexplored.
We have previously identified a major QTL for GP and pH values at 42 cM on chromosome 3 in a large scale White Duroc × Erhualian F2 intercross [20]. To decipher the molecular basis of the GP QTL, we herein performed an integrative genetic analysis by utilizing extensive data sets of GP-related traits, high-density genotypes and gene expression profiling from three experimental populations. We show compelling evidence that a splice mutation in the PHKG1 gene is the QTN underlying the major QTL effect on GP and its related traits.
Results
Genome-wide association studies on two experimental populations define the QTL to a ∼180-kb region
We first performed a genome-wide association study (GWAS) for GP and its components including residual glycogen & glucose (RG), glucose-6-phosphate (G-6-P) and lactate on the White Duroc × Erhualian F2 intercross, in which 877 phenotyped F2 individuals and its parents/grandparents were genotyped by using Illumina Porcine SNP 60K Beadchips [21]. The quality control filtering and data processing of the GWAS data are described in the Methods. Quantile-quantile plots with genome control λGC values are shown in Figure S1. We found no evidence of systematic inflation of association test results. Consistent with our previous QTL results [20], the GWAS results demonstrated that Sus Scrofa chromosome 3 (SSC3) contained the most genome-wide significant locus (P = 5.85×10⁻²²) for both GP and RG with the top SNP ss131031160 (pSNP) at 17.09 Mb (Figure 1). However, this lead SNP was not associated with the glycolysis intermediate product G-6-P and end-product lactate (Figure S2). These results suggest that the underlying QTG likely influences the conversion between glycogen and glucose (or G-6-P) rather than the conversion between G-6-P to lactate. The pSNP ss131031160 explains 19.6% of the phenotypic variance in RG of the F2 population.

To validate and fine map the SSC3 QTL for RG, we conducted a second GWAS on 433 Sutai pigs, a Chinese synthetic line derived from a cross between Duroc and Taihu including Erhualian and Meishan after more than twenty-year selection. Besides 62163 SNPs on the Illumina Porcine SNP 60K Beadchip, 53 SNPs derived from DNA sequence comparison between Erhualian and Duroc (see Materials and Methods) within a 1-Mb region surrounding the top pSNP were genotyped for these Sutai pigs. As expected, we confirmed the strong association signal on SSC3 in the Sutai population. The pSNP ss131565361 (P = 9.06×10⁻¹⁹) at 16.92 Mb (Figure 1) explains 53.6% of the RG variance. This locus also significantly influenced ultimate pH (measured 24 hours after slaughter) and drip loss (Figure S2). Based on the LOD drop off 2, the empirical confidence intervals of the QTL in the F2 and Sutai populations was 920 kb (16.92–17.84 Mb) and 630 kb (16.47–17.10 Mb) respectively (Figure 2A). Therefore, the most likely QTL interval was their overlapping region of 180 kb (16.92–17.10 Mb). This interval contains 7 annotated genes: GUSB, VKORC1L1, NUPR1L, CHCHD2, PHKG1, SUMF2 and CCT6A (Figure 2A).

eQTL mapping supports PHKG1 as the most likely responsible gene
Using the data of digital gene expression profiles (DGE) tested in longissimus muscle samples from 497 F2 animals, we identified genome-wide eQTL for the 7 annotated genes in the critical region. We operationally defined cis-eQTL as any association between a gene expression and SNPs within 2 Mb of the gene location. We found 3 cis-eQTL each for PHKG1, SUMF2 and GUSB (Figure 2B). Intriguingly, the lead SNP for the cis-eQTL affecting PHKG1 expression was identical to the top pSNP (ss131031160) for GP in the GWAS on the F2 population. The major allele (G) at this SNP was associated with lower residual glycogen and higher expression of PHKG1 (Table 1 and Figure 2C). PHKG1 encodes a catalytic subunit of the phosphorylase kinase (PhK), which can mediate glycogen breakdown. Therefore, the co-localization of the top SNP in both GWAS and eQTL mapping coupled with the biological function highlights PHKG1 as the most likely QTG underlying the major locus on SSC3.

Sequencing the PHKG1 gene identifies a splice mutation as candidate QTN
To search for coding variants in the PHKG1 gene, we isolated and sequenced PHKG1 cDNA from muscle samples of 6 F2 individuals representing three genotypes at the pSNP ss131031160 (2 GG, 2 GA and 2 AA animals). In total, we detected 14 polymorphisms (Table S1). Of note, we found a 32-bp deletion/insertion (c.del/ins32; Figure 3A&B) polymorphism at exon10 that alters the open-reading frame and causes a premature stop codon, leading to a truncated and nonfunctional protein product.

To test if the 32-bp deletion was also present in the genomic DNA (gDNA), we sequenced the 140 bp genomic region encompassing the deletion using gDNA samples of the above-mentioned 6 F2 animals. We found only one single nucleotide substitution (C>A) in the region. This SNP (g.8283C>A) lies 5 bp upstream of the c.del/ins32 (Figure 3C&D), where the pyrimidine (C or T) is highly conserved among vertebrates, including chicken, mouse, dog, cow, sheep and human. The C→A nucleotide transvertion may weaken the strength of the pyrimidine-rich signal near the 3′ end of the PHKG1 intron 9, which is known to correlate with splicing efficiency [22]. Using a web-available tool Alternative Splice Site Predictor (ASSP, http://wangcomputing.com/assp/index.html), we found that the splice site score (1.652) of the mutant sequence was much lower than the wild-type counterpart (3.659), and even lower than the default cutoff value (2.2) for acceptor sites set in the predictor. Therefore, the mutation appears to attenuate or inhibit the role of the constitutive acceptor splice site and this consequently evokes another cryptic acceptor at 32 bp downstream of the mutation, which results in a loss of 32 bp in mature mRNA during PHKG1 transcription (Figure 3E).
To test if the 32-bp deletion in exon 10 was directly caused by the SNP g.8283C>A, the effect of the variant on splicing was assessed using a minigene splicing assay (Figure S3). Two minigene expression vectors carrying either the wild-type or the mutant PHKG1 g. 8283C>A segment were constructed and transiently transfected into HeLa cells and 293T cells (Figure S3A). The minigene transcripts in these transfected cells were analyzed by RT-PCR, using specific primers complementary to exon 9 and exon 10 of the minigene. We found two amplicons of 78 bp and 62 bp from the mutant construct and only one amplicon of 94 bp from the wild-type construct (Figure S3B). Sanger sequencing analysis revealed that the two truncated amplicons corresponded to two aberrant splicings of the first 16 and 32 nucleotides (nt) at 5′ end of exon 10 (Figure S3C-E). The presence of novel aberrant splicing of 16-nt may be due to that the minigene constructs only contain partial PHKG1 sequence or there is a special splicing factor in the transfected cells. Anyway, the result clearly demonstrates that the variant PHKG1 g. 8283C>A is responsible for the aberrant splicing of 32-nt observed in vivo.
The candidate QTN co-segregates with QTL genotypes of parental boars in the two experimental populations
To obtain further evidence for the causality of the candidate QTN (SNP g.8283C>A), we conducted the concordance test between the SNP genotypes and the QTL genotypes on 9 parental boars (6 F1 boars and 3 Sutai boars). The QTL genotypes of these boars were determined by the marker-assisted segregation analysis (see Materials and Methods). We found that the SNP genotypes were completely concordant with the QTL genotypes in these boars (Table S2). In contrast, the two top pSNPs ss131031160 and ss131565361 in the GWAS exhibited disconcordance with the QTL genotypes in the 9 parental sires. Concordantly, the association of the g.8283C>A SNP with RG phenotype was strongest among all SNPs genotyped in Sutai pigs, and was at the same significance level as that of the top GWAS SNP ss131031160 in the F2 population due to their complete linkage disequilibrium (Table S3).
In addition, we re-sequenced a 10-kb segment covering 1 kb upstream of the PHKG1 gene to its 3′ end on all 9 sires (6 F1 and 3 Sutai sires) with deduced QTL status. A total of 142 variants were identified (Table S4). We found that 7 Q chromosomes of these boars shared the same haplotype while 11 q chromosomes corresponded to multiple divergent haplotypes (Figure S4). Surprisingly, a q haplotype from Sutai boars was nearly identical to the Q haplotypes except for three variants, of which only one (g.8283C>A) showed co-segregation with QTL genotypes across all the 9 sires (Figure S5). This strongly supports the causality of the g.8283C>A mutation.
Haplotype analysis showed that no other variants within the PHKG1 region were in complete LD with the SNP g.8283C>A across all experimental populations. Based on that, we tried to determine whether other variants can also result in partial QTL effect. When the SNP g.8283C>A was included as a fixed effect in the model, the QTL effects on PHGK1 expression and RG trait vanished in these populations (Figure S6A). Furthermore, we divided the Sutai pigs into three genotype groups (AA, CA, CC). No eQTL effect was detected within each group (Figure S6B). It thus suggests that even there is another regulatory SNPs, their effects are likely negligible.
The QTN significantly affects PHKG1 mRNA and protein levels
Aberrant mRNA, like the truncated PHKG1 transcript caused by the g.8283C>A SNP, tend to be degraded by a known mechanism of nonsense-mediated mRNA decay (NMD) in the cell. To analyze whether the mutation interferes with PHKG1 mRNA expression levels, qRT-PCR experiments were performed on total RNA isolated from 293T cells transiently transfected by the wild-type and mutant PHKG1 minigenes. The mutant minigene produced nonsense mRNAs at 56% level of normal expression (Figure S7). The finding indicates that the PHKG1-32del mRNA bearing the premature termination codon was most likely degraded by NMD.
In fact, electropherogram of RT-PCR products amplified from PHKG1 mRNA in homozygous animals showed that the intensity of the mutant DNA band of 114 bp was much lower than the normal band of 146 bp (Figure 3A), implying NMD of the mutant PHKG1 mRNA. Accordingly, the PHKG1 cDNA sequence chromatograms illustrated that the fluorescence intensity of wild-type allele (Wt or q) were 2–3 fold stronger than that of the mutant allele (Mt or Q) in animals heterozygous for the g.8283C>A SNP (Figure 3F). To more accurately estimate the difference in abundance between Wt and Mt transcripts, we designed two pairs of primers: one (Common-5′-FP/RP) for amplification of both transcripts, and the other (Wt-3′-FP/RP) for the specific amplification of Wt transcript (Figure 4A). After performing qRT-PCR with the two primer sets, we quantified the levels of total mRNA transcripts relative to wild-type transcripts. In heterozygotes, the ratio of (Mt+Wt) to Wt transcripts was 1.4∶1 (Figure 4B), suggesting that the 60% of Mt transcripts were degraded by NMD.
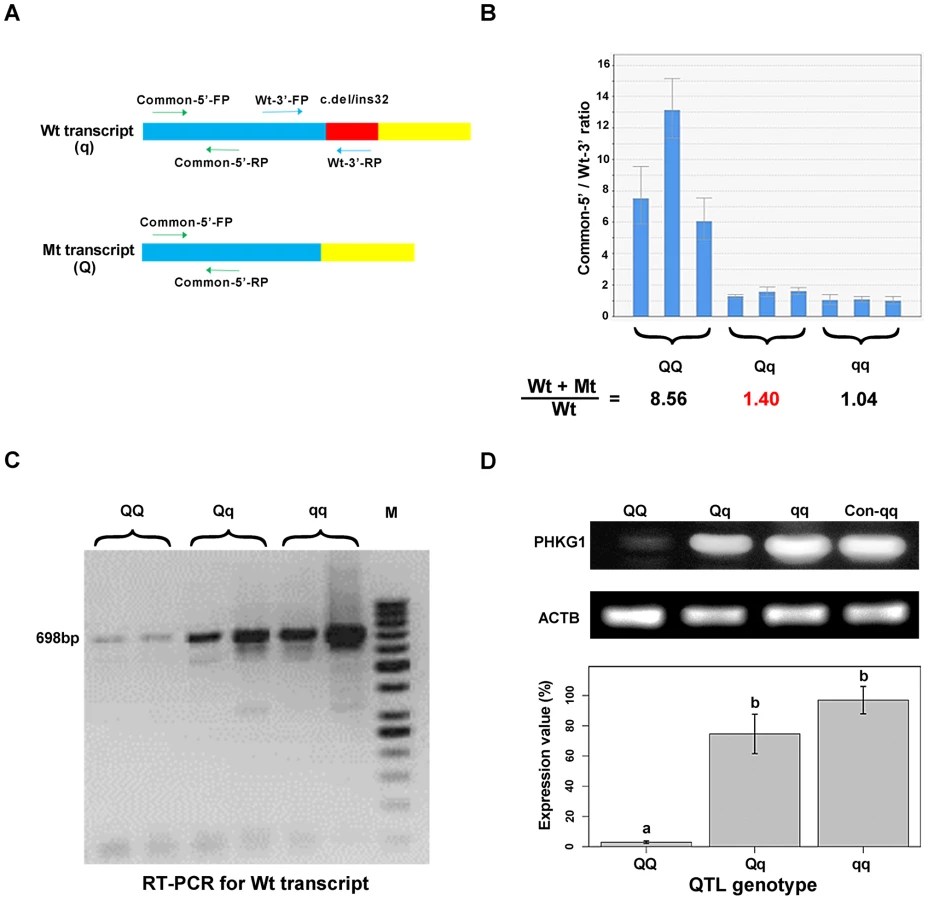
Interestingly, we found that mutant homozygotes (AA or QQ) had PHKG1 Wt, as RT-PCRs using the primers specific for the Wt generated amplicons corresponding to Wt in these mutant homozygotes (Figure 4C). We further showed that, only about one-eighth of PHKG1 transcripts was Wt (Figure 4B). The result suggests that the g.8283C>A mutation could strongly decrease but not completely abrogate the original splicing form.
Consistently, the PHKG1 Wt transcript level is highest in muscle samples from CC animals, followed by AC and AA individuals (Figure 4C). Similar tendency was observed for the PHKG1 Wt protein level in the three genotypes by Western-blot analysis (Figure 4D). Thus, it is evident that the g.8283C>A mutation affects the expression of PHKG1 at both transcription and translation levels.
PHKG1 mRNA level is significantly correlated with the RG phenotype
PHKG1 is a critical enzyme in the glycogen metabolism. We expected that the PHKG1 mRNA expression level would be significantly associated with the RG phenotype. However, we did not observe such strong correlation (r = −0.08, P = 0.106; Figure 5B) using the DGE data in the F2 population. We then made a close examination on the DGE data. We found that the DGE tag for PHKG1 was located in a region upstream of the 32-bp deletion, which therefore can not distinguish Wt from Mt transcripts. To correct for the biased effect of the abnormal Mt transcripts, we further used qRT-PCR to measure the Wt level on 117 F2 individuals and 104 Sutai pigs, of which the number of CC, CA and AA animals at the g.8283C>A locus are nearly identical (Figure 5A). We then examined the correlation between the qPCR-data and the RG phenotypes. As a result, the PHKG1 Wt (functional) transcript level was significantly correlated with RG phenotype (r≤−0.4, P<10−5) in the two populations (Figure 5B). Such strong correlation were not detected for any other cis-regulated genes within the critical region of the SSC3 QTL (Figure S8), strengthening the causal relationship between PHKG1 and RG.

The PHKG1 g.8283C>A mutation significantly alters the enzymatic activity of the phosphorylase kinase
PHKG1 is a catalytic subunit of the phosphorylase kinase (PhK). The g.8283C>A splice mutation in the PHKG1 gene thus likely influence the enzymatic activity of PhK and glycogen phosphorylase. To verify the assumption, we tested the enzymatic activity of PhK in 18 muscle samples―6 per genotype group (CC, AC, and AA). As expected, the AA group showed>6-fold reduction in enzyme activity as compared to the CC and AC groups (Figure 6). It is reasonable to speculate that reduced PhK enzyme's activity would lead to slow breakdown of glycogen in muscle, which in turn cause excess accumulation of glycogen in the tissue. This is consistent with the SSC3 QTL effect on GP or RG trait.

The PHKG1 g.8283C>A mutation is significantly associated with GP-related meat quality traits in multiple Duroc-derived populations
Considering the inter-relationship of GP with other meat quality attributes, we evaluated the effects of the PHKG1 g.8283C>A mutation on all meat quality traits measured in the 864 F2 individuals from the White Duroc × Erhualian intercross, 431 Sutai pigs and 140 three-way hybrid DLY [Duroc × (Landrace × Yorkshire)] pigs. In the F2 population, there was a tendency towards lower ultimate pH and higher drip loss in AA pigs with higher GP compared to CA and CC individuals (the mean values of pH 24h in AA, CA and CC groups were 5.70, 5.72 and 5.77, respectively; for drip loss: 1.01%, 0.85% and 0.92%, respectively), although the mean differences did not reach statistical significance, partially due to a low frequency (5%) of the AA genotype in the population.
In Sutai pigs, each genotype group (AA, AC or CC) at the PHKG1 g.8283C>A site has more than 100 individuals. Significant effects of the causal mutation were observed on almost all meat quality traits in this population (Tables 2 and S5). Especially, the RG level in the longissimus muscle (LM) of AA animals was 4 times higher (P = 9.03×10−54) than those in CC animals. Coincidently, drip loss, rate of pH decline and Minolta a* and b* were higher (P<0.01) in AA pigs than CC pigs. AA pigs also had lower (P<0.001) intramuscular fat content (IMF) and marbling score compared to CC pigs. In the DLY hybrid commercial population, all 140 individuals were genotyped for the PHKG1 g.8283C>A mutation and 53 surrounding SNPs using the OpenArray platform (see Materials and Methods). Again, we observed the significant effects of the g.8283C>A mutation on RG, pH and drip loss (Table 2). Moreover, this mutation showed stronger associations with these traits than any other surrounding SNPs (Figure S9). These results indicate that the A allele has unfavorable effects on these meat quality traits.

To reveal the allele frequency of the PHKG1 g.8283C>A mutation in diverse pig breeds, we genotyped this mutation in a broad panel of 629 animals representing 5 European commercial breeds, 2 Chinese domestic breeds, and wild boars from China and Europe. The A allele causing excess glycogen content occurred at high frequency (0.70) in White Duroc and at medium frequency (0.32) in Red Duroc, but it was nearly absent in other domestic and wild breeds (<0.03; Table 3). The PHKG1 mutant allele was absent in wild boars, suggesting that the mutation likely happened after domestication. However, due to limit number of wild boars examined in this study, we cannot rule out the possibility that it is a standing variation.

Discussion
To date, only a handful of QTG and QTN have been identified for complex traits in farm animals. To the best of our knowledge, this is the first study that has used a system genetics approach including GWAS, eQTL mapping and causality modeling to identify QTG and QTN for complex traits in pigs.
Our study supports the PHKG1 gene as a QTG for GP-related traits based on the following findings: (1) GWAS on the F2 and Sutai populations enable us to define the major QTL for GP within an interval of 180-kb on SSC3, which contains only 7 genes including PHKG1. (2) Of three positional candidate genes with cis-eQTLs signals, only PHKG1 has the cis-eQTL peak SNP that is identical to the pQTL peak SNP. (3) PHKG1 is a catalytic subunit of the phosphorylase kinase (PhK), which is critical to glycogen degradation. (4) The wild-type transcript level of PHKG1 was significantly correlated to glycogen content in muscle.
Furthermore, our study shows the following evidences for the PHKG1 g.8283C>A mutation as QTN underlying the SSC3 QTL effect: (1) The mutation caused abnormal splicing of PHKG1 mRNA, resulting in a shift in the reading frame with a premature stop codon. (2) The aberrant mRNA transcripts were diminished by NMD, which reduced the PHKG1 protein level and led to PhK enzyme deficiency. (3) The mutation shows the complete concordance between their genotypes and the deduced QTN genotypes across all parental boars. No other variants in the PHKG1 gene exhibited such concordance. (4) This mutation has a consistent and significant effect on GP-related traits across all tested populations.
Here, we illustrate that the QTN (g.8283C>A) is a splice site mutation affecting both transcription and translation levels of the PHKG1 gene, which has at least three implications. One is that cis-eQTL mapping for annotated genes residing the QTL region can not only contribute to identification of regulatory QTNs, but also benefit characterization of protein-altering QTNs including splice and nonsense mutations that affect transcript levels by NMD, just like our identified QTN. Another implication is that if a gene is subjected to alternative splicing, it is necessary to determine the levels of its different transcripts (instead of only the total amount of these transcripts) by deep RNA sequencing and then examine their individual relationship with phenotypic traits. The third one is that we could identify a cis QTL for PHKG1 protein level that overlaps with the mapped cis-eQTL and pQTL on SSC3 if a big data set on protein abundance was available, and find a strong relationship between protein level and GP-related traits. This information could add a new dimension for the search of QTG. Several studies have recently demonstrated the feasibility of high-throughput proteome quantification and revealed the variation and genetic control of protein abundance in humans and mice [23], [24]. Hopefully, whole proteome analysis will be more efficient and routinely added to integrative genomic analysis to accelerate the identification of QTG and QTN for complex traits in livestock.
Phosphorylase kinase (PhK) is comprised of four different subunits with a stoichiometry of (αβγδ)4; α,β, and δ are regulatory, while γ is catalytic. Each of these subunits has isoforms or splice variants differentially expressed in different tissues. Mutations in 4 PhK subunit genes (PHKA1, PHKA2, PHKB and PHKG2) have been implicated in low PhK activity in liver and/or muscle [25]–[29]. No variant in the muscle isoform of the PhKγsubunit (PHKG1) has been reported for muscle PhK deficiency [17]. To our knowledge, this study is the first one to confirm the association of the PHKG1 mutation with PhK deficiency, muscle glycogenosis and meat quality traits in pigs.
Pork with high GP (>180 µmol/g) often has low ultimate pH and water holding capacity, and is therefore called “acid meat”. The R225Q mutation in PRKAG3 gene was the first identified causal mutation for acid meat [19]. This gain-of-function mutation causes an increased glucose uptake and glycogen synthesis in skeletal muscle [30], [31]. Its unfavorable allele (225Q) is dominant and specifically present in Hampshire and related breeds [19]. In contrast, the PHKG1 g.8283C>A mutation that we identified is a loss-of-function mutation causing the defect in glycogen degradation. This variant occurs predominantly in Duroc or Duroc-crossed pigs. The mutant allele A appears to be partially recessive, since the average RG value of AC heterozygotes approximates to that of CC homozygotes rather than AA homozygotes (Table S3).
Costa et al. [32] have reported that 9.8% of DLY hybrid pigs free of the PRKAG3 225Q allele still show the acid meat phenotype with GP higher than 180 µmol/g. In this study, we found that the PHKG1 QTNs are segregating in DLY hybrid pigs with a frequency of 1.7% (9/540) for the homozygous mutant with GP beyond 180 µmol/g. Therefore, we speculate that a substantial proportion of acid meat is likely caused by the PHKG1 g.8283C>A mutation.
It was observed that the mutation had negative effects on almost all meat quality traits but did not impact any growth traits (e.g. carcass weight; see Table S6) in the F2, Sutai and DLY populations. However, Duroc and two Duroc-derived lines carry the mutation at relatively high frequencies (Table 3). The result may suggests that meat quality has not been the primary breeding goals in these pig populations.
In conclusion, we identified a causal mutation in the PHKG1 gene associated with excess glycogen content in Duroc and its related pigs. The finding highlights the important role of genes encoding PhK subunits in the formation of the GP-related traits. More intriguingly, our finding would be of considerably importance for the pig industry as we can develop a diagnostic DNA test to effectively eliminate the PHKG1 undesirable allele from nucleus herds and consequently improve meat quality.
Materials and Methods
Ethics statement
All procedures involving animals followed the guideline for the care and use of experimental animals established by the Ministry of Agriculture of China. The ethics committee of Jiangxi Agricultural University specifically approved this study.
Samples and meat quality trait measurement
Three experimental populations were involved in this study: a White Duroc × Erhualian F2 intercross, a Chinese Sutai half-sib population and a commercial DLY hybrid population. The F2 population was established as described previously [33]. Briefly, two White Duroc boars were mated to 17 Erhualian sows. Nine F1 boars and 59 F1 sows were then intercrossed to produce a total of 1912 F2 animals in 6 batches. Sutai is a Chinese synthetic line that is derived from Chinese Taihu (50%) and Western Duroc (50%) after over 18 generations of artificial selection. The Sutai population comprised offspring of 4 sires and 55 dams. A total of 930 F2 individuals, 434 Sutai pigs and 540 DLY pigs were used in this study.
The F2 and Sutai pigs were weaned at day 46 and 28 respectively, and males were castrated at day 90 and 18 respectively. The two populations were raised at an experimental farm of Jiangxi Agricultural University in Nanchang city during their fattening period and were slaughtered for phenotype recording at the age of 240±3 days. The DLY pigs grew up at a farm of Xiushui city (about 110 miles away from Nanchang) until the slaughter weight of 90–100kg. All pigs were transported and slaughtered at the same commercial abattoir in Nanchang where the pigs were fasted for 15–20 hours with water available ad libitum. After slaughter, muscle samples were removed within 30 minutes postmortem from the longissimus (LM) and semimembranosus (SM) muscles for RNA isolation and the measurement of meat quality traits. The meat characteristics including the ultimate pH (or pH 24h, measured at 24h postmortem), drip loss, Minolta color parameters (L*, a*, b*), subjective scores of color and marbling, intramuscular fat content (IMF), glycolytic potential (GP), residual glycogen (RG), glucose-6-phosphate (G-6-P) and lactate were measured as described previously [20], [34].
Array-based SNP genotyping and GWAS mapping
Genomic DNA was isolated from ear, blood or spleen tissues with a standard phenol/chloroform method. A total of 1020 animals from the F2 population were genotyped for 62163 SNPs on the Illumina PorcineSNP60 BeadChip [21] according to the standard manufacture's protocol. The 60K Beadchip has 62,163 SNP, of which 54,920 can be mapped to the current pig genome assembly (Sus Scrofa Build 10.2) [35]. The quality control (QC) procedures were carried out by Plink v 1.07 [36]. Briefly, animals with call rate>0.9 and Mendelian error rate <0.05, and SNP with call rate>0.9, minor allele frequency>0.05, P value>10−5 for the Hardy-Weinberg equilibrium test were included. A final set of 39414 informative SNPs on 930 F2 pigs were used for subsequent analyses. A total of 434 Sutai pigs were also genotyped using the Illumina PorcineSNP60 BeadChip. To fine map the SSC3 QTL, we increased the marker density in this QTL region with additional 53 SNPs (Table S7), which were identified through comparison of our own whole-genome sequence data from 4 F0 Erhualian sows and the Duroc reference genome sequence (Sus scrofa Build 10.2). All Sutai pigs were further genotyped for the 53 SNPs by using the TaqMan OpenArray Genotyping System (Life Technologies). After QC filtering as described above, 44560 SNPs were included for further analysis. We also genotyped 140 DLY pigs using our developed OpenArray 53-SNP panel. Out of the 53 SNPs, 28 passing QC were included in association analysis. These genotype data are deposited in the Dryad repository (http://dx.doi.org/10.5061/dryad.7kn7r).
The allelic effect of each SNP on phenotypic traits was tested using a general linear mixed model [37]. The model included a random polygenic effect, and the variance-covariance matrix was proportionate to genome-wide identity-by-state [38]. The formula of the model is given in a mathematic expression: , where Y is the vector of phenotypes; µ is the overall mean; b is the vector of fixed effects including sex and batch effects; w is the vector of slaughter weight of individuals considered as covariate; c is the vector of SNP effects with Erhualian allele substitute to White Duroc allele; a is the vector of random additive genetic effects with α∼N(0, Gσα2), where G is the genomic relationship matrix calculated from the corrected pedigree and σα2 is the polygenetic additive variance; k is the regression coefficient of slaughter weight and e is the vector of residual errors with e∼N(0, Iσe2), where I is the identity matrix and σe2 is the residual variance. X, S and Z are incidence matrices for b, w and c respectively. All single-marker GWAS were conducted by GenABEL packages [39].
The genome-wide significance threshold was determined by the Bonferroni method, in which the conventional P-value was divided by the number of tests performed [40]. A SNP was considered to have genome-wide significance at P<0.05/N and chromosome-wide significance at P<1/N, where N is the number of SNPs tested in the analyses. The genome-wide and chromosome-wide significant thresholds were respectively 1.27e-6 (0.05/39414) and 2.54e-5 (1/39414) for the F2 population, and 1.12e-6 (0.05/44560) and 2.24e-5 (1/44560) for the Sutai population. The phenotypic variance explained by the top SNPs was estimated by (Vreduce – Vfull)/Vreduce, where Vfull and Vreduce are residual variances of models for association analysis with and without SNP term, respectively.
The influence of population stratification was assessed by examining the distribution of test statistics generated from thousands of association tests and assessing their deviation from the null distribution (that expected under the null hypothesis of no SNP associated with the trait) in a quantile-quantile (Q-Q) plot [41]. The Q-Q plot was constructed using R software. Linkage disequilibrium (r2) was estimated for SNPs around the QTL region in the two populations by using PLINK v1.07 [36].
Muscle transcriptome data and eQTL mapping
Total RNA was extracted from longissimus dorsi muscle samples of 497 F2 animals using Trizol (Invitrogen). RNA quantity and integrity were assessed using a NanoDrop ND-1000 Spectrophotometer (Thermo Fisher Scientific) and a 2100 Bioanalyser (Agilent). Genome-wide transcripts were assayed by digital gene expression (DGE) system and data processing was conducted as described previously [11], [42]. In brief, the raw tags were first filtered to produce the clean tag data. For mapping clean tags to reference transcript sets or to the pig reference genome (Sus Scrofa Build 10.2) [35], we created virtual libraries containing all the possible 17-base length sequences of these resources located next to an NlaIII restriction site. The reference transcript sets were downloaded from the database of PEDE (Pig Expression Data Explorer; http://pede.dna.affrc.go.jp/) and pig unigene in NCBI (ftp://ftp.ncbi.nih.gov/repository/UniGene/Sus_scrofa/). The redundant transcripts overlapped between the two databases were removed from the reference transcript set. For monitoring the mapping events on both strands, virtual sense and antisense tag sequence databases were generated for both full gene and cDNA sequences using in-house Perl scripts. The clean tag sequences were then mapped using SOAP2 [43] allowing up to one mismatches in 21-bp tag sequences. Sense and antisense tag sequences that unsuccessfully mapped to reference transcripts or mapped to multiple genes were filtered. The number of clean tags that uniquely mapped to the reference transcript sequence of each gene was calculated and then normalized to TPM (number of tags mapped to each gene per million clean tags) as expression level of transcript.
The DGE data of 497 F2 animals were adjusted for gender, batch and kinship using a robust linear regression model [44]. Associations between gene expression levels and the RG phenotype were evaluated with Pearson correlation coefficient by R software. eQTL mapping was performed for the DGE profiles in 497 F2 animals using mixed linear model implemented by mmscore function of GenABEL in R package. Sex and batch were considered as fixed effects, and the genetic co-variances among samples were also taken into account by fitting kinship matrix derived from whole genome SNP genotypes. Bonferroni correction was applied to adjust the multiple tests. All the above mentioned analyses were carried out with R software.
Resequencing of the PHKG1 gene
The entire cDNA sequence of PHKG1 were determined by RT-PCR (reverse transcriptase-polymerase chain reaction) and RACE (rapid amplication of cDNA ends) analysis. First, RNA was extracted from skeletal muscle of 6 F2 pigs (2 of each QTL genotype) using Trizol (Invitrogen), then cDNA was synthesized using the PrimerScript RT reagent Kit With gDNA Eraser (Takara) for RT-PCR or the 5′ - & 3′ - Full Race Kits (Takara) for RACE. The corresponding primer pairs are listed in Table S8. To get full-length gene sequence, we amplified 14 overlapping segments from genomic DNA, using standard PCR condition and primers reported in Table S9. All PCR products were purified using the QIAquick PCR Purification Kit (Qiagen) and sequenced on both strands using the same primers and BigDye Terminator v3.1 Cycle Sequencing kits (Applied Biosystems) and a 3130 DNA Analyzer (Applied Biosystems). The sequence traces were assembled and analyzed for polymorphisms using the SeqMan program (DNASTAR).
Genotyping of the PHKG1 g.8283C>A mutation and association analysis
A 140-bp fragment (Figure 3C) encompassing the g.8283C>A mutation was amplified by PCR from genomic DNA using primers (PHKG1-F1 : 5′-ATC CCT GTG CTT GCT GGT G-3′; PHKG1-R1 : 5′-CCC GGC GGT ACT GGT AAT-3′), digested using enzyme TaqαI and size fractionated by 2% agarose gel electrophoresis. The A allele was represented by two fragments of 78 and 62 bp, and the C allele by uncut amplicons.
Association between the PHKG1 g. 8283C>A polymorphism and meat quality traits was calculated using the least square means method of GLM (General Linear Model) procedure in R software. For the F2 and Sutai populations (n = 930 and 434 respectively), sex and batch was included in the model as fix effects, carcass weight as a covariate. A total of 540 DLY pigs were genotyped for this mutation. The residual glycogen content and other meat quality traits were determined for muscle samples from 140 DLY pigs. The model for DLY included sex and harvest batch as fix effects, and carcass weight as a covariate.
The associations between SNP genotypes (i.e. ss131031160 SNP and PHKG1 g. 8283C>A) and expression levels of three genes (PHKG1, GUSB and SUMF2) were established by One-Way ANOVA analysis in R software. The relationship between the transcript level of PHKG1 and the RG content was calculated using Pearson correlation in R software.
Marker-assisted segregation analysis
QTL genotypes of 6 F1 boars in the F2 population and 3 Sutai F0 boars were determined by marker-assisted segregation analysis as described previously [45]. Briefly, a Z-score was calculated for each sire; the score is the log10 of the H1/H0 likelihood ratio where H1 assumes that the boar is heterozygous at the QTL (Qq), while H0 postulates that the boar is homozygous QQ or qq. Boars were considered to be Qq when Z>2, QQ or qq when Z <−2, and of undetermined genotype if −2<Z<2.
Quantitative RT-PCR and western blot analysis
Quantitative RT-PCR (qRT-PCR) reactions were performed in a final volume of 10 µl containing 1 µl of 2.5-fold diluted cDNA (corresponding to 20 ng of starting total RNA), 5 µl Power SYBR Green PCR Master Mix (Applied Biosystems), forward and reverse primers (2 pM each) and 3.6 µl free water. PCRs were conducted on an ABI7900HT instrument (Applied Biosystems) under the following cycling conditions: 10 min at 95°C followed by 40 cycles at 95°C for 15 sec and 60°C for 50 sec. Two primer sets Common-5'-FP/RP and Wt-3'-FP/RP (Figure 4A; Table S10) were used to respectively test total and wild-type transcript (Wt) levels of PHKG1. Beta Actin (ACTB) was included as endogenous controls. Expression of all assays was measured in triplicates and average values of the triplicates were used for the analysis. The quantification of transcripts was performed by the comparative Ct(2-ΔΔCt) method.
The presence of PHKG1 Wt transcript in animals with three QTL genotypes was assayed by RT-PCR using the primers 5′-CAC CCC AAC ATC ATA CAG CT-3′ and 5′-ACA GAA GCC AGC ACC GTC-3′ (RT-3'-RP). PCR products of 698-bp were electrophoresed on 1% agarose gel and visualized by UV illumination (Figure 4C).
Total protein from pig muscle tissue was extracted using a Protein Extraction Kit (Applygen). Protein samples separated on SDS-PAGE were transferred onto polyvinylidene difluoride membranes and incubated with rabbit anti-PHKG1 (Proteintech) and rabbit anti-mouse β-Actin (as loading control; Beijing Zhong Shan-Golden Bridge Biological Technology) antibodies. Anti-mouse or anti-rabbit secondary antibodies conjugated with horseradish peroxidase were used and visualized using chemiluminescent substrate (Tiangen Biotech).
Glycogen phosphorylase kinase (Phk) activity assay
Phk activity of 18 F2 animals were determined on their frozen muscle samples using Phk Colorimetric Assay kit (Genmed Scientifics) according to the manufacturer's instructions.
Splicing minigene reporter assay
Generation of minigene constructs
The splicing minigene assay was conducted as previously described [46]. Genomic DNA was isolated from an ear sample of an F2 pig with AA genotype at the PHKG1 g.8283C>A mutation site. The PHKG1 genomic DNA region of 926 bp from partial exon 8 to partial exon 10 was amplified using forward primer (5′-GAC AAG CTT GGA GCA CAG GGG TCA TCA TG-3′) and reverse primer (5′-AGT GGA TCC ACC CTC GCT CCG TTT CTG TG-3′), carrying 5′ tails with HindIII and BamHI restriction sites (underlined), respectively. After digestion with HindIII and BamHI enzymes, the PCR products were inserted into the pcDNA3.0 vectors (Invitrogen) with the cytomegalovirus promoter (PCMV). Substitution of adenine (A) to cytosine (C) at the PHKG1 g.8283C>A site was achieved by site-directed mutagenesis of the mutant expression vector using a QuickChang Site Directed Mutagenesis Kit (Stratagene) with a forward primer (5′-GTT CTC AGG CCC GGA CTC GCG CAG GTG ATC G-3′) and a reverse primer (5′-CAG AGC GAT CAC CTG CGC GAG TCC GGG-3′).
Transfection and RT-PCR analysis
The wild-type and mutant minigene constructs were transiently transfected into HeLa cells and 293T cells using Lipofectamine 2000 Transfection Reagent (invitrogen) for 4 h in Opti-MEM (Gibco) medium, according to manufacturer's instructions. Cells were then collected 36 h post-transfection. Total RNA was extracted using TRIzol reagent (Invitrogen). RT-PCR was performed using the PrimerScript RT reagent Kit With gDNA Eraser (Takara), and the forward primer F (5′-GGA AGT GCG TCA CTT CAG C-3′) and the reverse primer R (5′ - CGG CGG TAC TGG TAA TAG A-3′). RT-PCR products were separated by electrophoresis on 4% agarose gels containing ethidium bromide and visualized by exposure to ultraviolet light. Each DNA band was gel-extracted using the TIANgel Midi Purification Kit (TIANGEN) and sequenced using the Big Dye Terminator cycle sequencing kit (Applied Biosystems) on a 313XL capillary sequencer (Applied Biosystems). The expression levels of the PHKG1 minigenes and β-Actin were measured by quantitative real-time RT-PCR on an 7900HT thermal cycler (Applied Biosystems) as described above. The data were analyzed using the comparative Ct(2-ΔΔCt) method.
Supporting Information
Zdroje
1. HuZL, ParkCA, WuXL, ReecyJM (2013) Animal QTLdb: an improved database tool for livestock animal QTL/association data dissemination in the post-genome era. Nucleic Acids Research 41: D871–D879.
2. RenJ, MaoH, ZhangZ, XiaoS, DingN, et al. (2011) A 6-bp deletion in the TYRP1 gene causes the brown colouration phenotype in Chinese indigenous pigs. Heredity (Edinb) 106 : 862–868.
3. RubinCJ, ZodyMC, ErikssonJ, MeadowsJR, SherwoodE, et al. (2010) Whole-genome resequencing reveals loci under selection during chicken domestication. Nature 464 : 587–591.
4. RubinCJ, MegensHJ, Martinez BarrioA, MaqboolK, SayyabS, et al. (2012) Strong signatures of selection in the domestic pig genome. Proc Natl Acad Sci U S A 109 : 19529–19536.
5. AnderssonL, GeorgesM (2004) Domestic-animal genomics: deciphering the genetics of complex traits. Nat Rev Genet 5 : 202–212.
6. GeorgesM (2007) Mapping, fine Mapping, and molecular dissection of quantitative trait loci in domestic animals. Annu Rev Genomics Hum Genet 8 : 131–162.
7. RenJ, DuanY, QiaoR, YaoF, ZhangZ, et al. (2011) A Missense Mutation in PPARD Causes a Major QTL Effect on Ear Size in Pigs. PLoS Genet 7: e1002043.
8. SchadtEE, LambJ, YangX, ZhuJ, EdwardsS, et al. (2005) An integrative genomics approach to infer causal associations between gene expression and disease. Nat Genet 37 : 710–717.
9. AyrolesJF, CarboneMA, StoneEA, JordanKW, LymanRF, et al. (2009) Systems genetics of complex traits in Drosophila melanogaster. Nat Genet 41 : 299–307.
10. TuZ, KellerMP, ZhangC, RabagliaME, GreenawaltDM, et al. (2012) Integrative analysis of a cross-loci regulation network identifies App as a gene regulating insulin secretion from pancreatic islets. PLoS Genet 8: e1003107.
11. ChenC, YangB, ZengZ, YangH, LiuC, et al. (2013) Genetic dissection of blood lipid traits by integrating genome-wide association study and gene expression profiling in a porcine model. BMC Genomics 14 : 848.
12. PonsuksiliS, MuraniE, SchwerinM, SchellanderK, WimmersK (2010) Identification of expression QTL (eQTL) of genes expressed in porcine M. longissimus dorsi and associated with meat quality traits. BMC Genomics 11 : 572.
13. PonsuksiliS, JonasE, MuraniE, PhatsaraC, SrikanchaiT, et al. (2008) Trait correlated expression combined with expression QTL analysis reveals biological pathways and candidate genes affecting water holding capacity of muscle. BMC Genomics 9 : 367.
14. CorominasJ, Ramayo-CaldasY, Puig-OliverasA, Perez-MontareloD, NogueraJL, et al. (2013) Polymorphism in the ELOVL6 gene is associated with a major QTL effect on fatty acid composition in pigs. PLoS One 8: e53687.
15. HamiltonDN, MillerKD, EllisM, McKeithFK, WilsonER (2003) Relationships between longissimus glycolytic potential and swine growth performance, carcass traits, and pork quality. J Anim Sci 81 : 2206–2212.
16. WulfDM, EmnettRS, LeheskaJM, MoellerSJ (2002) Relationships among glycolytic potential, dark cutting (dark, firm, and dry) beef, and cooked beef palatability. J Anim Sci 80 : 1895–1903.
17. BurwinkelB, HuB, SchroersA, ClemensPR, MosesSW, et al. (2003) Muscle glycogenosis with low phosphorylase kinase activity: mutations in PHKA1, PHKG1 or six other candidate genes explain only a minority of cases. Eur J Hum Genet 11 : 516–526.
18. CiobanuD, BastiaansenJ, MalekM, HelmJ, WoollardJ, et al. (2001) Evidence for new alleles in the protein kinase adenosine monophosphate-activated gamma(3)-subunit gene associated with low glycogen content in pig skeletal muscle and improved meat quality. Genetics 159 : 1151–1162.
19. MilanD, JeonJT, LooftC, AmargerV, RobicA, et al. (2000) A mutation in PRKAG3 associated with excess glycogen content in pig skeletal muscle. Science 288 : 1248–1251.
20. DuanYY, MaJW, YuanF, HuangLB, YangKX, et al. (2009) Genome-wide identification of quantitative trait loci for pork temperature, pH decline, and glycolytic potential in a large-scale White Duroc x Chinese Erhualian resource population. J Anim Sci 87 : 9–16.
21. RamosAM, CrooijmansRP, AffaraNA, AmaralAJ, ArchibaldAL, et al. (2009) Design of a high density SNP genotyping assay in the pig using SNPs identified and characterized by next generation sequencing technology. PLoS One 4: e6524.
22. RoscignoRF, WeinerM, Garcia-BlancoMA (1993) A mutational analysis of the polypyrimidine tract of introns. Effects of sequence differences in pyrimidine tracts on splicing. J Biol Chem 268 : 11222–11229.
23. GhazalpourA, BennettB, PetyukVA, OrozcoL, HagopianR, et al. (2011) Comparative analysis of proteome and transcriptome variation in mouse. PLoS Genet 7: e1001393.
24. WuL, CandilleSI, ChoiY, XieD, JiangL, et al. (2013) Variation and genetic control of protein abundance in humans. Nature 499 : 79–82.
25. BaliDS, GoldsteinJL, FredricksonK, RehderC, BoneyA, et al. (2013) Variability of disease spectrum in children with liver phosphorylase kinase deficiency caused by mutations in the PHKG2 gene. Mol Genet Metab 111(3): 309–13.
26. Goldstein J, Austin S, Kishnani P, Bali D (1993) Phosphorylase Kinase Deficiency. In: Pagon RA, Adam MP, Bird TD, Dolan CR, Fong CT et al., editors. GeneReviews. Seattle (WA).
27. PreislerN, OrngreenMC, Echaniz-LagunaA, LaforetP, Lonsdorfer-WolfE, et al. (2012) Muscle phosphorylase kinase deficiency: a neutral metabolic variant or a disease? Neurology 78 : 265–268.
28. WehnerM, ClemensPR, EngelAG, KilimannMW (1994) Human muscle glycogenosis due to phosphorylase kinase deficiency associated with a nonsense mutation in the muscle isoform of the alpha subunit. Hum Mol Genet 3 : 1983–1987.
29. AchouitarS, GoldsteinJL, MohamedM, AustinS, BoyetteK, et al. (2011) Common mutation in the PHKA2 gene with variable phenotype in patients with liver phosphorylase b kinase deficiency. Mol Genet Metab 104 : 691–694.
30. LongYC, BarnesBR, MahlapuuM, SteilerTL, MartinssonS, et al. (2005) Role of AMP-activated protein kinase in the coordinated expression of genes controlling glucose and lipid metabolism in mouse white skeletal muscle. Diabetologia 48 : 2354–2364.
31. AnderssonL (2003) Identification and characterization of AMPK gamma 3 mutations in the pig. Biochem Soc Trans 31 : 232–235.
32. CostaLN, FiegoDPL, PantanoA, RussoV (1998) Relationship between glycolytic potential and technological quality of meat and dry-cured Parma ham in the Italian heavy pig. CIHEAM - Options Mediterraneennes 999 : 227–231.
33. GuoY, MaoH, RenJ, YanX, DuanY, et al. (2009) A linkage map of the porcine genome from a large-scale White Duroc x Erhualian resource population and evaluation of factors affecting recombination rates. Anim Genet 40 : 47–52.
34. MaJ, RenJ, GuoY, DuanY, DingN, et al. (2009) Genome-wide identification of quantitative trait loci for carcass composition and meat quality in a large-scale White Duroc x Chinese Erhualian resource population. Anim Genet 40 : 637–647.
35. GroenenMA, ArchibaldAL, UenishiH, TuggleCK, TakeuchiY, et al. (2012) Analyses of pig genomes provide insight into porcine demography and evolution. Nature 491 : 393–398.
36. PurcellS, NealeB, Todd-BrownK, ThomasL, FerreiraMA, et al. (2007) PLINK: a tool set for whole-genome association and population-based linkage analyses. Am J Hum Genet 81 : 559–575.
37. YuJ, PressoirG, BriggsWH, Vroh BiI, YamasakiM, et al. (2006) A unified mixed-model method for association mapping that accounts for multiple levels of relatedness. Nat Genet 38 : 203–208.
38. HayesBJ, GoddardME (2008) Technical note: prediction of breeding values using marker-derived relationship matrices. J Anim Sci 86 : 2089–2092.
39. AulchenkoYS, RipkeS, IsaacsA, van DuijnCM (2007) GenABEL: an R library for genome-wide association analysis. Bioinformatics 23 : 1294–1296.
40. YangQ, CuiJ, ChazaroI, CupplesLA, DemissieS (2005) Power and type I error rate of false discovery rate approaches in genome-wide association studies. BMC Genet 6 Suppl 1S134.
41. PearsonTA, ManolioTA (2008) How to interpret a genome-wide association study. JAMA 299 : 1335–1344.
42. ChenC, WeiR, QiaoR, RenJ, YangH, et al. (2012) A genome-wide investigation of expression characteristics of natural antisense transcripts in liver and muscle samples of pigs. PLoS One 7: e52433.
43. LiR, YuC, LiY, LamTW, YiuSM, et al. (2009) SOAP2: an improved ultrafast tool for short read alignment. Bioinformatics 25 : 1966–1967.
44. LourencoVM, PiresAM, KirstM (2011) Robust linear regression methods in association studies. Bioinformatics 27 : 815–821.
45. NezerC, ColletteC, MoreauL, BrouwersB, KimJJ, et al. (2003) Haplotype sharing refines the location of an imprinted quantitative trait locus with major effect on muscle mass to a 250-kb chromosome segment containing the porcine IGF2 gene. Genetics 165 : 277–285.
46. GaildratP, KillianA, MartinsA, TournierI, FrebourgT, et al. (2010) Use of splicing reporter minigene assay to evaluate the effect on splicing of unclassified genetic variants. Methods Mol Biol 653 : 249–257.
47. TamuraK, StecherG, PetersonD, FilipskiA, KumarS (2013) MEGA6: Molecular Evolutionary Genetics Analysis version 6.0. Mol Biol Evol 30 : 2725–2729.
Štítky
Genetika Reprodukční medicínaČlánek vyšel v časopise
PLOS Genetics
2014 Číslo 10
Nejčtenější v tomto čísle
- The Master Activator of IncA/C Conjugative Plasmids Stimulates Genomic Islands and Multidrug Resistance Dissemination
- A Splice Mutation in the Gene Causes High Glycogen Content and Low Meat Quality in Pig Skeletal Muscle
- Keratin 76 Is Required for Tight Junction Function and Maintenance of the Skin Barrier
- A Role for Taiman in Insect Metamorphosis