
Abnormal Dosage of Ultraconserved Elements Is Highly Disfavored in Healthy Cells but Not Cancer Cells
Ultraconserved elements (UCEs) display a level of sequence conservation that has defied explanation. They are also dosage sensitive, being depleted from copy number variants (CNVs) in healthy cells. Here we address the process underlying this dosage sensitivity in order to gain insights into the way that UCE dosage affects cells. Our studies demonstrate that, in contrast to CNVs inherited by healthy individuals, cancer-specific CNVs are, as a rule, not depleted for UCEs and may even be enriched. Furthermore, by discovering that CNVs arising anew in the healthy, as opposed to diseased, body are depleted of UCEs, we obtain evidence that healthy cells may be responsive to changes in UCE dosage in a way that is disrupted in cancer cells. After examining CNVs over time in cell culture, we postulate that selection against UCE-disrupting CNVs in healthy cells acts rapidly, raising the surprising possibility of exploring in cell culture how UCE dosage sensitivity may explain ultraconservation. Our observations suggest that an understanding of the different responses of healthy and cancer cells to changes in UCE dosage could be harnessed to address genomic instabilities in cancer.
Published in the journal:
. PLoS Genet 10(10): e32767. doi:10.1371/journal.pgen.1004646
Category:
Research Article
doi:
https://doi.org/10.1371/journal.pgen.1004646
Summary
Ultraconserved elements (UCEs) display a level of sequence conservation that has defied explanation. They are also dosage sensitive, being depleted from copy number variants (CNVs) in healthy cells. Here we address the process underlying this dosage sensitivity in order to gain insights into the way that UCE dosage affects cells. Our studies demonstrate that, in contrast to CNVs inherited by healthy individuals, cancer-specific CNVs are, as a rule, not depleted for UCEs and may even be enriched. Furthermore, by discovering that CNVs arising anew in the healthy, as opposed to diseased, body are depleted of UCEs, we obtain evidence that healthy cells may be responsive to changes in UCE dosage in a way that is disrupted in cancer cells. After examining CNVs over time in cell culture, we postulate that selection against UCE-disrupting CNVs in healthy cells acts rapidly, raising the surprising possibility of exploring in cell culture how UCE dosage sensitivity may explain ultraconservation. Our observations suggest that an understanding of the different responses of healthy and cancer cells to changes in UCE dosage could be harnessed to address genomic instabilities in cancer.
Introduction
Ultraconservation came to light when Bejerano et al. reported that their comparison of the reference genomes of human, mouse, and rat had revealed an unexpected 481 orthologous genomic regions that are ≥200 bp in length and 100% identical in sequence [1], each of which is unique in the reference human genome [1], [2]. Ten years later, we still lack a compelling explanation for why these sequences, called ultraconserved elements (UCEs), have been so extremely conserved for hundreds of millions of years – neither enhancers, nor transcription factor binding sites, nor promoters, nor protein coding regions require such a high level of conservation [1], [3]–[8]. Despite this, and because roughly half of UCEs are intronic and one third are intergenic, a popular expectation is that UCEs will be found to embody important regulatory activities; indeed, they are thought to be maintained by purifying selection [9]–[16], and numerous UCEs are able to direct tissue-specific transcription when coupled with a reporter construct, while some have been shown to function endogenously as enhancers [4], [17]–[24]. UCE sequences can also contain various transcription factor binding motifs [6], [25] and bind multiple transcription factor proteins [26]. Ultraconservation could also be explained by a mechanism of comparison between pairs of UCEs. Here, the two copies of each UCE in a diploid cell, one on each of two homologous chromosomes, physically interact and then undergo sequence comparison, wherein discrepancies in DNA sequence or copy number, or disruptions of genome organization that compromise interactions, would be sensed and result in loss of fitness through disease or reduced fertility [2], [25], [27]. Such a mechanism would, over time, tend to cull away variants in UCE sequence or copy number, maintaining the extreme DNA conservation that characterizes UCEs. Importantly, there is growing evidence for the potential of homologous chromosomal regions to support at least transient, if not extensive, pairing in somatic cells [28]–[38] as well as in meiotic cells.
Interestingly, we and others have found that UCEs are much less likely to be deleted or duplicated via copy number variants (CNVs) in healthy individuals than would be expected by chance [2], [25], [39], consistent with their depletion from segmental duplications [2] and remarkable resistance to loss from mammalian genomes [40]. In contrast, they are enriched in 26 deletions and duplications representing 200 patients with neurodevelopmental disorders [41]. An association between UCEs and disease was also demonstrated [42] in a study that assembled a database of ‘cancer-associated genomic regions’ from a literature search for terms associated with cancer [43], and several publications have highlighted possible roles for the transcription of specific UCEs in cancer [44]–[51].
In sum, the basis of ultraconservation remains unclear. Indeed, it has been suggested that UCEs represent nothing more than an unexceptional tail end of a distribution of conservation [4]. Regardless, the apparent dosage sensitivity of UCEs remains intriguing, especially in light of the dosage sensitivity of many genomic functions whose importance has been well established [52]–[55]. Therefore, leaving aside the specific issue of ultraconservation, this report focuses on the dosage sensitivity of UCEs, with special emphasis on the time frame in which it is sensed. It takes advantage of 37 datasets of CNVs representing whole genome array-based or sequence-based analyses, and it begins with a demonstration that the most recently published datasets of CNVs representing healthy individuals are depleted for UCEs and that this depletion is robust to the mammalian species used to define UCEs. Importantly, we see that even de novo CNVs, which could have passed through the germline meiotic process at most once, are depleted of UCEs. This implies that CNVs need not be inherited through multiple generations to be depleted of UCEs. We then examine CNVs that have arisen in the soma, specifically in cancer cells, and discover that they are overall not depleted for UCEs. What is the basis by which CNVs in healthy people are depleted of UCEs, whereas cancer-specific CNVs display the opposite propensity? One possibility is that CNVs formed in the soma differ from those that are inherited across generations. Alternatively, CNVs specific to cancer may occur in positions that differ from those of CNVs found in healthy cells. To resolve this, we turn to CNVs that arise in healthy, as opposed to diseased, soma. We find that healthy somatic CNVs are depleted for UCEs, just as are CNVs inherited through the germline. This suggests that the profile of cancer specific CNVs reflects the diseased state, and not simply their somatic origin. Finally, to address how de novo and somatic CNVs of healthy individuals become depleted for UCEs, we examine the relationship, over time, between UCEs and CNVs in induced pluripotent stem (iPS) cells. Our results suggest that CNVs that have deleted or duplicated UCEs may be selectively removed from cell populations and that this process may underlie the UCE-depleted profile of CNVs present in healthy, but not cancer, cells.
Results
Depletion of UCEs from CNVs is seen in all inherited CNV datasets representing healthy individuals
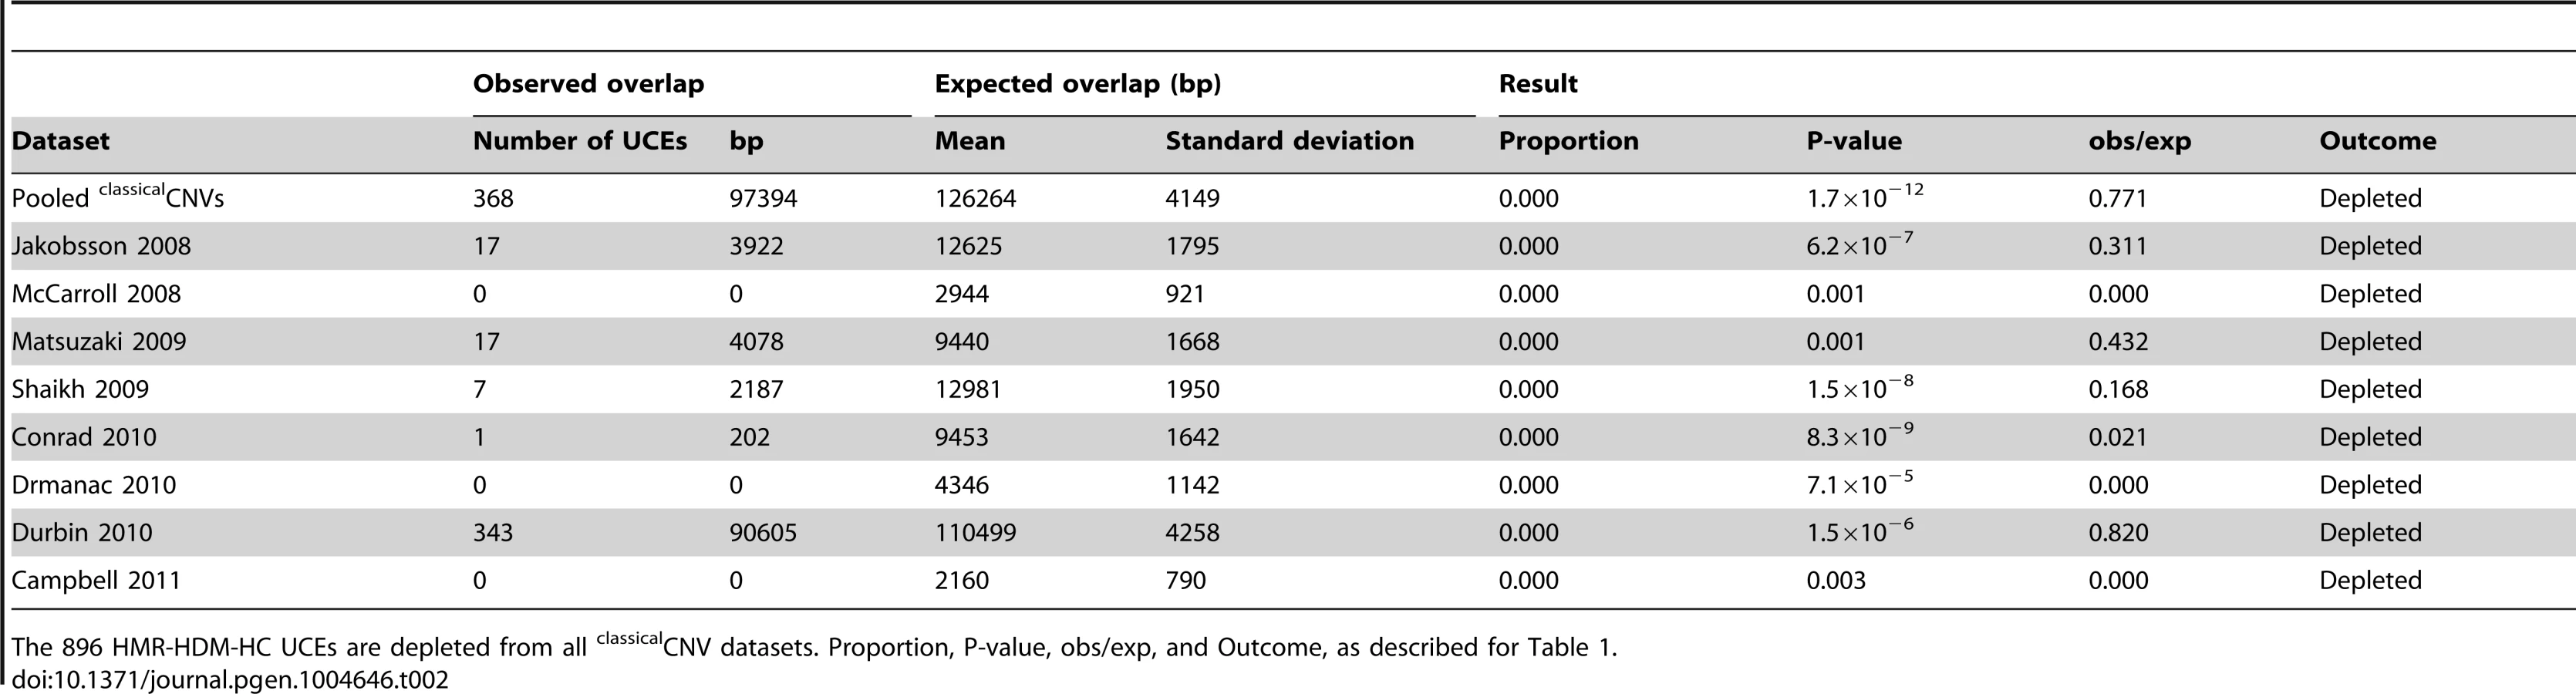
We previously showed that UCEs are significantly depleted from CNVs in humans, with no overlap whatsoever between the positions of UCEs and CNVs in some cases, while, in other cases, the overlap was modest [2], [25]. There are three possible explanations that can account for these results: Firstly, CNVs could be completely excluded from forming in the vicinity of UCEs, and any overlap seen could be the result of inaccuracies in CNV mapping. Secondly, CNVs could be less likely to form in the vicinity of UCEs. Thirdly, CNVs may form in the vicinity of UCEs as much as expected by chance, but selective processes may then remove these CNVs from populations because they are deleterious, resulting in a depleted CNV profile over time. To help distinguish between these possibilities, we began our studies by determining whether, and to what extent, UCEs are depleted from six recent large scale high quality datasets of predominantly inherited CNVs representing healthy individuals (Matsuzaki et al. [56], Shaikh et al. [57], Conrad et al. [39], Drmanac et al. [58], Durbin et al. [59], and Campbell et al. [60]), including those obtained through next-generation sequencing [58], [59]. In order to facilitate comparison between the current and earlier studies, we also included two datasets that had been previously examined (Jakobsson et al. [61] and McCarroll et al. [62]). We call all these CNVs, which were discovered in healthy individuals without being specified as somatic or germline in origin, classicalCNVs (Fig. 1A). The eight individual classicalCNV datasets consist of between 1,183 and 46,716 regions and encompass between 0.83% and 45.25% of the human genome, a range in genome coverage that is not unexpected for datasets produced by studies that differ widely in their detection methods and sensitivity and in the number of subjects included. The datasets were considered individually as well as combined into a pooled classicalCNV dataset consisting of 43,727 CNV regions and covering 51.37% of the human genome (for more details, see Table S1).

Regarding the UCEs, the majority of our analyses were carried out with a set of UCEs we had previously defined [2]. This set of UCEs consists of sequences that are ≥200 bp in length and identical between the reference genomes of human, mouse, and rat (HMR), or of human, dog, and mouse (HDM), or of human and chicken (HC), producing a set of 896 (HMR-HDM-HC UCEs) UCEs in total [2]. We also generated two new UCE datasets without involvement of the human genome in order to ascertain whether the depletion of UCEs from CNVs is robust to the inclusion of UCEs selected without involvement of, and thus without perfect sequence identity to, sequences in the human genome. This strategy defined 527 UCEs using the reference genomes for dog, mouse, and rat (DMR) and another 1,696 UCEs using the reference genomes for cow, dog, and horse (CoDHo), all while maintaining the length and identity requirements of ≥200 bp and 100%, respectively (Figure S1, Methods). As the DMR and CoDH datasets involve only three species, while our original HMR-HDM-HC dataset involved four mammalian and one bird species, we assembled one additional dataset of 481 UCEs, this one using just the three reference genomes of human, mouse, and rat (HMR), as did Bejerano et al. when they defined the first UCE dataset [1]. Each of these four UCE datasets was studied in its entirety and, to parallel earlier work, subdivided into intergenic, intronic, and exonic subclasses; such earlier studies demonstrated that depletion is driven primarily by the intronic and intergenic UCEs, with evidence for that depletion being due to UCEs, per se, rather than flanking genetic regions or genes [2], [25].
Using a protocol established in earlier studies, we then determined whether UCEs are depleted in CNV datasets [2], [25]. We compared the observed amount of overlap in base pairs between a set of CNVs and a set of UCEs to the expected overlap, as determined by a randomly placed set of elements matched to UCEs in terms of element number and length. In particular, the elements of the matched set were placed randomly on the genome 1,000 times, and the overlap between the random elements and CNVs was calculated each time, thus producing a distribution of the randomly generated expected overlaps. To provide a measurement of the difference between the distribution of expected overlaps and the observed overlap, we reported the proportion of expected overlaps that were equal to, or more extreme than, the observed overlap. The distribution of expected overlaps was assessed for normality using the Kolomogorov-Smirnov (KS) test, and the associated KS P-value is included in all supplementary tables. Normality was observed in 263 of 318 (83%) of analyses and, whenever observed, the distribution of expected overlaps was compared to the observed overlap using a Z-test, wherein a significant result, together with a ratio of observed overlap to mean expected overlap (obs/exp) falling below 1.0 indicated significant depletion. Such an outcome would mean that the overlap between UCEs and CNVs is significantly lower than would be expected by chance, given the number, size, position, and genome coverage of the CNVs at hand. In cases where normality was not observed, we noted this in the text and reported only the obs/exp ratio and the proportion of expected overlaps that were equal to, or more extreme than, the observed overlap. This protocol ensured that each analysis was tailored to its own CNV dataset, enabling the meaningful comparisons of datasets that differ in terms of CNV number, size distribution, position, and genome coverage.
For pooled classicalCNVs, significant depletion was observed for all UCE datasets, with all values for obs/exp falling below 1.0 (P-values from <1.0×10⁻¹⁷ to 0.001, obs/exp from 0.771 to 0.867, Table 1 and Table S2). All individual classicalCNV datasets with normally distributed expected overlaps also showed significant depletion (8.8×10⁻¹⁵ ≤P≤0.020, 0.000≤ obs/exp ≤0.887, see Table 2 for HMR-HDM-HC UCEs, and Table S2 for all UCE sets); in three analyses, namely those addressing the DMR UCEs with respect to the McCarroll 2008 classicalCNV dataset, the Durbin 2010 clasicalCNV dataset, and the Campbell 2011 classicalCNV dataset, depletion could not be ascertained because the expected overlaps were not normally distributed (Table S2). As in previous studies, some analyses yielded 0 bp of overlap between UCEs and CNVs (e.g., HMR-HDM-HC UCEs and McCarroll 2008 [62], Drmanac 2010 [58], and Campbell 2011 [60]), while others showed some degree of overlap, with obs/exp ratios ranging from 0.021 to 0.887. The presence of multiple high quality datasets with non-zero overlaps between UCEs and CNVs led us to reject the first explanation, wherein CNVs are completely excluded mechanistically from forming at UCE regions and any observed overlaps are due to errors in mapping CNVs.

Note that depletion was also observed in many datasets when UCEs were separately analyzed as intergenic, intronic, and exonic elements (see Materials and methods for details on categorization of UCEs by genic location), with the intergenic and intronic classes driving depletion overall and the larger HMR-HDM-HC and CoDHo datasets showing stronger depletion (Table S2). While depletion was also observed with exonic UCEs, it was somewhat less consistent as that found with intronic and intergenic UCEs. The agreement of these results with our previous studies demonstrates that the depletion of UCEs from CNVs is a robust phenomenon and, hence, not dependent on 100% sequence identity between humans and other chosen species, extending our earlier observations [2], [25]. Accordingly, except where noted, all subsequent analyses in this study used the 896 UCEs of the HMR-HDM-HC dataset.
Newly formed de novo CNVs are depleted for UCEs
Having eliminated the first explanation for depletion of UCEs from CNVs, we turned our attention to the two remaining possible explanations, which are not necessarily mutually exclusive; that CNVs are less likely to form in the vicinity of UCEs, and/or CNVs involving UCEs result in loss of fitness and are subsequently culled from the population. As some CNVs are recent enough to be polymorphic between individuals and even mosaic within individuals [63]–[68], the latter explanation would further suggest culling to be a relatively rapid process. We addressed these possibilities by seeking situations in which CNVs are not depleted for UCEs. If found, they would argue against CNVs being less likely as a rule to form near UCEs and, in addition, might permit us to estimate how rapidly CNVs are culled when they do involve UCEs. Accordingly, we turned to de novo CNVs, which are regions of copy number variation that are present in the soma of an individual but not in the soma of either parent. Leaving aside the possibilities of false positive regions (discussed in the Materials and methods), the oldest of such variants could have formed in the germline precursors of a parent and therefore passed no more than once through a germline. The youngest of such variants would include those that formed in the soma of an individual and are therefore less than one generation old, with no involvement of the germline (Materials and methods). We reasoned that these CNVs, which we call de nov°CNVs (Fig. 1B), may be so recent as to not yet have been culled of deletions and duplications that involve UCEs, if indeed UCE depletion results from a culling mechanism. In contrast, all classicalCNV datasets considered thus far in this report likely contain CNVs of varied ages, ranging from very newly formed CNVs arising within an individual's soma, to CNVs that have passed through the germline across many generations.
Four de nov°CNV datasets satisfied our criteria for further study (Xu et al. [69], Itsara et al. [70], Malhotra et al. [71], and Sanders et al. [72], detailed in Table S1); they represent studies using primary tissues as the source of DNA and requiring each de nov°CNV to have been validated by a second, independent method, such as Sanger sequencing (Materials and methods). While these studies examined patients with schizophrenia [69], [71] or autism [70], [72], they also included healthy individuals as controls, and it is the CNVs from healthy individuals that we used for our analysis. One study [70] included asthmatic individuals as healthy controls, and we did likewise. Because the four de nov°CNV datasets are small in terms of genomic coverage (0.05%–0.45%, Table S1), falling below our 20 Mb minimum requirement (see Table S3 section A for further discussion), we aggregated them into a pooled de nov°CNV dataset, including 25 CNVs covering 0.93% of the human genome (Table S1). Remarkably, this set of de nov°CNVs is significantly depleted of UCEs (P = 0.044, obs/exp = 0.395, Table 3, Table S4 section A). Having discovered that even newly formed CNVs are depleted of UCEs, it remained possible that CNVs may be mechanistically biased against forming in the vicinity of UCEs. We therefore extended our search for CNV datasets that are not depleted for UCEs by turning to studies of CNVs associated with disease.

It is tempting to compare the obs/exp ratio of 0.395 (Table 3) for depletion of HMR-HDM-HC UCEs from pooled de nov°CNVs to the equivalent obs/exp ratio of 0.771 (Table 2) for depletion from pooled classicalCNVs and conclude that UCE depletion from de nov°CNVs is more extreme than from classicalCNVs. Note, however, that the obs/exp ratios for the individual classicalCNV datasets varied from 0.000 to 0.820 (Table 2). Given this wide range of values, the obs/exp ratio for pooled de nov°CNVs of 0.395 is not remarkably low.
Copy number changes in cancer cells are enriched for UCEs
Our prediction that deletions and duplications of UCEs would reduce fitness [2], [25] argued that diseased tissues might yield datasets that are not depleted of UCEs. Consistent with this argument, UCEs have since been correlated with CNVs associated with diseases, including neurodevelopmental disorders [41] and cancer [42]. Here, we determined whether deletions and duplications found specifically in cancer cells are depleted of UCEs. Because such copy number changes are specific for the diseased, as versus healthy, tissues of an affected individual, they are believed to represent somatic events and, to highlight this difference from classicalCNVs, they are called copy number alterations, or CNAs [73]. In this report, we use cancerCNAs to denote CNAs that were found specifically in cancerous tissues, and, as explained below, were also recurrent in multiple patients (Fig 1C).
For quality control, we required that cancerCNA datasets represent studies wherein cancer genomes were defined relative to the genome of healthy tissues from the same patient. This strategy maximized the likelihood that our cancerCNA datasets reflect alterations that arose within the affected individuals' lifetimes and specifically in cancerous tissues, thereby minimizing inclusion of classicalCNVs. Additionally, as cancerCNAs that are recurrent in multiple patients are considered more likely to be causal “drivers” of disease, while non-recurrent ones are more likely to be merely “passengers” [73], we only included recurrent aberrations in our cancerCNA datasets, identified as such using the GISITC [74] or RAE [75] algorithms, or our own analyses of recurrence (Materials and methods).
In total, we assembled seventeen datasets from The Cancer Genome Atlas Research Network (TCGARN) et al. [76], Walter et al. [77], Beroukhim et al. [73], Bullinger et al. [78], Taylor et al. [79], TCGARN et al. [80], Curtis et al. [81], TCGARN et al. [82], TCGARN et al. [83], TCGARN et al. [84], Nik-Zainal et al. [85], Robinson et al. [86], Walker et al. [87], Zhang et al. [88], Holmfeldt et al. [89], TCGARN et al. [90], and Weischenfeldt et al. [91] representing 52 different forms of cancer, each including between 2 and 148 cancerCNA regions and covering 0.03% to 90.15% of the genome (Table S1). To avoid confounding our analysis with whole chromosome anueploidies, which are common in cancer genomes, we also followed convention [73] and excluded any cancerCNA region that is larger than 50% of the chromosome arm on which it resides. The datasets were analyzed individually, except for Bullinger 2010 [78], Nik-Zainal 2012 [85], Holmfeldt 2013 [89], and Weischenfeldt 2013 [91], which are too small to be considered on their own (Table S3). We also pooled all datasets except one to produce our pooled cancerCNA dataset; the Walker 2012 [87] dataset was excluded because it covers 90.15% of the genome and was therefore considered too large to be combined informatively with other datasets. Conveniently, two studies, Curtis et al. [81] and Walker et al. [87], also assembled datasets of classicalCNVs identified in nondiseased tissue of the patients used to identify cancerCNAs. While the Curtis et al. [81] classicalCNV dataset was too small to be examined by our methods (Table S3), we found significant depletion of the Walker et al. [87] classicalCNV dataset, which represents 1,841 regions and covers 42.11% of the genome (Table S1; P = 0.008, obs/exp = 0.903, Table S4 section B). This result gave us further confidence in the quality of the cancerCNA datasets.
Turning to the cancerCNA datasets themselves, we then observed a striking contrast to classicalCNVs and de nov°CNVs: of the 13 individual datasets large enough to be examined individually, all but two failed to show depletion for UCEs, as did the pooled cancerCNA dataset (Table 3 and Table S4 section B; the TCGARN 2012 colon dataset [83] and the TCGARN 2013 dataset [90] showed depletion with P = 0.028, obs/exp = 0.680 and P = 0.003, obs/exp = 0.738 respectively). Indeed, as the values for obs/exp rose above 1.0 for several datasets, we converted to a two-tailed test (P≤0.025 in each tail for an overall α of 0.05) to detect potential enrichment (obs/exp>1.0) as well as depletion (obs/exp <1.0) for UCEs and discovered that our pooled dataset as well as five individual cancerCNA datasets are significantly enriched for UCEs (3.0×10⁻⁹ ≤P≤0.016, 1.031≤ obs/exp ≤1.580, Table 3 and Table S4 section B). Furthermore, one of the datasets that had previously shown depletion was no longer significantly depleted (TCGARN 2012 colon [83]; P = 0.028, obs/exp = 0.680, Table 3 and Table S4 section B) when using a two-tailed test.
Importantly, large genome coverage and CNA size are unlikely to explain enrichment or loss of depletion of UCEs in cancerCNA datasets, and three findings support this statement. First, the broad range of genome coverage for cancerCNA datasets showing enrichment or loss of depletion (from 90.15% for Walker 2012 cancerCNAs to 3.86% for TCGARN 2012 colon cancerCNAs) overlaps that for datasets that are depleted of UCEs (from 51.37% for pooled classicalCNVs to 0.83% for Campbell 2011 classicalCNVs), arguing that genome coverage alone cannot easily account for our observations of enrichment or depletion (Tables 2 and 3, S1, S2, and S4). Second, depletion is maintained when the boundaries of each CNV of the Jakobsson 2008 classicalCNV and Campbell 2011 classicalCNV datasets are extended on each side by 4.0 and 2.5 Mb, respectively (P = 0.007, obs/exp = 0.968 and P = 0.003, obs/exp = 0.952, respectively), such that the 85.86% and 74.73% genome coverages of these enlarged datasets approach or exceed the genome coverages of the two largest cancerCNA datasets (90.15% for Walker 2012 cancerCNAs and 63.81% for pooled cancerCNAs; Table S1), once again indicating that high genome coverage is highly unlikely to produce false signals of enrichment or loss of depletion (Table S3 section B). We note, however, that as the genome coverage of the Walker 2012 cancerCNA dataset is extremely high and exceeds the genome coverage of the enlarged classicalCNV datasets, we cannot rule out some contribution of genome coverage to the enrichment of this specific dataset. Third, these analyses also reveal that depletion is maintained even when the median length of enlarged CNVs (3.485 Mb and 8.379 Mb for Jakobsson 2008 classicalCNVs and Campbell 2011 classicalCNVs, respectively) exceeds the largest median CNA size for any enriched cancerCNA dataset in question (3.183 Mb for TCGARN 2012 squamous cancerCNAs), demonstrating that observations of UCE enrichment are unlikely to be explained simply by median CNA size (Tables S1 and S3 section B).
Taken together, our observations reveal a feature that distinguishes the classicalCNV and de nov°CNV datasets from those of cancerCNAs. While the former two are characterized by a depletion of UCEs, not only do the cancerCNA datasets generally fail to show depletion, several are enriched for UCEs. This dichotomy may be explained by differences in the mutational landscapes and/or selective forces between healthy and cancer cells, with healthy cells displaying a bias against CNVs in the vicinity of UCEs, and cancer cells being biased toward disruption of UCEs by CNVs. Whether nondepletion and/or enrichment will prove to be a universal signature of cancerCNAs remains to be determined, the depletion of UCEs from one cancerCNA dataset (TCGARN 2013 [90]) suggesting that the story will be more complex, perhaps reflecting tissue or cancer specificity. At the least, our findings argue that the depletion of UCEs that characterizes many CNV datasets is unlikely to reflect an intrinsic inability, across all cell types, of CNVs to form in the vicinity of UCEs.
Intronic UCEs drive the enrichment of UCEs in cancerCNAs
We have also analyzed the enrichment of UCEs in cancerCNA datasets while treating intergenic, intronic, and exonic UCEs separately (Table S4 section B). Of these three UCE classes, only the intronic UCEs are enriched in pooled cancerCNAs (P = 9.4×10⁻⁵, obs/exp = 1.140), the intergenic and exonic UCEs showing neither depletion nor enrichment (P = 0.153, obs/exp = 1.045 and P = 0.446, obs/exp = 1.007, respectively; Table S4 section B). At the level of the five individual cancerCNA datasets showing enrichment, we observed enrichment for both intronic and intergenic, but not exonic, UCEs. To better understand the basis for enrichment, we focused on the enrichment observed for the pooled dataset and entered the coordinates of all intronic UCEs overlapping pooled cancerCNAs into the gene ontogeny tool GREAT [92] (Materials and methods). This analysis revealed no enrichment in cancer-specific GO terms, suggesting that the enrichment of intronic UCEs in cancerCNAs may not be due to disruption of oncogenes or tumor suppressor genes, per se, but to an advantage for cancer cells of disrupting UCEs in particular. Additionally, the majority of intronic UCEs are overlapped by the pooled cancerCNA dataset (78% of 418 intronic UCEs and 80% of 181 genes containing intronic UCEs), suggesting the effect is spread across many UCEs and not attributable to a small subset of UCEs or genes. To investigate this further, we examined the sixteen individual datasets that form our pooled cancerCNA dataset, and scored each UCE for the number of times it is overlapped by a cancerCNA dataset (Table S5). The highest hit rate was six, and this for an intronic UCE that is the one and only UCE in the gene neurotrimin (NTM), which has not been associated with cancer. Furthermore, of 327 intronic UCEs overlapping cancerCNAs, 124 (38%) are overlapped by only one cancerCNA dataset. As such, it appears that the enrichment of UCEs in cancerCNAs relies on a large number of UCEs, with no particular UCEs being disrupted in a wide variety of cancers.
The correlation between UCE and cancerCNA positions is independent of the position of genes, microRNAs, transcribed UCEs, and enhancers, GC content, and replication timing
Finally, we applied partial correlation analyses (Materials and methods) to address whether the enrichment of UCEs in cancerCNAs can be completely explained by the relative positioning of UCEs and another genomic feature, such as genes, or whether a positive relationship between the placement of UCEs and cancerCNAs remains even when other genomic features are taken into account. We began by considering genes, dividing the genome into 50 kb windows and, within each window, scoring the number of base pairs encompassed by UCEs, cancerCNAs, and genes. Next, we calculated the correlation between UCEs and cancerCNAs, and then, using partial correlation analyses, statistically removed from this correlation any contribution that can be ascribed to the positions of genes. For comparison, we also ran parallel analyses examining the correlation between UCEs and classicalCNVs. As shown in the leftmost segment of Figure 2, the resulting partial correlation coefficient indicates that the correlation of UCEs with cancerCNAs remains positive and significant, independent of the location of genes in the genome (P = 0.011). In contrast, and not surprisingly, we obtained a significant negative partial correlation between UCEs and classicalCNVs, indicating that the negative correlation of UCEs with classicalCNVs also cannot be explained by the position of genes (P = 2.6×10⁻⁷). Parallel analyses with window sizes of 10 kb and 100 kb gave similar results (0.004≤P≤0.014 for the enrichment of UCEs in cancerCNAs and 2.2×10⁻⁸≤P≤1.9×10⁻⁶ for the depletion of UCEs from classicalCNVs).

Because microRNAs are associated with regions of the genome that are fragile in cancer as well as regions that are copy number variant in cancer cells [42], [43], [93], reviewed in [94], we asked whether the enrichment of UCEs within cancerCNAs might simply be mirroring an effect that is centered on microRNAs. Using partial correlation analysis, we found that a significant positive correlation remains between the positions of UCEs and cancerCNAs even when accounting for the position of microRNAs (P = 0.005). The positive correlation also remained when we controlled for the positions of transcribed UCEs and transcribed UCEs that show altered expression in cancer [42] (P = 0.001 and P = 0.008, respectively). As UCEs have been associated with enhancer function [4], [18]–[21], we examined whether a potential correlation between UCE and enhancer position could be driving the enrichment of UCEs in cancerCNAs and/or their depletion from classicalCNVs. This analysis did not use enhancers that had been identified using sequence conservation [4] because a positive correlation between UCEs and such enhancers would be expected a priori, given that both the UCEs and enhancers would have been selected using similar criteria. Instead, enhancer regions were defined using the ‘enhancer’ annotations of ENCODE, which compiles chromatin and other modifications in six cell types [95]. We found that, even after accounting for the positions of enhancers, the positive correlation between UCEs and cancerCNAs (0.004≤P≤0.021), as well as the negative correlation between UCEs and classicalCNVs (6.9×10⁻⁹≤P≤2.6×10⁻⁷), remained significant.
We also investigated the impact of GC content and differential replication timing across the genome, both of which have been found to be associated with the positions of classicalCNVs [96]. Here, again, the positive correlation of UCEs with cancerCNAs remained significant in partial correlation analyses (P = 0.002 and P = 0.006, respectively), as did the negative correlation of UCEs with classicalCNVs (P = 2.8×10⁻⁹ and P = 2.3×10⁻⁸, respectively). Finally, we carried out partial correlation analysis while simultaneously controlling for all variables shown in Figure 2 and obtained a positive correlation between UCEs and cancerCNAs (P = 8.0×10⁻⁴) as well as a negative correlation between UCEs and classicalCNVs (P = 3.2×10⁻⁸).
Very newly formed, somatic CNVs are depleted for UCEs
Our data have thus far demonstrated significant depletion of UCEs from classicalCNVs and de nov°CNVs, while documenting a lack of depletion, or even a significant enrichment, in cancerCNAs. One explanation for this difference might be that classicalCNV and de nov°CNV datasets represent generally healthy individuals while cancerCNA datasets represent a diseased state. Alternatively, the difference could reflect an overall younger age of cancerCNAs; whereas the cancerCNAs we analyzed are most likely to have arisen somatically and not passed through a germline, some de nov°CNVs could have arisen in the germline of a parent, and many classicalCNVs are likely to have passed through many generations of germlines.
To further address the issue of CNV age, we examined CNVs that were established somatically but not in cancer cells, calling such variants somaticCNVs (Fig. 1D). Here, we assembled somaticCNV data from six publications: Piotrowski et al. [63], Forsberg et al. [64], Jacobs et al. [65], Laurie et al. [66], O'Huallachain et al. [67], and McConnell et al. [68]. In order to maximize the number of datasets of sufficient size for our analyses, we included CNVs obtained from the Jacobs et al. [65] and Laurie et al. [66] studies involving cancer patients, although we removed from consideration all CNVs representing individuals where the cancer-affected tissue was also tissue used to call somaticCNVs (e.g. a person with leukemia whose blood was sampled to discover somaticCNVs); the number of individuals falling into this excluded category amounted to only 16 (0.03%) from Jacobs et al. [65] and 7 (0.01%) from Laurie et al. [66]. We combined the six individual datasets into a pooled somaticCNV dataset, consisting of 136 CNVs and covering 54.99% of the genome (Table S1). In contrast to cancerCNAs, we find that the pooled somaticCNV dataset is significantly depleted for UCEs (P = 0.002, obs/exp = 0.917, Table 3 and Table S4 section C). These results show that the youthfulness of a CNV dataset does not necessarily predict an enrichment for UCEs. Furthermore, as they show that somaticCNVs resemble classicalCNVs in terms of their depletion for UCEs, these observations suggest a potential similarity in the behavior of CNVs that pass through the germline and those that are formed in the soma. Note that three of the four individual datasets that were large enough to be analyzed on their own were not depleted of UCEs, with one being enriched: namely Forsberg 2012 [64], Jacobs 2012 [65], and Laurie 2012 [66]. In fact, these datasets, which consist of 5–104 CNVs and cover 2.04–27.10% of the genome (Table S1), do contribute to the depletion seen with the pooled somaticCNV dataset. This becomes apparent when the three datasets are combined, leading the overall CNV coverage of the combined dataset compared to the three individual datasets to be increased by more than is the overlap of CNVs with UCEs (95% versus 93% for Forsberg 2012, 29% versus 22% for Jacobs 2012, and 32% versus 22% for Laurie 2012). Indeed, this combined dataset is itself depleted for UCEs (P = 0.011, obs/exp = 0.902, Table S4 section C), explaining how these datasets, themselves not depleted for UCEs, contribute to the depletion seen in the pooled somaticCNV dataset.
Turning to the somaticCNV dataset that showed enrichment, Forsberg 2012 [64], we noted that all subjects in this dataset were over 60 years of age and therefore considered the possibility that advanced age may influence the relationship between UCEs and CNVs. We therefore examined the only two datasets of somaticCNVs representing a wide range in sample ages, Jacobs 2012 [65] and Laurie 2012 [66] (Table S4 section C). Here we found an enrichment of UCEs in somaticCNVs in individuals who are less than 60 years old (50 regions, 10.20% of the genome, P = 0.001, obs/exp = 1.286) and neither enrichment nor depletion for those who are 60 or over (92 regions, 35.51% of the genome, P = 0.044, obs/exp = 0.921). Hence, the enrichment of UCEs in the Forsberg 2012 [64] dataset is unlikely to be explained simply by the age of the subjects. Instead, our observations may reflect technical differences, such as sample selection and size, tissue-specificity of the mechanisms underlying depletion or enrichment of UCEs in CNVs, or the possibility of some somaticCNVs representing tissues that are diseased, even if not diagnosed. Alternatively, a lack of depletion of UCEs from individual somaticCNV datasets may reflect the fact that somaticCNVs are very young and, perhaps also that they have not experienced passage through the germline, which may underlie and even be required for the more consistent depletion, and generally lower obs/exp ratios, observed with classicalCNVs (this study, [2], [25], [39]).
iPS cells can establish UCE depletion from CNVs in culture
The depletion of UCEs from the pooled somaticCNV dataset suggests that disrupting the dosage of UCEs may induce a fitness cost at the level of the individual somatic cell. Thus, we asked whether a signal consistent with selection of CNVs can be detected in cell culture. For example, although not proof of selection, lack of depletion at early time points giving way to significant depletion at later time points would be consistent with a selective loss of CNVs overlapping UCEs. To this end, we turned to iPS cell lines and examined their CNV profiles over time. To provide our analyses of different cell lines with a common starting point, we considered only those CNVs in iPS cells that were not detected in their matched parental cells, calling this subset iPSCNVs (Fig. 1E). As we were interested in following the fate, rather than origin, of CNVs, we considered CNVs that arose de novo during cell growth in culture or as a result of the protocol for generating iPS cells [97]–[102] and those that were present in the parental cells at levels below the limit of detection [103]–[106] as equally relevant.
We required all studies to have genome-wide CNV profiles for iPS cell lines at multiple time points, or passage numbers, together with profiles for the matched parental cell line(s) from which the iPS cells were derived, and two studies satisfied our criteria: Hussein et al. [100] and Laurent et al. [98]. In the case of Hussein et al. [100], the dataset we assembled (Materials and methods) consisted of CNVs from 22 human iPS cell lines produced from 3 parental fibroblast lines, while for Laurent et al. [98] we assembled data for CNVs representing 36 iPS cell lines derived from 6 parental cell lines of various cell types. So that we could assay CNV profiles over time in cell populations, we pooled the iPSCNVs from Hussein et al. [100] and Laurent et al. [98] into three categories, representing low, medium, and high passage, ensuring that the genome coverage of each category was sufficiently large for analysis. The low passage category represents cells from passages 4 and 5 (935 regions, 1.30% of the genome), the medium passage category covers passages 6 through 11 (1,071 regions, 2.39% of the genome), and the high passage category corresponds to passages 12 through 36 (300 regions, 1.63% of the genome) (Table S1). We also considered the Hussein et al. [100] and Laurent et al. [98] studies individually, seeking datasets corresponding to the passage numbers of the pooled datasets and yet still sufficiently large (Table S3) for our analyses; Hussein et al. [100] yielded low, medium, and high passage CNV datasets, and Laurent et al. [98] produced a high passage dataset (Table S1).
Intriguingly, we found that, while the pooled iPSCNVs of low passage cells are not depleted for UCEs (P = 0.387, obs/exp = 1.089), those of medium passage iPS cells trend towards depletion (P = 0.032, obs/exp = 0.605), while those of late passage iPS cells give a clear signal of depletion (P = 0.005 obs/exp = 0.327; Table 3 and Table S4 section D). As expected, given that the bulk of the pooled iPSCNV data come from Hussein et al. [100] (Table S1), the results of our analysis of the Hussein et al. iPSCNVs, alone, followed that of the pooled iPSCNVs: Hussein 2011 low passage iPSCNVs are not depleted for UCEs (P = 0.433, obs/exp = 0.948), while Hussein 2011 medium passage iPSCNVs trend towards depletion (P = 0.077, obs/exp = 0.660), and Hussein 2011 late passage iPSCNVs show significant depletion (P = 0.010, obs/exp = 0.107; Table 3 and Table S4 section D). Although the Laurent 2011 high passage iPSCNV analysis did not return expected overlaps that were normally distributed, precluding a P-value for depletion, this dataset nevertheless shows a low obs/exp ratio (obs/exp = 0.544, Table 3 and Table S4 section D).
While the replication of our studies awaits the availability of additional iPSCNV datasets of sufficient coverage and spanning considerable time frames, our findings thus far show that the CNV profiles of newly generated iPS cells can, at least under some circumstances, become depleted for UCEs over time. These observations are consistent with UCE-disrupting CNVs being under negative selection during iPS cell passage, with cells containing them being lost or out-competed over time. As such, they may explain why some CNVs may be selectively disfavored, even though they may not affect gene expression in the iPS cells [107]. How our observations interface with other studies documenting changes in CNV profiles over time in cell culture is difficult to assess, as these other studies represent a diversity of strategies for CNV analysis and differ among themselves in terms of the extent and direction of the changes in CNV abundance [97], [98], [100], [101], [103]. Furthermore, while our studies were focused on the overlap between CNVs and UCEs, these other studies were focused on the abundance, per se, of CNVs, which may not necessarily be correlated with depletion of UCEs. Nevertheless, our data indicate that depletion of UCEs from CNVs could occur without benefit of passage through the germline, suggesting that the mechanisms underlying depletion of UCEs from CNVs may be amenable to analysis in the laboratory.
Discussion
In this study we provide evidence suggesting that a UCE-depleted CNV profile can be established in mitotically dividing cells without germline transmission. This finding, obtained with iPS cells, is consistent with our observation that, like classicalCNVs, de nov°CNVs and somaticCNVs representing healthy individuals are depleted for UCEs as well. Drawing these findings together, we suggest that healthy human cell populations may be able to rapidly purge themselves of copy number variant regions involving UCEs. While this purging could involve the repair of CNVs, we find this unlikely, and instead favor the selective loss of cells containing CNVs that disrupt UCEs, such that the CNV profile of the remaining population of cells is depleted of UCEs.
In striking contrast to the situation in healthy cells, the CNVs of cancer cells are by and large not depleted of UCEs. This suggests an important and hitherto overlooked aspect of cancer genetics and invites the study of UCE depletion from CNVs into the realm of diseases that develop somatically, of which cancer is just one. Some diseased states may release cells from the dosage constraints of UCEs or even confer cellular advantages that outweigh the deleterious consequences of an imbalance of UCEs. Alternatively, release from the dosage constraints of UCEs may be a prerequisite or permissive step en route to disease. Our findings also highlight the possibility that some diseases associated with genomic instability involve instead, or in addition, a simple inability to cull away the normal burden of deleterious CNVs arising at a frequency that is not different from that found in healthy cells. In any case, lack of depletion of UCEs from a CNV dataset suggests that the cells contributing to the dataset may not represent the healthy state, having escaped the possible deleterious consequences of deleting or duplicating UCEs either because the mechanisms effecting such consequences were no longer in play or because the cells had acquired a means by which to circumvent them. With respect to cancerCNAs, it may be that they arise when the mechanisms producing deleterious consequences are disabled or circumvented, their positions potentially influenced by the density of genes with either pro - or anti-proliferative functions [108], [109].
That cancerCNV datasets can show an overall enrichment for UCEs is intriguing, especially since enrichment of UCEs in CNVs associated with disease has been observed in neurodevelopmental disorders [41]. In the case of cancer, it is unclear whether the enrichment we observe is on a continuum with loss of depletion or represents a subsequent or completely separate process. For example, release from the dosage constraints of UCEs may enable cancerous cells to benefit from growth advantages brought about by deletions or duplications of UCE-containing regions [45]–[50], [110]. This explanation is consistent with the observation that some transcribed UCEs can act as oncogenes [42], [47] or tumor suppressors [45] or, in the case of one UCE, intercellular signaling molecules within hepatocellular cancer [111]. An enrichment of UCEs in cancerCNVs could also be explained if UCE dosage were directly or indirectly implicated in cell cycle control. Here, we presume that cellular detection of UCE dosage is coordinated with the cell cycle, since a cell doubles its ploidy as it traverses S-phase, and S-phase, itself, imposes a dosage imbalance that sweeps across the genome. As such, S-phase induced imbalances of UCEs could be used by a replicating cell to confirm that it is in S-phase and must continue to replicate its genome. If so, cells for which UCE dosage has been disrupted and, as suggested above, have also circumvented the deleterious consequences of aberrant UCE dosage, might be predisposed to continuously undergo replication and, hence, progress unrestrained through cell cycles. Of these, cells that are the most disrupted in UCE dosage, in other words enriched for the inclusion of UCEs in their CNVs, might be expected to show the strongest phenotype of unregulated growth and thus become cancerous.
The enrichment of UCEs in many cancerCNA datasets may at first be difficult to reconcile with the depletion of UCEs from classicalCNVs, de nov°CNVs, somaticCNVs, and iPSCNVs; while cancer cells with abnormal UCE copy number appear unaffected or even advantaged, cells with abnormal UCE copy number may be disadvantaged in healthy individuals, this difference implying opposite impacts on proliferation, senescence, or apoptosis. Similarly, the mutational profiles of cancer cells may bias CNVs toward forming in the vicinity of UCEs, possibly conferring selective advantage, whereas the profiles of healthy cells may avoid such disruptions.
Whether the difference in UCE disruption by CNVs in cancer versus healthy cells is due to differences in mutational profiles, selective retention/loss of UCE-disrupting CNVs, or a combination of both, the dichotomy of CNV profiles with respect to UCEs between healthy and cancerous cells warrants further discussion. One explanation argues that even though cancer cells with disrupted UCE dosage may acquire a growth advantage, their presence is detrimental to the overall fitness of the individual. Hence, disruptions in UCE copy number such as those seen in cancer would not be predicted to endure in human populations, consistent with the UCE-depleted profile of classicalCNVs. The same argument cannot, however, be applied to de nov°CNVs, somaticCNVs, or iPSCNVs, because unlike classicalCNVs, these three categories of CNVs have not been subjected to selection at the level of the population. As such, the UCEs that are enriched in cancerCNAs may differ from those that are depleted from de nov°CNVs, somaticCNVs, or iPSCNVs. This possibility can be further investigated when more de nov°CNVs, somaticCNV, and iPSCNV datasets become available.
Comparison of the locations, sizes, and sequences of UCEs, their potential differential inclusion in duplications or deletions, and other structural features may ultimately shed light on the basis for the enrichment of UCEs in some CNV datasets and the depletion of UCEs from others. As importantly, it may elucidate how loss or gain of a UCE could be sensed by the healthy cell and then translated into a deleterious consequence. At present, we favor a mechanism wherein the maternal and paternal copies of a UCE compare their sequences, possibly through pairing, because, by hypothesizing that any discrepancy between the homologs would trigger deleterious outcomes, this model offers an explanation for ultraconservation itself [2], [25], [27]. Such a pairing-based mechanism would contribute to genome integrity with respect to dosage and is compatible with the viability of mice that are homozygous for the loss of a UCE [112] (further discussion of heterozygous UCE deletions is presented in Chiang et al. [25]). Requirements for sensing and maintaining dosage in the genome are well studied (for examples, see [52]–[55]), and responses to dosage imbalances, flagged by improperly paired UCEs, could range from a growth disadvantage among cells to loss of individuals from a population through disease and, at the molecular level, from metabolic disruptions to deleterious mutational and epimutational changes. Intriguingly, mutation within and in the vicinity of UCEs that are no longer well paired with a homolog may predict that ultraconserved chromosomal regions might be enriched in de novo mutations. Such a prediction is aligned with an intriguing observation, wherein conserved sequences appear to occupy the more mutable parts of the human genome, at least with regards to de novo mutations ([113], [114], see also [115]). In particular, heterozygosity for a CNV that deletes or duplicates a UCE could enhance local rates of de novo mutation due to disruption of pairing and, if such mutations confer a selective disadvantage, they will be lost from the population, thus increasing mutation rates in the short term while promoting conservation of UCE sequence and dosage over longer time frames. It is also possible that, if the unpaired status of a UCE persists for an extended period of time, de novo mutations may not all be removed by selection and perhaps even accumulate. In such a situation, the DNA sequence of the UCE could decay, in which case the deleterious response to disrupted pairing (loss of fitness, e.g., disease and infertility) would vanish, explaining how UCEs can be lost, albeit rarely [40]. UCEs could also be disabled through epigenetic modification without disruption of UCE sequence. Here, too, the resultant lack of constraint on a UCE could lead to the decay of its sequence.
Finally, our results also demonstrate that the depletion of UCEs from CNVs may be tractable to analysis in cell culture; whereas studies of UCEs have generally been conducted in the context of many human generations or evolutionary timescales, our findings demonstrate that depletion of UCEs from CNVs and possibly ultra-conservation, itself, are amenable to analyses spanning just a few cell generations (Fig. 3). Excitingly, understanding the relative contributions of CNV formation and selection pressure to UCE depletion in healthy cells and loss of that depletion in cancer cells should help reveal how cancer cells differ from healthy cells and, perhaps, how we may mitigate cancer phenotypes by inducing cancer cells to more closely resemble healthy cells. Indeed, if we understand the mechanisms by which UCE depletion is established in healthy cells, be it through selection against UCE-disrupting CNVs or otherwise, such mechanisms could be harnessed to purge a diseased tissue or individual of diseased cells, while leaving untouched cells whose CNV profiles do not disrupt UCEs. Such a strategy could prove even more powerful should UCEs embody a mechanism, perhaps through pairing, by which cells assess all types of genome rearrangements, distinguishing the deleterious from the benign or even beneficial.

Materials and Methods
UCE identification
Two new sets of ultraconserved elements were defined in this study: one between the reference genomes of cow, dog, and horse (builds: bosTau6, canFam2, and equCab2) and the other between the reference genomes of dog, mouse, and rat (builds: canFam2, mm9, and rn4). We also identified UCEs between human, mouse, and rat (builds: hg18, mm9, rn4), which are very similar to the UCEs identified in 2004 [1], although earlier builds were used to identify UCEs in that study. Pairwise alignments were found between each possible pair of genomes within the set of three, and elements with 100% basepair identity that were ≥200 bp in length were selected. We then mapped these regions to the hg18 human genome by BLAT (http://genome.ucsc.edu/cgi-bin/hgBlat), filtering out matches in the human genome that differed in length by more than 3 bp and were not unambiguously unique in the human genome. The hg18 orthologs of our new UCE sets were then used in our analyses. Coordinates for all UCEs are available in Table S2.
Classifying UCEs as intergenic, intronic, or exonic
UCEs were classified as intergenic, intronic, or exonic using the UCSC Known Genes track for hg18. If a UCE overlapped neither exons nor introns, it was designated intergenic. If a UCE did not overlap an exon but did overlap an intron by 1 bp or more, it was designated intronic. If a UCE overlapped an exon by 1 bp or more, it was designated exonic.
Dataset acquisition and filtering
Table S1 provides detailed information for all CNV datasets, including the number of affected regions, median size of CNVs, genome coverage, discovery and validation platforms used, number of subjects, and coordinates. When necessary, coordinates were mapped to the hg18 genome build using the liftover utility provided by UCSC (http://genome.ucsc.edu/cgi-bin/hgLiftOver). In each CNV dataset, overlapping regions were collapsed to avoid counting the same region multiple times, leading to a final list of regions for each CNV dataset that may differ from the original set reported in the relevant publication. Additional information for the various CNV datasets can be found below.
classicalCNV datasets
Eight classicalCNV datasets were obtained from Jakobsson et al. [61], McCarroll et al. [62], Matsuzaki et al. [56], Shaikh et al. [57], Conrad et al. [39], Drmanac et al. [58], Durbin et al. [59], and Campbell et al. [60].
de nov°CNV datasets
Four de nov°CNV datasets were obtained from Xu et al. [69], Itsara et al. [70], Malhotra et al. [71], and Sanders et al. [72]. The identification of de nov°CNVs is exceptionally vulnerable to errors, because each de nov°CNV requires two negative results (the CNV is not detected in either parent). For example, if a CNV is missed in the parents, but is correctly detected in a child, it will be incorrectly designated a de nov°CNV. Additionally, the use of cell lines to detect de nov°CNVs may produce artifacts, as CNVs may arise de novo within a cell line [70], [116], [117]. For these reasons, we only studied a de nov°CNV if it had been identified using DNA obtained directly from primary tissue and independently verified.
cancerCNA datasets
Seventeen cancerCNA datasets were obtained from TCGARN et al. [76], Walter et al. [77], Beroukhim et al. [73], Bullinger et al. [78], Taylor et al. [79], TCGARN et al. [80], Curtis et al. [81], TCGARN et al. [82], TCGARN et al. [83], TCGARN et al. [84], Nik-Zainal et al. [85], Robinson et al. [86], Walker et al. [87], Zhang et al. [88], Holmfeldt et al. [89], TCGARN et al. [90], and Weischenfeldt et al. [91]. All data were filtered to remove any cancerCNA longer than 50% of the length of the chromosome arm on which it resides. This was done to remove cancerCNAs that result from losses of whole chromosomes or chromosome arms, events that we consider distinct from the smaller deletions and duplications considered in the present study.
We only considered recurrent cancerCNAs, as they were more likely to be important for cancer causation or progression. In cases where published datasets had already been filtered for recurrent CNAs, we listed the algorithm used in Table S1. We did not further filter these datasets. The datasets of Bullinger et al. [78], Nik-Zainal et al. [85], Robinson et al. [86], Walker et al. [87], Holmfeldt et al. [89], and Weichenfeldt et al. [91] had not been pre-filtered for recurrent variants, and so, for these, we selected only cancerCNA regions that were present more than once in the dataset. All these datasets except for that of Walker 2012 [87] were included in the pooled cancerCNA dataset. The dataset of Walker 2012 [87] was omitted because its recurrent cancerCNA regions covered 94% of the human genome, and we were concerned that this level of coverage would be overbearing.
somaticCNV datasets
Six somaticCNVs were obtained from Piotrowski et al. [63], Forsberg et al. [64], Jacobs et al. [65], Laurie et al. [66], O'Huallachain et al. [67], and McConnell et al. [68]. So as not to confound the analysis of somaticCNVs with cancerCNAs, all somaticCNV datasets were also filtered to remove any representing individuals where a cancer-affected tissue is used to call somaticCNVs. This affected two studies, Jacobs et al. [65] and Laurie et al. [66]. For Jacobs et al. [65], the excluded regions were from 16 patients with AML (Acute Myeloid Leukemia), CLL (Chronic Lymphocytic Leukemia), CML (Chronic Myelogenous Leukemia) or NHL (Non-Hodgkin Lymphoma) and from whom blood was used for somaticCNV discovery. For Laurie et al. [66], the excluded regions were from 7 patients with ‘prior heamatological cancer’ and from whom blood was used for somaticCNVs discovery.
iPSCNV datasets
iPSCNVs were obtained from Hussein et al. [100] and Laurent et al. [98]. All datasets were culled of CNVs that were also discovered in the corresponding parental cells used to produce the iPS cells. The datasets were pooled into low passage (4 and 5), medium passage (6 through 11), and high passage (12 through 36) categories, with passage numbers chosen to ensure each category was sufficiently large for our analysis.
microRNAs
Since the human microRNA genomic positions were obtained with respect to genome build hg19 from ftp://mirbase.org/pub/mirbase/CURRENT/genomes/hsa.gff3, they were converted to hg18 using UCSC's liftover feature (http://genome.ucsc.edu/cgi-bin/hgLiftOver). For all analyses, we used the genomic positions of the microRNA precursor sequences, which defined regions that are larger in bp than the genomic regions producing the processed microRNAs.
Determining depletion from or enrichment of UCEs in genomic regions of interest
Tests for depletion of UCEs from, or enrichment of UCEs in, genomic regions such as CNVs, were conducted as described in Results and our previous publications [2], [25]. We compared the observed amount of overlap in base pairs between a set of CNVs and a set of UCEs to the expected overlap, as determined by a randomly placed set of elements matched to UCEs in terms of element number and length. In particular, the elements of the matched set were placed randomly on the genome 1,000 times, and the overlap between the random elements and CNVs was calculated each time, thus producing a distribution of the randomly generated expected overlaps. To provide a measurement of the difference between the distribution of expected overlaps and the observed overlap, we reported the proportion of expected overlaps that were equal to, or more extreme than, the observed overlap. The distribution of expected overlaps was assessed for normality using the Kolomogorov-Smirnov (KS) test, and the associated KS P-value is included in all supplementary tables. Whenever the expected overlaps exhibited a normal distribution, they were compared to the observed overlap using a Z-test, wherein a significant result, together with a ratio of observed overlap to mean expected overlap (obs/exp) falling below 1.0 indicated significant depletion; a significant Z-test result and an obs/exp ratio above 1.0 indicated significant enrichment. In cases where normality was not observed, we noted this in the text and reported only the obs/exp ratio and the proportion of expected overlaps that were equal to, or more extreme than, the observed overlap. In analyses in which UCEs were segregated into exonic, intronic, and intergenic categories, random elements were drawn solely from the exonic, intronic, or intergenic portions of the genome.
Analysis of the number of times each UCE is overlapped by the individual cancerCNA datasets
We determined the total number of cancerCNA datasets overlapping each of the 896 HMR-HDM-HC UCEs and report this in Table S5. For exonic and intronic UCEs, we reported the gene that contains the element. In the case of a UCE that overlapped multiple genes, both genes were recorded. The list of transcripts was obtained from the UCSC Known Genes track.
Gene ontogeny
The tool GREAT (http://bejerano.stanford.edu/great/public/html/) was used with background set to the whole genome.
Partial correlations
Data for genomic features of interest were obtained from the following sources: UCSC genes – UCSC known genes track build hg18; Enhancer regions – ENCODE combined genome segmentation from the ENCODE UCSC hub [95] ‘E’ (enhancer) class genomic regions for six ENCODE cell/tissue types; microRNAs – miRBase [118]; GC content – UCSC genome browser; replication timing – [96].
Analyses were performed over 10 kb, 50 kb, and 100 kb windows. Results were similar for all bin sizes, with no changes in significance for classicalCNVs or cancerCNAs. Only the results for 50 kb bins are shown in Figure 2. Positional data were converted to a density measurement by summing the number of bases in a window covered by the feature of interest (e.g. UCE, CNV), divided by the number of sequenced bases in the hg18 human genome within the same window. Partial correlations were performed using Matlab partialcorr function.
Genome coordinates
All coordinates listed in this study are with reference to human genome build hg18. All start coordinates are 1-based.
Scripts
All scripts for this study are written in Python and are available at https://github.com/rmccole/Abnormal_dosage_UCEs.
Supporting Information
Zdroje
1. BejeranoG, PheasantM, MakuninI, StephenS, KentWJ, et al. (2004) Ultraconserved elements in the human genome. Science 304 : 1321–1325 doi:10.1126/science.1098119
2. DertiA, RothFP, ChurchGM, WuC-T (2006) Mammalian ultraconserved elements are strongly depleted among segmental duplications and copy number variants. Nat Genet 38 : 1216–1220 doi:10.1038/ng1888
3. FisherS, GriceEA, VintonRM, BesslingSL, McCallionAS (2006) Conservation of RET regulatory function from human to zebrafish without sequence similarity. Science 312 : 276–279 doi:10.1126/science.1124070
4. ViselA, PrabhakarS, AkiyamaJA, ShoukryM, LewisKD, et al. (2008) Ultraconservation identifies a small subset of extremely constrained developmental enhancers. Nat Genet 40 : 158–160 doi:10.1038/ng.2007.55
5. Meireles-FilhoACA, StarkA (2009) Comparative genomics of gene regulation-conservation and divergence of cis-regulatory information. Curr Opin Genet Dev 19 : 565–570 doi:10.1016/j.gde.2009.10.006
6. JaegerSA, ChanET, BergerMF, StottmannR, HughesTR, et al. (2010) Conservation and regulatory associations of a wide affinity range of mouse transcription factor binding sites. Genomics 95 : 185–195 doi:10.1016/j.ygeno.2010.01.002
7. WeirauchMT, HughesTR (2010) Conserved expression without conserved regulatory sequence: the more things change, the more they stay the same. Trends Genet 26 : 66–74 doi:10.1016/j.tig.2009.12.002
8. TaherL, McGaugheyDM, MaraghS, AneasI, BesslingSL, et al. (2011) Genome-wide identification of conserved regulatory function in diverged sequences. Genome research 21 : 1139–1149 doi:10.1101/gr.119016.110
9. KeightleyPD, KryukovGV, SunyaevS, HalliganDL, GaffneyDJ (2005) Evolutionary constraints in conserved nongenic sequences of mammals. Genome Res 15 : 1373–1378 doi:10.1101/gr.3942005
10. KryukovGV, SchmidtS, SunyaevS (2005) Small fitness effect of mutations in highly conserved non-coding regions. Hum Mol Genet 14 : 2221–2229 doi:10.1093/hmg/ddi226
11. DrakeJA, BirdC, NemeshJ, ThomasDJ, Newton-ChehC, et al. (2006) Conserved noncoding sequences are selectively constrained and not mutation cold spots. Nat Genet 38 : 223–227 doi:10.1038/ng1710
12. ChenCTL, WangJC, CohenBA (2007) The strength of selection on ultraconserved elements in the human genome. Am J Hum Genet 80 : 692–704 doi:10.1086/513149
13. KatzmanS, KernAD, BejeranoG, FewellG, FultonL, et al. (2007) Human genome ultraconserved elements are ultraselected. Science 317 : 915 doi:10.1126/science.1142430
14. SakurabaY, KimuraT, MasuyaH, NoguchiH, SezutsuH, et al. (2008) Identification and characterization of new long conserved noncoding sequences in vertebrates. Mamm Genome 19 : 703–712 doi:10.1007/s00335-008-9152-7
15. HalliganDL, OliverF, GuthrieJ, StemshornKC, HarrB, et al. (2011) Positive and negative selection in murine ultra-conserved noncoding elements. Mol Biol Evol 28 : 2651–2660 doi:10.1093/molbev/msr093
16. ChiangCWK, LiuC-T, LettreG, LangeLA, JorgensenNW, et al. (2012) Ultraconserved Elements in the Human Genome: Association and Transmission Analyses of Highly Constrained SNPs. Genetics 192 : 253–266 doi:10.1534/genetics.112.141945
17. PoulinF, NobregaMA, Plajzer-FrickI, HoltA, AfzalV, et al. (2005) In vivo characterization of a vertebrate ultraconserved enhancer. Genomics 85 : 774–781 doi:10.1016/j.ygeno.2005.03.003
18. WoolfeA, GoodsonM, GoodeDK, SnellP, McEwenGK, et al. (2005) Highly conserved non-coding sequences are associated with vertebrate development. PLoS Biol 3: e7 doi:10.1371/journal.pbio.0030007
19. PennacchioLA, AhituvN, MosesAM, PrabhakarS, NobregaMA, et al. (2006) In vivo enhancer analysis of human conserved non-coding sequences. Nature 444 : 499–502 doi:10.1038/nature05295
20. LampeX, SamadOA, GuiguenA, MatisC, RemacleS, et al. (2008) An ultraconserved Hox-Pbx responsive element resides in the coding sequence of Hoxa2 and is active in rhombomere 4. 36 : 3214–3225 doi:10.1093/nar/gkn148
21. PoitrasL, YuM, Lesage-PelletierC, MacdonaldRB, GagnéJ-P, et al. (2010) An SNP in an ultraconserved regulatory element affects Dlx5/Dlx6 regulation in the forebrain. Development 137 : 3089–3097 doi:10.1242/dev.051052
22. McBrideDJ, BuckleA, van HeyningenV, KleinjanDA (2011) DNaseI Hypersensitivity and Ultraconservation Reveal Novel, Interdependent Long-Range Enhancers at the Complex Pax6 Cis-Regulatory Region. PLoS ONE 6: e28616 doi:10.1371/journal.pone.0028616
23. PaulsS, SmithSF, ElgarG (2012) Lens development depends on a pair of highly conserved Sox21 regulatory elements. Dev Biol 365 : 310–318 doi:10.1016/j.ydbio.2012.02.025
24. BhatiaS, BenganiH, FishM, BrownA, DiviziaMT, et al. (2013) Disruption of Autoregulatory Feedback by a Mutation in a Remote, Ultraconserved PAX6 Enhancer Causes Aniridia. Am J Hum Genet 93 : 1126–1134 doi:10.1016/j.ajhg.2013.10.028
25. ChiangCWK, DertiA, SchwartzD, ChouMF, HirschhornJN, et al. (2008) Ultraconserved Elements: Analyses of Dosage Sensitivity, Motifs and Boundaries. Genetics 180 : 2277–2293 doi:10.1534/genetics.108.096537
26. ViturawongT, MeissnerF, ButterF, MannM (2013) A DNA-Centric Protein Interaction Map of Ultraconserved Elements Reveals Contribution of Transcription Factor Binding Hubs to Conservation. Cell Rep 5 : 531–545 doi:10.1016/j.celrep.2013.09.022
27. KritsasK, WuestSE, HupaloD, KernAD, WickerT, et al. (2012) Computational analysis and characterization of UCE-like elements (ULEs) in plant genomes. Genome research 22 : 2455–2466 doi:10.1101/gr.129346.111
28. WuCT, MorrisJR (1999) Transvection and other homology effects. Curr Opin Genet Dev 9 : 237–246 doi:10.1016/S0959-437X(99)80035-5
29. DuncanIW (2002) Transvection effects in Drosophila. Annual Review of Genetics 36 : 521–556 doi:10.1146/annurev.genet.36.060402.100441
30. KennisonJA, JWS (2002) Transvection in Drosophila. Advances in genetics: 399–420. doi:10.1016/s0065-2660(02)46014-2
31. BacherCP, GuggiariM, BrorsB, AuguiS, ClercP, et al. (2006) Transient colocalization of X-inactivation centres accompanies the initiation of X inactivation. Nat Cell Biol 8 : 293–299 doi:10.1038/ncb1365
32. XuN, TsaiC-L, LeeJT (2006) Transient homologous chromosome pairing marks the onset of X inactivation. Science 311 : 1149–1152 doi:10.1126/science.1122984
33. KoemanJM, RussellRC, TanM-H, PetilloD, WestphalM, et al. (2008) Somatic pairing of chromosome 19 in renal oncocytoma is associated with deregulated EGLN2-mediated [corrected] oxygen-sensing response. PLoS Genetics 4: e1000176 doi:10.1371/journal.pgen.1000176
34. DonohoeME, SilvaSS, PinterSF, XuN, LeeJT (2009) The pluripotency factor Oct4 interacts with Ctcf and also controls X-chromosome pairing and counting. Nature 460 : 128–132 doi:10.1038/nature08098
35. BrandtVL, HewittSL, SkokJA (2010) It takes two: communication between homologous alleles preserves genomic stability during V(D)J recombination. Nucleus 1 : 23–29 doi:10.4161/nucl.1.1.10595
36. GandhiM, EvdokimovaVN, T CuencoK, NikiforovaMN, KellyLM, et al. (2012) Homologous chromosomes make contact at the sites of double-strand breaks in genes in somatic G0/G1-phase human cells. Proc Natl Acad Sci USA 109 : 9454–9459 doi:10.1073/pnas.1205759109
37. KruegerC, KingMR, KruegerF, BrancoMR, OsborneCS, et al. (2012) Pairing of homologous regions in the mouse genome is associated with transcription but not imprinting status. PLoS ONE 7: e38983 doi:10.1371/journal.pone.0038983
38. GandhiM, EvdokimovaVN, CuencoKT, BakkenistCJ, NikiforovYE (2013) Homologous chromosomes move and rapidly initiate contact at the sites of double-strand breaks in genes in G0-phase human cells. Cell Cycle 12 : 547–552 doi:10.4161/cc.23754
39. ConradDF, PintoD, RedonR, FeukL, GokcumenO, et al. (2010) Origins and functional impact of copy number variation in the human genome. Nature 464 : 704–712 doi:10.1038/nature08516
40. McLeanC, BejeranoG (2008) Dispensability of mammalian DNA. Genome Res 18 : 1743–1751 doi:10.1101/gr.080184.108
41. MartínezF, MonfortS, RosellóM, OltraS, BlesaD, et al. (2010) Enrichment of ultraconserved elements among genomic imbalances causing mental delay and congenital anomalies. BMC Med Genomics 3 : 54 doi:10.1186/1755-8794-3-54
42. CalinGA, LiuC-G, FerracinM, HyslopT, SpizzoR, et al. (2007) Ultraconserved Regions Encoding ncRNAs Are Altered in Human Leukemias and Carcinomas. Cancer Cell 12 : 215–229 doi:10.1016/j.ccr.2007.07.027
43. CalinGA, SevignaniC, DumitruCD, HyslopT, NochE, et al. (2004) Human microRNA genes are frequently located at fragile sites and genomic regions involved in cancers. Proc Natl Acad Sci USA 101 : 2999–3004 doi:10.1073/pnas.0307323101
44. ScaruffiP (2011) The transcribed-ultraconserved regions: a novel class of long noncoding RNAs involved in cancer susceptibility. ScientificWorldJournal 11 : 340–352 doi:10.1100/tsw.2011.35
45. LujambioA, PortelaA, LizJ, MeloSA, RossiS, et al. (2010) CpG island hypermethylation-associated silencing of non-coding RNAs transcribed from ultraconserved regions in human cancer. Oncogene 29 : 6390–6401 doi:10.1038/onc.2010.361
46. MestdaghP, FredlundE, PattynF, RihaniA, Van MaerkenT, et al. (2010) An integrative genomics screen uncovers ncRNA T-UCR functions in neuroblastoma tumours. Oncogene 29 : 3583–3592 doi:10.1038/onc.2010.106
47. BraconiC, ValeriN, KogureT, GaspariniP, HuangN, et al. (2011) Expression and functional role of a transcribed noncoding RNA with an ultraconserved element in hepatocellular carcinoma. Proc Natl Acad Sci USA 108 : 786–791 doi:10.1073/pnas.1011098108
48. SanaJ, HankeovaS, SvobodaM, KissI, VyzulaR, et al. (2012) Expression Levels of Transcribed Ultraconserved Regions uc.73 and uc.388 Are Altered in Colorectal Cancer. Oncology 82 : 114–118 doi:10.1159/000336479
49. FerdinJ, NishidaN, WuX, NicolosoMS, ShahMY, et al. (2013) HINCUTs in cancer: hypoxia-induced noncoding ultraconserved transcripts. Cell Death Differ 20 : 1675–1687 doi:10.1038/cdd.2013.119
50. HudsonRS, YiM, VolfovskyN, PrueittRL, EspositoD, et al. (2013) Transcription signatures encoded by ultraconserved genomic regions in human prostate cancer. Mol Cancer 12 : 13 doi:10.1186/1476-4598-12-13
51. LizJ, PortelaA, SolerM, GómezA, LingH, et al. (2014) Regulation of pri-miRNA Processing by a Long Noncoding RNA Transcribed from an Ultraconserved Region. Mol Cell. doi:10.1016/j.molcel.2014.05.005
52. BirchlerJA, VeitiaRA (2007) The gene balance hypothesis: from classical genetics to modern genomics. Plant Cell 19 : 395–402 doi:10.1105/tpc.106.049338
53. BirchlerJA, VeitiaRA (2012) Gene balance hypothesis: connecting issues of dosage sensitivity across biological disciplines. Proc Natl Acad Sci USA 109 : 14746–14753 doi:10.1073/pnas.1207726109
54. SheltzerJM, AmonA (2011) The aneuploidy paradox: costs and benefits of an incorrect karyotype. Trends Genet. doi:10.1016/j.tig.2011.07.003
55. LupskiJR, StankiewiczP (2005) Genomic disorders: molecular mechanisms for rearrangements and conveyed phenotypes. PLoS Genetics 1: e49 doi:10.1371/journal.pgen.0010049
56. MatsuzakiH, WangP-H, HuJ, RavaR, FuGK (2009) High resolution discovery and confirmation of copy number variants in 90 Yoruba Nigerians. Genome Biol 10: R125 doi:10.1186/gb-2009-10-11-r125
57. ShaikhTH, GaiX, PerinJC, GlessnerJT, XieH, et al. (2009) High-resolution mapping and analysis of copy number variations in the human genome: a data resource for clinical and research applications. Genome research 19 : 1682–1690 doi:10.1101/gr.083501.108
58. DrmanacR, SparksAB, CallowMJ, HalpernAL, BurnsNL, et al. (2010) Human genome sequencing using unchained base reads on self-assembling DNA nanoarrays. Science 327 : 78–81 doi:10.1126/science.1181498
59. Genomes Project Consortium, DurbinRM, AbecasisGR, AltshulerDL, AutonA, et al. (2010) A map of human genome variation from population-scale sequencing. Nature 467 : 1061–1073 doi:10.1038/nature09534
60. CampbellCD, SampasN, TsalenkoA, SudmantPH, KiddJM, et al. (2011) Population-genetic properties of differentiated human copy-number polymorphisms. Am J Hum Genet 88 : 317–332 doi:10.1016/j.ajhg.2011.02.004
61. JakobssonM, ScholzSW, ScheetP, GibbsJR, VanLiereJM, et al. (2008) Genotype, haplotype and copy-number variation in worldwide human populations. Nature 451 : 998–1003 doi:10.1038/nature06742
62. McCarrollSA, KuruvillaFG, KornJM, CawleyS, NemeshJ, et al. (2008) Integrated detection and population-genetic analysis of SNPs and copy number variation. Nat Genet 40 : 1166–1174 doi:10.1038/ng.238
63. PiotrowskiA, BruderCEG, AnderssonR, Diaz de StåhlT, MenzelU, et al. (2008) Somatic mosaicism for copy number variation in differentiated human tissues. Hum Mutat 29 : 1118–1124 doi:10.1002/humu.20815
64. ForsbergLA, RasiC, RazzaghianHR, PakalapatiG, WaiteL, et al. (2012) Age-related somatic structural changes in the nuclear genome of human blood cells. Am J Hum Genet 90 : 217–228 doi:10.1016/j.ajhg.2011.12.009
65. JacobsKB, YeagerM, ZhouW, WacholderS, WangZ, et al. (2012) Detectable clonal mosaicism and its relationship to aging and cancer. Nat Genet 44 : 651–658 doi:10.1038/ng.2270
66. LaurieCC, LaurieCA, RiceK, DohenyKF, ZelnickLR, et al. (2012) Detectable clonal mosaicism from birth to old age and its relationship to cancer. Nat Genet 44 : 642–650 doi:10.1038/ng.2271
67. O'HuallachainM, KarczewskiKJ, WeissmanSM, UrbanAE, SnyderMP (2012) Extensive genetic variation in somatic human tissues. Proc Natl Acad Sci USA 109 : 18018–18023 doi:10.1073/pnas.1213736109
68. McConnellMJ, LindbergMR, BrennandKJ, PiperJC, VoetT, et al. (2013) Mosaic copy number variation in human neurons. Science 342 : 632–637 doi:10.1126/science.1243472
69. XuB, RoosJL, LevyS, van RensburgEJ, GogosJA, et al. (2008) Strong association of de novo copy number mutations with sporadic schizophrenia. Nat Genet 40 : 880–885 doi:10.1038/ng.162
70. ItsaraA, WuH, SmithJD, NickersonDA, RomieuI, et al. (2010) De novo rates and selection of large copy number variation. Genome research 20 : 1469–1481 doi:10.1101/gr.107680.110
71. MalhotraD, McCarthyS, MichaelsonJJ, VacicV, BurdickKE, et al. (2011) High frequencies of de novo CNVs in bipolar disorder and schizophrenia. Neuron 72 : 951–963 doi:10.1016/j.neuron.2011.11.007
72. SandersSJ, Ercan-SencicekAG, HusV, LuoR, MurthaMT, et al. (2011) Multiple recurrent de novo CNVs, including duplications of the 7q11.23 Williams syndrome region, are strongly associated with autism. Neuron 70 : 863–885 doi:10.1016/j.neuron.2011.05.002
73. BeroukhimR, MermelCH, PorterD, WeiG, RaychaudhuriS, et al. (2010) The landscape of somatic copy-number alteration across human cancers. Nature 463 : 899–905 doi:10.1038/nature08822
74. MermelCH, SchumacherSE, HillB, MeyersonML, BeroukhimR, et al. (2011) GISTIC2.0 facilitates sensitive and confident localization of the targets of focal somatic copy-number alteration in human cancers. Genome Biol 12: R41 doi:10.1186/gb-2011-12-4-r41
75. TaylorBS, BarretinaJ, SocciND, DecarolisP, LadanyiM, et al. (2008) Functional copy-number alterations in cancer. PLoS ONE 3: e3179 doi:10.1371/journal.pone.0003179
76. The Cancer Genome Atlas Research Network (2008) Comprehensive genomic characterization defines human glioblastoma genes and core pathways. Nature 455 : 1061–1068 doi:10.1038/nature07385
77. WalterMJ, PaytonJE, RiesRE, ShannonWD, DeshmukhH, et al. (2009) Acquired copy number alterations in adult acute myeloid leukemia genomes. Proc Natl Acad Sci USA 106 : 12950–12955 doi:10.1073/pnas.0903091106
78. BullingerL, KrönkeJ, SchönC, RadtkeI, UrlbauerK, et al. (2010) Identification of acquired copy number alterations and uniparental disomies in cytogenetically normal acute myeloid leukemia using high-resolution single-nucleotide polymorphism analysis. Leukemia 24 : 438–449 doi:10.1038/leu.2009.263
79. TaylorBS, SchultzN, HieronymusH, GopalanA, XiaoY, et al. (2010) Integrative genomic profiling of human prostate cancer. Cancer Cell 18 : 11–22 doi:10.1016/j.ccr.2010.05.026
80. The Cancer Genome Atlas Research Network (2011) Integrated genomic analyses of ovarian carcinoma. Nature 474 : 609–615 doi:10.1038/nature10166
81. CurtisC, ShahSP, ChinS-F, TurashviliG, RuedaOM, et al. (2012) The genomic and transcriptomic architecture of 2,000 breast tumours reveals novel subgroups. Nature 486 : 346–352 doi:10.1038/nature10983
82. The Cancer Genome Atlas Research Network (2012) Comprehensive molecular portraits of human breast tumors. Nature 490: pp.61–pp.70.
83. The Cancer Genome Atlas Research Network (2012) Comprehensive molecular characterization of human colon and rectal cancer. Nature 487 : 330–337 doi:10.1038/nature11252
84. The Cancer Genome Atlas Research Network (2012) Comprehensive genomic characterization of squamous cell lung cancers. Nature 489: pp.519–pp.525.
85. Nik-ZainalS, AlexandrovLB, WedgeDC, Van LooP, GreenmanCD, et al. (2012) Mutational Processes Molding the Genomes of 21 Breast Cancers. Cell 149 : 979–993 doi:10.1016/j.cell.2012.04.024
86. RobinsonG, ParkerM, KranenburgTA, LuC, ChenX, et al. (2012) Novel mutations target distinct subgroups of medulloblastoma. Nature 488 : 43–48 doi:10.1038/nature11213
87. WalkerLC, KrauseL, kConFabInvestigators, SpurdleAB, WaddellN (2012) Germline copy number variants are not associated with globally acquired copy number changes in familial breast tumours. Breast Cancer Res Treat 134 : 1005–1011 doi:10.1007/s10549-012-2024-6
88. ZhangJ, DingL, HolmfeldtL, WuG, HeatleySL, et al. (2012) The genetic basis of early T-cell precursor acute lymphoblastic leukaemia. Nature 481 : 157–163 doi:10.1038/nature10725
89. HolmfeldtL, WeiL, Diaz-FloresE, WalshM, ZhangJ, et al. (2013) The genomic landscape of hypodiploid acute lymphoblastic leukemia. Nat Genet 45 : 242–252 doi:10.1038/ng.2532
90. The Cancer Genome Atlas Research Network (2013) Integrated genomic characterization of endometrial carcinoma. Nature 497 : 67–73 doi:10.1038/nature12113
91. WeischenfeldtJ, SimonR, FeuerbachL, SchlangenK, WeichenhanD, et al. (2013) Integrative genomic analyses reveal an androgen-driven somatic alteration landscape in early-onset prostate cancer. Cancer Cell 23 : 159–170 doi:10.1016/j.ccr.2013.01.002
92. McLeanCY, BristorD, HillerM, ClarkeSL, SchaarBT, et al. (2010) GREAT improves functional interpretation of cis-regulatory regions. Nat Biotechnol 28 : 495–501 doi:10.1038/nbt.1630
93. MakuninIV, PheasantM, SimonsC, MattickJS (2007) Orthologous microRNA genes are located in cancer-associated genomic regions in human and mouse. PLoS ONE 2: e1133 doi:10.1371/journal.pone.0001133
94. DengS, CalinGA, CroceCM, CoukosG, ZhangL (2008) Mechanisms of microRNA deregulation in human cancer. Cell Cycle 7 : 2643–2646 doi:10.4161/cc.7.17.6597
95. ENCODE Project Consortium, BernsteinBE, BirneyE, DunhamI, GreenED, et al. (2012) An integrated encyclopedia of DNA elements in the human genome. Nature 489 : 57–74 doi:10.1038/nature11247
96. KorenA, PolakP, NemeshJ, MichaelsonJJ, SebatJ, et al. (2012) Differential relationship of DNA replication timing to different forms of human mutation and variation. Am J Hum Genet 91 : 1033–1040 doi:10.1016/j.ajhg.2012.10.018
97. MaysharY, Ben-DavidU, LavonN, BiancottiJ-C, YakirB, et al. (2010) Identification and classification of chromosomal aberrations in human induced pluripotent stem cells. Cell Stem Cell 7 : 521–531 doi:10.1016/j.stem.2010.07.017
98. LaurentLC, UlitskyI, SlavinI, TranH, SchorkA, et al. (2011) Dynamic changes in the copy number of pluripotency and cell proliferation genes in human ESCs and iPSCs during reprogramming and time in culture. Cell Stem Cell 8 : 106–118 doi:10.1016/j.stem.2010.12.003
99. PasiCE, Dereli-ÖzA, NegriniS, FriedliM, FragolaG, et al. (2011) Genomic instability in induced stem cells. Cell Death Differ 18 : 745–753 doi:10.1038/cdd.2011.9
100. HusseinSM, BatadaNN, VuoristoS, ChingRW, AutioR, et al. (2011) Copy number variation and selection during reprogramming to pluripotency. Nature 471 : 58–62 doi:10.1038/nature09871
101. Martins-TaylorK, NislerBS, TaapkenSM, ComptonT, CrandallL, et al. (2011) Recurrent copy number variations in human induced pluripotent stem cells. Nat Biotechnol 29 : 488–491 doi:10.1038/nbt.1890
102. Dekel-NaftaliM, Aviram-GoldringA, LitmanovitchT, ShamashJ, Reznik-WolfH, et al. (2012) Screening of human pluripotent stem cells using CGH and FISH reveals low-grade mosaic aneuploidy and a recurrent amplification of chromosome 1q. Eur J Hum Genet 20 : 1248–1255 doi:10.1038/ejhg.2012.128
103. AbyzovA, MarianiJ, PalejevD, ZhangY, HaneyMS, et al. (2012) Somatic copy number mosaicism in human skin revealed by induced pluripotent stem cells. Nature 492 : 438–442 doi:10.1038/nature11629
104. YoungMA, LarsonDE, SunC-W, GeorgeDR, DingL, et al. (2012) Background mutations in parental cells account for most of the genetic heterogeneity of induced pluripotent stem cells. Cell Stem Cell 10 : 570–582 doi:10.1016/j.stem.2012.03.002
105. QuinlanAR, BolandMJ, LeibowitzML, ShumilinaS, PehrsonSM, et al. (2011) Genome sequencing of mouse induced pluripotent stem cells reveals retroelement stability and infrequent DNA rearrangement during reprogramming. Cell Stem Cell 9 : 366–373 doi:10.1016/j.stem.2011.07.018
106. ChengL, HansenNF, ZhaoL, DuY, ZouC, et al. (2012) Low incidence of DNA sequence variation in human induced pluripotent stem cells generated by nonintegrating plasmid expression. Cell Stem Cell 10 : 337–344 doi:10.1016/j.stem.2012.01.005
107. LuJ, LiH, HuM, SasakiT, BacceiA, et al. (2014) The Distribution of Genomic Variations in Human iPSCs Is Related to Replication-Timing Reorganization during Reprogramming. Cell Rep. doi:10.1016/j.celrep.2014.03.007
108. SoliminiNL, XuQ, MermelCH, LiangAC, SchlabachMR, et al. (2012) Recurrent Hemizygous Deletions in Cancers May Optimize Proliferative Potential. Science. doi:10.1126/science.1219580
109. DavoliT, XuAW, MengwasserKE, SackLM, YoonJC, et al. (2013) Cumulative Haploinsufficiency and Triplosensitivity Drive Aneuploidy Patterns and Shape the Cancer Genome. Cell. doi:10.1016/j.cell.2013.10.011
110. ScaruffiP, StiglianiS, MorettiS, CocoS, De VecchiC, et al. (2009) Transcribed-ultra conserved region expression is associated with outcome in high-risk neuroblastoma. BMC Cancer 9 : 441 doi:10.1186/1471-2407-9-441
111. KogureT, YanIK, LinW-L, PatelT (2013) Extracellular Vesicle-Mediated Transfer of a Novel Long Noncoding RNA TUC339: A Mechanism of Intercellular Signaling in Human Hepatocellular Cancer. Genes Cancer 4 : 261–272 doi:10.1177/1947601913499020
112. AhituvN, ZhuY, ViselA, HoltA, AfzalV, et al. (2007) Deletion of ultraconserved elements yields viable mice. PLoS Biol 5: e234 doi:10.1371/journal.pbio.0050234
113. SchmidtS, GerasimovaA, KondrashovFA, AdzhubeiIA, AdzuhbeiIA, et al. (2008) Hypermutable non-synonymous sites are under stronger negative selection. PLoS Genetics 4: e1000281 doi:10.1371/journal.pgen.1000281
114. MichaelsonJJ, ShiY, GujralM, ZhengH, MalhotraD, et al. (2012) Whole-genome sequencing in autism identifies hot spots for de novo germline mutation. Cell 151 : 1431–1442 doi:10.1016/j.cell.2012.11.019
115. Eyre-Walker A, Eyre-Walker YC (2014) How Much of the Variation in the Mutation Rate Along the Human Genome Can Be Explained? G3 (Bethesda). doi:10.1534/g3.114.012849.
116. AwadallaP, GauthierJ, MyersRA, CasalsF, HamdanFF, et al. (2010) Direct measure of the de novo mutation rate in autism and schizophrenia cohorts. Am J Hum Genet 87 : 316–324 doi:10.1016/j.ajhg.2010.07.019
117. Wellcome Trust Case ControlConsortium, CraddockN, HurlesME, CardinN, PearsonRD, et al. (2010) Genome-wide association study of CNVs in 16,000 cases of eight common diseases and 3,000 shared controls. Nature 464 : 713–720 doi:10.1038/nature08979
118. KozomaraA, Griffiths-JonesS (2011) miRBase: integrating microRNA annotation and deep-sequencing data. Nucleic acids research 39: D152–D157 doi:10.1093/nar/gkq1027
Štítky
Genetika Reprodukční medicínaČlánek vyšel v časopise
PLOS Genetics
2014 Číslo 10
Nejčtenější v tomto čísle
- The Master Activator of IncA/C Conjugative Plasmids Stimulates Genomic Islands and Multidrug Resistance Dissemination
- A Splice Mutation in the Gene Causes High Glycogen Content and Low Meat Quality in Pig Skeletal Muscle
- Keratin 76 Is Required for Tight Junction Function and Maintenance of the Skin Barrier
- A Role for Taiman in Insect Metamorphosis