
Genome-Wide Association Study of CSF Levels of 59 Alzheimer's Disease Candidate Proteins: Significant Associations with Proteins Involved in Amyloid Processing and Inflammation
The use of quantitative endophenotypes from cerebrospinal fluid has led to the identification of several genetic variants that alter risk or rate of progression of Alzheimer's disease. Here we have analyzed the levels of 58 disease-related proteins in the cerebrospinal fluid for association with millions of variants across the human genome. We have identified significant, replicable associations with 5 analytes, Angiotensin-converting enzyme, Chemokine (C-C motif) ligand 2, Chemokine (C-C motif) ligand 4, Interleukin 6 receptor and Matrix metalloproteinase-3. Our results suggest that these variants play a regulatory role in the respective protein levels and are relevant to the inflammatory and amyloid processing pathways. Variants in associated with ACE and those associated with MMP3 levels also show association with risk for Alzheimer's disease in the expected directions. These associations are consistent in cerebrospinal fluid and plasma and in samples with only cognitively normal individuals suggesting that they are relevant in the regulation of these protein levels beyond the context of Alzheimer's disease.
Published in the journal:
. PLoS Genet 10(10): e32767. doi:10.1371/journal.pgen.1004758
Category:
Research Article
doi:
https://doi.org/10.1371/journal.pgen.1004758
Summary
The use of quantitative endophenotypes from cerebrospinal fluid has led to the identification of several genetic variants that alter risk or rate of progression of Alzheimer's disease. Here we have analyzed the levels of 58 disease-related proteins in the cerebrospinal fluid for association with millions of variants across the human genome. We have identified significant, replicable associations with 5 analytes, Angiotensin-converting enzyme, Chemokine (C-C motif) ligand 2, Chemokine (C-C motif) ligand 4, Interleukin 6 receptor and Matrix metalloproteinase-3. Our results suggest that these variants play a regulatory role in the respective protein levels and are relevant to the inflammatory and amyloid processing pathways. Variants in associated with ACE and those associated with MMP3 levels also show association with risk for Alzheimer's disease in the expected directions. These associations are consistent in cerebrospinal fluid and plasma and in samples with only cognitively normal individuals suggesting that they are relevant in the regulation of these protein levels beyond the context of Alzheimer's disease.
Introduction
Cerebrospinal fluid (CSF) contains promising biomarkers for neurological and psychiatric diseases such as Alzheimer's disease (AD), schizophrenia, and Parkinson's disease [1]–[4]. The brain directly and rapidly influences the composition of CSF, and as such, CSF analytes may provide insights into neurological and psychiatric disease pathways that may not be identifiable using blood or other biological fluids.
The use of endophenotypes in genome-wide association studies (GWAS) has provided novel insights into pathways and proteins that are associated with AD onset and progression [5], [6]. We have demonstrated the utility of CSF amyloid-beta (Aβ), apolipoprotein E (ApoE) and tau levels as endophenotypes for genetic studies of AD [7]–[16]. In our most recent work we used nearly 1,300 samples to conduct a GWAS with CSF tau levels [9]. In that study, Cruchaga et al. identified three genome-wide significant loci, including rs9877502, which also showed a consistent association with AD risk, tangle pathology, and global cognitive decline in independent datasets. The success of these and other similar efforts has led to broader efforts to develop and leverage datasets of this type [17]–[27].
While amyloid plaques and neurofibrillary tangles are the primary pathological features of AD, genetic, clinical, and animal studies demonstrate that endocytosis, cholesterol metabolism, and inflammatory and immune responses also play an important roles in AD pathogenesis [28]. To further leverage the advantages of the endophenotype based approach, we have sought to use analytes related to these other aspects of AD pathology. For this work we have obtained data from the Rules Based Medicine, Inc. (RBM) (Austin, TX) Human DiscoveryMAP Panel. This panel includes over 175 analytes selected from the constellation of known cytokines, chemokines, metabolic markers, hormones, growth factors, tissue remodeling proteins, angiogenesis markers, acute phase reactants, cancer markers, kidney damage markers, and central nervous system biomarkers. Analytes were quantitatively measured in CSF samples from 574 samples (including both cognitively normal and demented individuals) from two independent datasets to identify novel phenotypes that may contribute to the pathogenesis of AD. After careful quality control and evaluation of the literature we selected 59 AD-related analytes for analysis in genome-wide association studies. We identified genome-wide significant associations between putatively functional SNPs and five phenotypes (Angiotensin-converting enzyme (ACE), Chemokine (C-C motif) ligand 2 (CCL2), Chemokine (C-C motif) ligand 4 (CCL4), Interleukin 6 receptor (IL6R) and Matrix metalloproteinase-3 (MMP3)). The genetic basis of variance in these important disease-related analytes may provide insights into the mechanisms contributing to AD and other human diseases.
Results
From the combined GWAS on 59 phenotypes with connections to AD in our literature search (table 1) and with 5.8M SNPs (table 1), we identified 335 SNPs associated with five CSF phenotypes where p<1.47×10⁻¹⁰ (Bonferroni correction for 342 million tests) and other filtering criteria (see Methods: Statistical Analysis) were met (Table S1). At least one study-wide significant marker was directly genotyped (not imputed) for each locus that showed association. While there were other genome-wide significant associations with several of the other 54 phenotypes, these signals did not meet the additional filtering criteria. At least one SNP met the study-wide significance level (1.46×10⁻¹⁰) for each of the five phenotypes discussed in detail below (Table 2). All associations were robust to adjustment for APOE ε4 genotype and CDR. In addition, all associations were qualitatively stable in clinical case/control strata as well as in strata approximating presence or absence of amyloid deposition based on CSF Aβ42 levels (Table 3). The most significant marker for each phenotype, all SNPs in the associated regions with putative function, and markers with previous records in the National Human Genome Research Institute (NHGRI) catalog of published genome-wide association studies (downloaded November 19th, 2013; http://www.genome.gov/gwastudies/) are listed in Table 2. P-values of all SNPs in the region surrounding each significant association are plotted in Figure 1. Manhattan plots for the five phenotypes can be found in supplementary figures S1-S5. Detailed descriptions of each gene can be found in Text S1.


Effects of age and gender
We observed a significant association between CSF MMP3 and CCL2 and gender, where both analytes were lower in females relative to males in cognitively normal samples from both ADNI and the Knight ADRC. We also observed significantly increased MMP3 and CCL2 levels with increasing age in cognitively normal samples from both ADNI and the Knight ADRC. We failed to detect consistent association in both the ADNI and Knight ADRC samples with plasma levels of these analytes and age or gender. Full results including slopes of the regression models can be found in table S2 (CSF results) and table S3 (plasma results).
Association results
Angiotensin-converting enzyme (ACE)
We identified seven SNPs significantly associated with ACE levels in CSF (Figure 1A). The minor allele of rs4968782 was associated with higher ACE CSF protein levels (p = 3.94×10⁻¹²) and explains 11% of the variance in CSF ACE levels. The signal was consistent in cases/controls and in CSF Aβ42 strata defining presence/absence of Aß pathology and was also observed between this SNP and plasma ACE levels (p = 7.93×10⁻¹⁶). A synonymous substitution in the ACE gene, rs4343 (rs4968782/rs4343: r2 = 0.93; D′ = 1.0), was also associated with ACE levels in CSF and plasma (p = 3.71×10⁻⁸; p = 1.10×10⁻⁸, respectively). CSF and plasma levels of ACE showed a significant and moderate correlation (Pearson's correlation coefficient = 0.28, p = 4.86×10⁻⁶). Another synonymous substitution, rs4316 is also in high LD with these markers and shows significant association with CSF and plasma levels of ACE (see table 3). Both rs4343 and rs4316 are predicted as “likely to affect binding transcription factors” by RegulomeDB. None of these SNPs remained significant after conditioning upon the others. Rs4343 also appears in the NHGRI GWAS catalog associated with increased ACE activity levels in serum [29]. Association with AD status was observed (all four SNPs p<0.0075) in 17,008 AD cases and 37,154 controls from the International Genomics of Alzheimer's Project (IGAP) as described by Lambert et al and accessible at http://www.pasteur-lille.fr/en/recherche/u744/igap/igap_download.php [30]. For each of the four ACE SNPs, rs4968782, rs4459609, rs4316 and rs4343, the same allele was associated with increased ACE levels and decreased risk for AD (table 3).
Chemokine (C-C motif) ligand 2 (CCL2) also known as monocyte chemotactic protein 1
We identified one SNP, rs2228467, which results in a non-synonymous change (V41A) in the chemokine binding protein-2 (CCBP2) that is associated with increased CCL2 protein levels (CSF p = 3.71×10⁻¹⁸). This marker accounts for 13% of the variance in CSF CCL2 levels. Other SNPs in this region with moderate linkage disequilibrium (LD) also showed strong, but not study-wide significant, associations (Figure 1B). The association of rs2228467 with CSF levels of CCL2 remained significant in cases/controls and in CSF Aβ42 strata defining presence/absence of Aβ pathology and was nominally associated with CCL2 levels in plasma (table 3). CSF and plasma CCL2 levels were significantly correlated (Pearson's correlation coefficient = 0.23, p = 1.93×10⁻⁴). Both SIFT and PolyPhen2 predicted the rs2228467 V41A change to be damaging. The IGAP analysis failed to detect association between rs2228467 and risk for AD (table 3) [30]. We failed to detect association between CSF CCL2 levels and AD status (p = 0.90). This SNP was not associated with other phenotypes in the NHGRI GWAS catalog.
Chemokine (C-C motif) ligand 4 (CCL4) also known as macrophage inflammatory protein 1 beta
We identified 66 polymorphisms associated with CCL4 levels in CSF. This is a trans effect, all associated SNPs are located within a 187 kb region of chromosome 3 surrounding the Chemokine (C-C Motif) Receptor-Like 2 (CCRL2) gene (figure 1C). The most significant association was observed with rs6808835 (p = 1.59×10⁻¹³). A non-synonymous SNP in the CCRL2 gene, rs6441977 (rs6808835/rs6441977: r2 = 0.93; D′ = 1.0), results in a V180M substitution and shows significant association with CSF CCL4 levels in the combined sample (p = 7.66×10⁻¹¹) with CCL4 levels decreasing with each copy of the minor allele. This SNP explains 10% of the variance in CSF CCL4 levels. Several significant, intergenic markers in this same region are predicted as “likely to affect transcription factor binding and gene expression” (rs6762266, rs11575821, rs11574428) and “likely to affect transcription factor binding” (rs113263161, rs3092960) using RegulomeDB. None of these SNPs remained significant after conditioning upon the others. In addition to the association in the total dataset, this SNP shows consistent association in cases/controls, in CSF Aβ42 strata defining presence/absence of Aβ pathology and with CCL4 levels in plasma (table 3). CSF and plasma levels of CCL4 were significantly correlated (Pearson's correlation coefficient = 0.37, p = 6.59×10⁻¹⁰). SIFT and PolyPhen 2 predicted the amino acid change to be benign. No SNPs associated with CCL4 showed significant association with AD in the IGAP analysis (table 3) and no significant SNPs were associated with other phenotypes in the NHGRI GWAS catalog.
Interleukin 6 receptor (IL6R)
We identified 176 SNPs significantly associated with soluble IL6R (sIL6R) levels in CSF. These significant SNPs were located in the region of chromosome 1 surrounding the TDRD12, SHE, and IL6R genes (figure 1D). The most significant association was with rs61812598 (p = 5.9×10−62). Two non-synonymous SNPs were also associated with increased sIL6R protein levels in both CSF and plasma: rs2228145 (gene = IL6R, D358A, CSF p = 2.70×10−62, plasma p = 4.64×10−67) and rs3811448 (gene = TDRD10, V215I, CSF p = 3.36×10⁻¹⁵, plasma p = 7.91×10⁻¹²). CSF and plasma levels of sIL6R showed a significant correlation (Pearson's correlation coefficient = 0.49, p = 2.20×10⁻¹⁶). In addition, rs2228145 exhibits nearly perfect LD with rs61812598 (r2 = 0.99; D′ = 1.0). Rs3811448 has a high D′ with both rs2228145 (D′ = 0.96) and rs61812598 (D′ = 0.96) but its r2 with these SNPs is low (r2 = 0.15 with both SNPs). Another significant SNP in this region, rs4129267, has nearly complete LD with both rs61812598 and rs2228145 (D′>0.99, r2>0.99 in both cases), and is predicted by RegulomeDB as “likely to affect transcription factor binding.” Tests conditioning on any of these SNPs results in no significant associations in this region. Associations with both rs2228145 and rs61812598 (essentially the same test as they exhibit nearly perfect LD) remained genome-wide significant when conditioning upon rs3811448. Rs2228145 accounts for about 40% of variance in CSF sIL6R levels. Neither amino acid change is predicted to affect its respective protein's function by SIFT or Polyphen 2. The IGAP analysis failed to detect association between the markers associated with sIL6R and AD risk (table 3) [30]. We found significant SNPs in our analyses that have been previously reported to be associated with asthma [31], C-reactive protein levels (rs4129267) [32], and coronary heart disease (rs2229238) [33] in the NHGRI GWAS catalog.
Matrix metalloproteinase-3 (MMP3)
Eighty-five SNPs were significantly associated with MMP3 levels (figure 1E). The most significant association was observed with rs573521 (p = 2.39×10−44). A non-synonymous mutation in MMP3, rs679620 (K45E), shows high LD with rs573521 (r2 = 0.99; D′ = 1.0). Neither of these two SNPs remained significant after conditioning upon the other. Rs679620 was also significantly associated with MMP3 levels in CSF (p = 4.93×10−44) with MMP3 levels increasing with each copy of the minor allele. This SNP accounts for about 30% of the variance in CSF MMP3 levels. Association of this marker is consistent in cases/controls and in CSF Aβ42 strata defining presence/absence of Aβ pathology and was also observed nominally with plasma MMP3 levels (table 3). CSF and plasma MMP3 levels were moderately and significantly correlated (Pearson's correlation coefficient = 0.33, p = 2.06×10⁻⁵). SIFT and PolyPhen 2 predicted the rs679620 K45E amino acid change to be benign. Rs948399 also showed significant association and was predicted by RegulomeDB as “likely to affect transcription factor binding.” Three SNPs, rs573521, rs645419 and rs679620 showed nominal significance in the IGAP AD association analysis (table 3). From the NHGRI GWAS catalog, five SNPs previously reported to be associated with MMP1 levels in plasma in a recent genome-wide association study (rs7926920, rs11225434, rs495366, rs603050, and rs650108) [34] are also significantly associated with MMP3 levels in CSF in our data. MMP3 and MMP1 are located in the same region on chromosome 11 and show strong correlation in their pattern of expression [35], [36] suggesting that there may be coordinated regulation of these two genes. These SNPs are located in the 37 kb region between MMP3 and MMP1 and show high LD (D′∼1) with rs573521 and rs679620.
Multivariate analysis of top SNPs
We used Multiphen, to perform a multivariate test of the linear combination of phenotypes most associated with the genotypes at each of our top SNPs [37]. At least one marker from each of the loci in our top hits showed genome-wide significance in the joint models (Table 4). Several SNPs showed strong association with sIL6R and prolactin (PRL). Rs2228467, which showed primary association with CCL2, also showed association with glutamic-oxaloacetic transaminase 1 (GOT1). Full results including p-values and metaanalysis of each of the top SNPs with each phenotype are provided in Table S4.

Discussion
We have identified loci significantly associated with levels of five AD-related CSF analytes. Our findings include cis effects (defined as SNPs within 5 kb on either side of the transcribed gene) for ACE, sIL6R and MMP3 levels and trans effects for CCL2 and CCL4 levels. For each of the loci except ACE, a non-synonymous SNP is among the most strongly associated variants. SNPs in all five loci were associated with each of the analytes even after a highly conservative multiple test correction (alpha = 1.46×10⁻¹⁰). All results are consistent when analyses are stratified by clinical status and when stratified by CSF Aβ42 levels that are indicative of AD pathology, suggesting that these results are relevant in normal conditions, not just in the context of AD. In addition, all of the associated SNPs showed association with their respective plasma analytes, further supporting the robustness of the genetic associations. The ACE, MMP3 and CCL2 proteins have been previously described to have an impact on amyloid beta processing. The remaining proteins are involved in the pro-inflammatory response. The results of our Multiphen analysis did not provide strong evidence that these SNPs regulate expression of multiple traits in similar pathways.
Angiotensin-converting enzyme (ACE)
Angiotensin converting enzyme (ACE) is encoded by the ACE gene (17q23.3) and has been previously implicated in AD pathogenesis. In vitro, ACE inhibits Aβ aggregation in an activity-dependent manner by slowing the rate of fibril formation [38]–[40]. ACE may inhibit Aβ aggregation by converting the highly amyloidogenic Aβ42 peptide into the more stable Aβ40 peptide [41]. In vivo, inhibition of ACE activity in an AD mouse model promotes Aβ42 deposition in the hippocampus [41]. Studies in mouse and human brain homogenate demonstrate that ACE causes Aβ degradation in a two-step process. First, ACE cleaves Aβ42 into Aβ40 and then Aβ40 undergoes degradation [41].
ACE activity is elevated in the CSF of AD patients [42]. Neuroblastoma cells exposed to synthetic Aβ42 oligomers, but not monomeric Aβ42, produce elevated ACE protein levels and ACE activity, suggesting that Aβ aggregates may stimulate the up-regulation of ACE in AD brains as a mechanism of combatting the accumulation of these protein aggregates.
Our findings suggest that SNPs within the ACE locus alter CSF and plasma ACE levels. Several SNPs in the ACE gene region have significant associations with increased levels of ACE. Conditional analyses suggest a single signal in this region is responsible for the association. While we are unable to determine the specific functional allele in this region, rs4343 and rs4316 are in nearly perfect LD with each other (D′ = 0.99, r2 = 0.91) and both are inferred to have regulatory function (table 3). Rs4316 has not been studied in AD or reported to be associated with other phenotypes to date. Rs4343 is a widely studied marker in ACE, and we found a significant association of this SNP with increased CSF ACE levels. The minor allele “G” of rs4343 has been previously reported to be significantly associated with increased plasma ACE activity levels and plasma ACE protein levels [21], [29]. Our observation of increased CSF ACE levels with the G allele of rs4343 is consistent with these reports.
In relation to AD, the findings with rs4343 have been varied with some studies suggesting association with CSF Aβ42 levels and AD risk while others do not [14], [43]–[49]. Recent data from 1269 samples with CSF and genetic data failed to detect association between CSF Aβ42, Tau or pTau181 levels and these SNPs in ACE (table 3) [9]. Results from the recent International Genomics of Alzheimer's Project provide evidence of association between the SNPs in ACE we report to be associated with higher CSF ACE levels and reduced risk for AD [30]. In addition, recent work using 600 samples with CSF ACE measurements found a significant increase in ACE levels with increasing ptau/Aβ42 ratio (which was used as a predictor of AD status) [50], further reinforcing the relationship between ACE levels and AD status.
Our results demonstrate in human subjects that SNPs in the ACE gene are associated with elevated CSF and plasma ACE protein levels and that these SNPs are also associated with reduced AD risk. Taken with in vitro and in vivo studies that demonstrate that ACE cleaves and clears Aβ in an activity-dependent manner, these findings suggest that individuals carrying polymorphisms that increase ACE protein, and possibly ACE activity, may be better able to clear accumulating Aβ aggregates and are thus at reduced risk for developing AD.
Matrix metalloproteinase-3 (MMP3)
Matrix metalloproteinase 3 (encoded by MMP3; located on 11q22.3) is hypothesized to contribute to endogenous, physiologic clearance of amyloid plaques. MMP3 is expressed in neurons, astrocytes, microglia and vascular cells [51]. MMP3 is preferentially localized in senile plaques in the parietal cortex of AD brains, while hippocampal plaques are relatively spared of MMP3 [52]. Aβ treatment causes upregulation of MMP3 expression in primary astrocyte cultures and in mixed hippocampal cultures [53]. MMP3 also degrades extracellular Aβ [54]. The closely related MMP2 and MMP9 proteins have been well studied in the context of AD pathogenesis. Astrocytes that surround plaques in AD mouse brains show enhanced MMP2 and MMP9 expression [55]. Conditioned astrocyte media is sufficient to reduce synthetic Aβ levels, which is abolished with treatment of inhibitors specific to MMP2 and MMP9 [55]. MMP9 can degrade fibrillar Aβ in vitro and plaques in hippocampal slice cultures [52], [56], [57]. In an AD mouse model, knocking out MMP2 and MMP9 results in increased steady-state Aβ [55]. Thus, MMP proteins may contribute to Aβ clearance by promoting Aβ catabolism.
Supporting the relationship of MMP3 with Alzheimer's disease, CSF MMP3 levels are increased in individuals with a ptau181/Aβ42 ratio indicative of AD [50]. In a previous study, we failed to detect an association between significant SNPs in this study and CSF Aβ42, Tau or pTau181 levels (table 3) [9]. Studies testing the association of MMP3 SNPs and haplotypes and risk for AD have produced mixed results [58]–[60]. There appears to be two tiers of association in this locus, one group of SNPs with p-values less than 1E-38, which includes the non-synonymous SNP rs679620, and another which p-values between 1E-08 and 1E-12, including several variants with inferred regulatory function. Conditional analyses of our data in this region indicate that the more strongly associated group of variants tags a single association signal and that no independent associations are detected in this region. While we cannot definitively identify the causal variant, rs679620, a non-synonymous SNP in the MMP3 region, was significantly associated with increased CSF MMP3 levels. This suggests a possible protective effect of this variant with respect to AD. We found that rs573521, rs645419 and rs679620 are associated with increased CSF MMP3 levels in this study and with reduced risk of AD in the IGAP study. These associations provide additional support for the role of MMP3 in AD pathology. In addition, the identification of SNPs in the intergenic region between MMP3 and MMP1 that are associated with both MMP3 and MMP1 levels suggest a common regulatory locus or close functional relationship between these members of the MMP gene family. The identification of SNPs near MMP3 that are associated with increased CSF MMP3 protein levels and reduced AD risk supports the protective role of MMP3 in clearing Aβ from human brains.
Chemokine (C-C motif) ligand 2 (CCL2)
CCL2, also called monocyte chemotactic protein-1 or MCP-1, is encoded by the CCL2 gene, located on chromosome 17q11.2-q12. It is a chemokine that is involved in immunoregulatory and pro-inflammatory processes. Amyloid plaques in AD brains are surrounded by activated immune cells that produce CCL2 among other chemokines [61]. In the absence of CCL2, amyloid pathology is accelerated in an AD mouse model, illustrating its important role in amyloid plaque clearance and pointing to a potentially reparative role in AD [62]. However, overexpression of CCL2 in an AD mouse model resulted in marked accumulation of reactive microglia and enhanced diffuse plaque accumulation, suggesting a role in Aβ aggregation [63]. In vitro work suggests that inhibition of CCL2 synthesis, reduces Aβ25–35 - and Aβ1–42-induced toxicity in primary neuronal cultures [64]. Interestingly, treatment of primary astrocyte cultures with synthetic Aβ42 causes astrocytes to increase CCL2 synthesis and release [64] and astrocyte migration in response to CCL2 is reduced in the presence of Aβ42 [65]. Thus, Aβ42 in AD brains may stimulate astrocyte-mediated CCL2 release and result in increased neuronal susceptibility to Aβ42 toxicity. The immune system involves a delicate and perfectly coordinated balance to function well; so, it is conceivable that CCL2 could play reparative and deleterious roles in AD pathogenesis.
A 2006 study evaluated CCL2 levels in serum samples from 48 individuals with Mild Cognitive Impairment (MCI), 94 AD patients and 24 age-matched controls [66]. Significantly increased plasma CCL2 levels were found in MCI and mild AD, but not in severe AD patients, as compared with controls. It has also been reported that increased CSF CCL2 levels at baseline in patients with prodromal AD correlated with a faster cognitive decline during the study's follow-up period [67]. The largest study to date examined 600 samples with CSF CCL2 measurements and observed a significant increase in CCL2 protein levels with ptau/Aβ42 ratio indicative of AD [50]. As is the case with most pro-inflammatory cytokines and cytokine receptors, the levels increase in AD cases.
Rs2228467, located within the CCBP2 gene, is significantly associated with increased CSF CCL2 protein levels. The CCBP2 gene encodes the chemokine-binding protein 2 and demonstrates a high affinity for binding to CCL2 [68]. Conditional analyses suggest that this marker accounts for the entirety of the association signal in this region. Previous studies suggest that chemokine receptors can demonstrate high affinity binding to chemotactic proteins [68]; however, how polymorphisms in one chemokine affect expression and function of associated chemokines is poorly understood. PolyPhen2 and SIFT both predicted this amino acid change to be damaging. A recent study found that rs2228467 is significantly associated with lower circulating monocyte counts in the blood (p = 1.57×10⁻⁷) [69]. If the rs2228467 polymorphism affects the chemokine function of CCBP2 or CCL2, then this could have downstream effects on the recruitment of macrophages and dendritic cells and, in turn, monocyte development.
CCL2 is known to be a necessary component in monocytes crossing the blood brain barrier [61], [70]. Our findings suggest that increased CCL2 associated with variation at rs2228467 may cause a chemotactic response that results in lower levels of circulating monocytes in the blood. While rs2228467 has strong effects on CCL2 levels and CSF CCL2 levels change in Alzheimer's disease, this SNP does not appear to impact risk for AD or CSF Aβ42 levels (p = 0.45) [9]. However, as CCL2 has been implicated in the pathogenesis of diseases characterized by monocytic infiltrates, like psoriasis [71], rheumatoid arthritis [72] and atherosclerosis [73] further investigation of rs2228467 with regard to these and related diseases is clearly warranted.
Here we have demonstrated in human subjects that SNPs in the CCBP2 gene are significantly associated with elevated CSF CCL2 protein levels. While, CSF CCL2 protein levels are not significantly associated with AD risk, evidence in mouse and cell models of AD suggest that increasing CCL2 levels increases microgliosis, amyloid plaque accumulation, and neuronal toxicity associated with Aβ. Taken together, these findings implicate CCBP2 and CCL2 as risk factors for AD pathogenesis.
Chemokine (C-C motif) ligand 4 (CCL4)
The CCL4 protein is encoded by the CCL4 gene (17q12). Studies evaluating the relationship between AD and inflammation have shown that CCL4 is expressed in subpopulations of reactive astrocytes and in microglia [74]. Neuritic plaques in AD are surrounded by activated microglia and astrocytes, which may produce inflammatory products when stimulated with Aβ [75]. Macrophages showed an increased secretion of CCL4 when treated with Aβ. Current information concerning CCL4 and other plaque-associated chemokines suggests that their production plays a role in the recruitment and accumulation of astrocytes and microglia in senile plaques [76]. These data suggest a possible relationship between CCL4 and AD pathogenesis.
We identified association between several SNPs, including one non-synonymous SNP, one synonymous SNP and five markers with predicted regulatory effects, and CSF CCL4 levels. Conditional analyses suggest that these SNPs tag a single association signal in this region. These SNPs do not show association with AD in the IGAP dataset or with CSF Aβ42, Tau or pTau181 levels (table 3). In addition, CSF CCL4 levels are not significantly associated with ptau181/Aβ42 ratio, a predictor of AD status [50]. These results do not indicate a role for CCL4 levels in risk for AD. However, CCL4 may play a role in HIV Type 1 transmission, AIDS disease progression, and acute kidney injury [77], [78]. Thus it will be important to evaluate the impact of rs6441977 (V168M polymorphism in CCRL2; associated with decreased CCL4 levels) and other markers with regulatory effects, on these and related diseases.
Interleukin 6 receptor (IL6R)
The interleukin 6 receptor (IL6R) is a protein encoded by the IL6R gene (1q21). Interleukin 6 is a potent pleiotropic pro-inflammatory cytokine that regulates cell growth and differentiation and plays an important role in the immune response and may also play a role in hippocampal neurogenesis [79].
We identified association with sIL6R levels for several SNPs in the IL6R region. Conditional analyses suggest that this is a single signal is driven by rs61812598 and other SNPs in high LD with these markers. Among these, rs2228145, rs3811448 and rs4129267 have predicted functional effects (see table 3). Rs3811448, a non-synonymous marker in the associated region is not significant when conditioning upon rs61812598, rs4129267 or rs2228145. Conversely, both rs61812598 rs4129267 and rs2228145 remain highly significant upon conditioning for rs3811448. This makes it clear that there is a single signal in this region, tagged by rs61812598, rs4129267 and rs2228145, which are in complete LD with each other.
Rs2228145 is a non-synonymous polymorphism in the IL6R gene, (D358A). While both SIFT and Polyphen 2 predict this change to be benign, rs2228145 has recently been shown to significantly increase plasma concentrations of sIL-6R, and reduce concentrations of membrane-bound IL-6R, resulting in impaired IL-6 responsiveness [80]. These results demonstrate that consequential changes in protein levels, likely resulting from the rs2228145 polymorphism, may translate into a functional impairment in IL-6R signaling. The rs2228145 polymorphism and other SNPs in this region have previously been shown to be significantly associated with plasma sIL-6 levels [21], [81] Trans-signaling is important for IL6-mediated cellular communication with molecular targets and that blocking trans-signaling lessen the deleterious effects of IL6 signaling [79]. Trans-signaling occurs via sIL6R, which is the proteolyzed product of IL6R. IL6R is proteolyzed by γ-secretase, which also cleaves APP [82]. Thus, polymorphisms in IL6R that modify IL6 signaling may result in modulation of signaling to many downstream targets that directly or indirectly influence AD pathogenesis.
Additionally, rs2228145 has been implicated previously as significantly increasing the risk of sporadic AD in a Chinese Han population in subjects without the APOE ε4 allele [83]. While sIL6R levels have been previously reported to decrease in AD cases [84], a recent study using a much larger sample found a significant increase in CSF sIL6R levels and increasing ptau181/Aβ42 ratio [50], suggesting a possible relationship between sIL6R levels and AD pathogenesis.
It has been proposed that there is a reciprocal relationship between IL-6 and Aβ. The IL-6/sIL-6R complex is reported to enhance APP transcription and expression [85]–[87]. Based on these data, rs2228145, which is associated with increased sIL6R levels, would be predicted to alter CSF Aβ42 levels and risk for AD. Unfortunately, we did not detect association of markers in IL6R with AD risk in the IGAP analysis and association with AD biomarkers was weak and inconsistent (table 3).
Rs4129267 is located within the intronic region of IL6R. This SNP is inferred to be “likely to affect binding” of the Olf-1 transcription factor using RegulomeDB. Like rs2228145, this marker is associated with sIL6R levels [21], [81]. In addition, this marker has been reported to be associated with levels of fibrinogen and C-reactive protein in blood as well as asthma and pulmonary function [31], [32], [88]–[90]. While it remains unclear what the causal marker is for this association signal due to the high levels of LD, the putative functional effects of both rs2228145 and rs4129267 make them top candidates for future investigation.
Dysregulated production of IL6 and its receptor are implicated in the pathogenesis of many diseases, including multiple myeloma [91], autoimmune diseases [92], and prostate cancer [93]. In addition, the association of several significant SNPs in our study with asthma, C-reactive protein levels and coronary heart disease highlights the relationship between the inflammatory response and these disorders. This information suggests a central role for the IL6/sIL6R complex in these and possibly other diseases and suggests that further characterization of the effects of rs2228145 and rs4129267 on human disease phenotypes is warranted.
In conclusion, we have identified significantly associated SNPs for five different AD-related analytes. These associations are robust across different biological fluids, dementia status and inferred presence of AD pathology both within and between independent sample sets. The SNPs observed to be associated with CSF ACE and MMP3 levels also appear to show association with AD in the predicted direction, providing support for previous hypotheses of involvement of these genes and their function in amyloid clearance for risk for AD. While inflammation is known to play an important role in AD, the pro-inflammatory markers investigated here, and their associated SNPs, do not appear to alter AD risk or disease progression. However, because the immune system is an exceedingly complex set of signaling cascades that must be perfectly regulated in order to function properly and because this regulation involves constant flux, we may not be able to fully capture the subtle effects in the function of these proteins that have a cumulative effect on AD pathogenesis over the course of a lifetime. The reproducibility of our findings in cognitively normal individuals and in plasma levels of the respective proteins as well as putative functional effects of these variants suggest that these SNPs may directly affect their respective proteins. Thus, insights into the genetic basis of variance in important pro-inflammatory protein levels are relevant to other diseases that are modulated by those processes. Finally, our findings demonstrate the continued utility of an endophenotype-based approach to finding functional alleles and disease-associated loci.
Methods
Subjects
ADNI
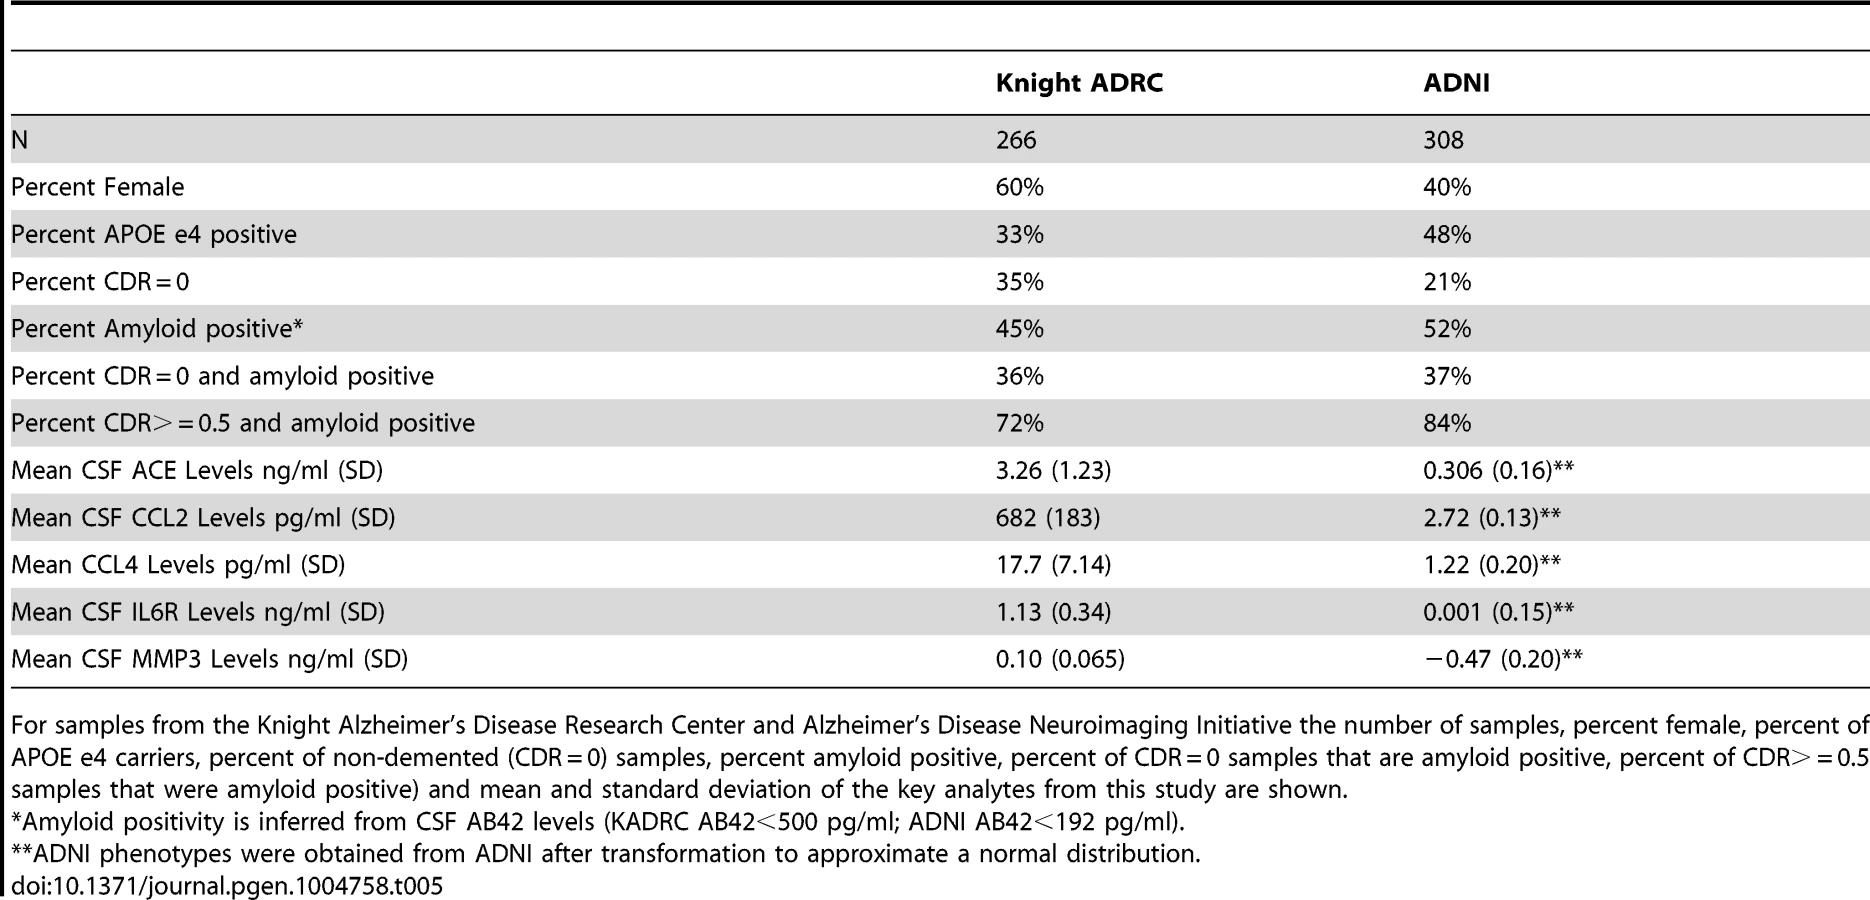
Data used in the preparation of this article were obtained from the ADNI database (www.loni.ucla.edu\ADNI). CSF was collected as described previously [94]. Genetic and phenotypic data for 308 samples was available for this study. Demographics of the samples included in this manuscript are reported in Table 5.
Knight ADRC
CSF samples from 266 individuals from the Knight-Alzheimer's disease Research Center at Washington University School of Medicine (Knight ADRC) were used in this study. A detailed description of these samples and CSF collection methods has been published previously [9], [95]. Demographics of these samples are described in Table 5.
Phenotypes
CSF and plasma samples from the Knight ADRC were evaluated for levels of 190 analytes using the Human DiscoveryMAP Panel and a Luminex 100 platform. CSF and plasma samples from the ADNI sample were assessed using the same Human DiscoveryMAP Panel and measurement platform [21], [94]. After filtering each set independently for phenotypes that had valid measurements in at least 90% of the samples, the intersection resulted in 76 analytes. For each of the 76 analytes that passed quality assurance in both datasets we performed a PubMed search on August 11, 2013. The purpose of this literature search was to reduce the phenotype list to those that are relevant to our AD centered samples from the Knight ADRC and ADNI, thus reducing the dimensionality of the data and concentrating statistical power on the most relevant phenotypes. Search terms included any of the following three terms, the name of the analyte on the chip, the official gene name and the official protein name and the term “Alzheimer's disease”. Analytes with more than 50 search results are considered to be “AD-related”. For analytes with fewer than 50 search results we inspected the manuscripts manually to determine whether there was evidence for a relationship with AD. A list of all analyte names on the chip along with official gene and protein names and results of the literature search is provided in supplementary Table S5.
Genotyping
All samples were genotyped using the Illumina 610 or the Omniexpress chip. Prior to statistical analysis, sample data were filtered using rigid quality control (QC) criteria by array: minimum call rate (98%), minimum minor allele frequency (2%), and exclusion of SNPs out of Hardy-Weinberg equilibrium (p<1×10⁻⁶). Unanticipated duplicates and related individuals were prioritized after calculating pairwise genome-wide estimates of identity-by-descent. Eigensoft was used to calculate principal component factors for each sample and confirm ethnicity [96]. These calculations were included as covariates in our analysis to adjust for possible confounding effects of population stratification.
Imputation
The 1000 genome data (June 2012 release) and the Beagle software were used to impute genotypes in the combined ADNI and Knight ADRC samples [97]. SNPs with a Beagle r2 of 0.3 or lower, a minor allele frequency (MAF) lower than 0.05, out of Hardy-Weinberg equilibrium (p<1×10⁻⁶), a call rate lower than 95% or a Gprobs score lower than 0.90 were removed. A total of 5,815,690 SNPs passed the QC process.
Statistical analysis
The Kolmogorov-Smirnov goodness-of-fit test was performed to evaluate normality of the 59 phenotypes of interest in the Knight ADRC samples. When deviations were observed, phenotypes were log transformed to approximate a normal distribution. The ADNI data for these samples and phenotypes had already been adjusted to fit normal distribution patterns by the ADNI biomarker core. Associations reported for age and gender were performed in cognitively normal samples only to reduce potential confounds of dementia.
We performed a genome-wide association for each of the 59 phenotypes to identify genetic loci associated with protein levels in CSF. For the initial association analysis in each series we used PLINK to perform linear regression and evaluated the association between the additive model for 5.8M SNPs and each phenotype [98]. Age, gender, and the principal components from Eigensoft analysis were included as covariates. Variance explained by each marker is reported as the difference in the model r2 between full models with and without the SNP included as a variable. Association of SNPs of interest with plasma analyte levels in the ADNI and Knight ADRC samples was calculated using the same approach. Analysis of each sample separately reduces the possible confound of demographic or ascertainment differences between the ADNI and Knight ADRC samples.
Genome-wide association results from the two datasets were meta-analyzed using the default settings in METAL [99]. Genomic inflation factor scores (GIF) were estimated using the R package GenABEL [100]. We set a strict and extremely conservative study-wide alpha level of 1.46×10⁻¹⁰ for the combined analysis. This was calculated by applying a Bonferroni correction for 5.8 million SNPs and 59 analytes, or 342.2 million tests. SNPs that met the initial significance criteria were further filtered using the following criteria. First, we rejected SNPs where the direction of the effect was different in the Knight ADRC and ADNI datasets. Second, we removed all SNPs where the minor allele frequency was less than 5% (unless they were directly genotyped). Finally, we rejected all associations with phenotypes where the genomic inflation factor was greater than 1.03 (GIF was calculated without SNPs where MAF is <0.05). Conditional analyses on each of the genome-wide significant SNPs were conducted using the –condition function in PLINK. We also performed additional analyses in the genome-wide significant loci to determine the stability of the results when stratified by clinical AD status and by CSF AB42 levels. CSF AB42 strata were based on levels that approximate amyloid deposition detected in PET scans using Pittsburgh Compound B (PIB). For the KADRC samples values less than 500 pg/ml indicate PIB retention/Aβ deposition, while values greater than 500 pg/ml indicate PIB negativity and the absence of Aβ deposition [95]. For the ADNI samples values less than 192 pg/ml indicate retention/Aβ deposition, while values greater than 192 pg/ml indicate PIB negativity and the absence of Aβ deposition [101].
We used the R package Multiphen, which performs a multivariate test of the linear combination of phenotypes most associated with the genotypes at each SNP, to evaluate each of the top hits for joint effects on multiple phenotypes in the study [37]. Analysis was carried out in the KADRC and ADNI samples separately using default settings as described here (http://cran.at.r-project.org/web/packages/MultiPhen/vignettes/MultiPhen.pdf).
GIF statistic for IL6R
Initial results of IL6R indicated a GIF statistic greater than 1.03 suggesting the p-values were inflated by confounding variables. By removing a 500 kb window on either side of the strongest signal we identified that the inflation was due to the large number of highly significant p-values surrounding the IL6R gene (adjusted GIF = 1.017). We did not remove this phenotype as it appears the inflation is due to a strong and replicable association signal in this single region. We analyzed other phenotypes that failed GIF quality control using the same strategy and did not observe similar phenomena.
Association with risk for Alzheimer's disease
For each locus where association was detected with the CSF endophenotypes we obtained data from the International Genomics of Alzheimer's Project (IGAP) association study of AD Stage 1 results [30]. IGAP is a large two-stage study based upon genome-wide association studies (GWAS) in individuals of European ancestry. In stage 1, IGAP used genotyped and imputed data for 7,055,881 single nucleotide polymorphisms (SNPs) to meta-analyse four previously-published GWAS datasets consisting of 17,008 Alzheimer's disease cases and 37,154 controls (The European Alzheimer's disease Initiative – EADI the Alzheimer Disease Genetics Consortium – ADGC The Cohorts for Heart and Aging Research in Genomic Epidemiology consortium – CHARGE The Genetic and Environmental Risk in AD consortium – GERAD). In stage 2, 11,632 SNPs were genotyped and tested for association in an independent set of 8,572 Alzheimer's disease cases and 11,312 controls. Finally, a meta-analysis was performed combining results from stages 1 & 2.
Bioinformatics analyses
We used ANNOVAR to annotate SNPs of interest with location and functional information [102]. RegulomeDB was used to annotate SNPs within known and predicted regulatory elements [103].
We used SIFT and POLYPHEN2 for preliminary assessments of the functional consequences of amino acid changes [104], [105].
All data collection was conducted under approval by the appropriate Institutional Review Boards. Analyses presented here were approved by the Institutional Review Board at Brigham Young University (E110252).
Supporting Information
Zdroje
1. FaganAM, RoeCM, XiongC, MintunMA, MorrisJC, et al. (2007) Cerebrospinal fluid tau/beta-amyloid(42) ratio as a prediction of cognitive decline in nondemented older adults. Arch Neurol 64 : 343–349.
2. SniderBJ, FaganAM, RoeC, ShahAR, GrantEA, et al. (2009) Cerebrospinal fluid biomarkers and rate of cognitive decline in very mild dementia of the Alzheimer type. Arch Neurol 66 : 638–645.
3. HuangJT, WangL, PrabakaranS, WengenrothM, LockstoneHE, et al. (2008) Independent protein-profiling studies show a decrease in apolipoprotein A1 levels in schizophrenia CSF, brain and peripheral tissues. Mol Psychiatry 13 : 1118–1128.
4. BiblM, MollenhauerB, EsselmannH, LewczukP, KlafkiHW, et al. (2006) CSF amyloid-beta-peptides in Alzheimer's disease, dementia with Lewy bodies and Parkinson's disease dementia. Brain 129 : 1177–1187.
5. ShenL, ThompsonPM, PotkinSG, BertramL, FarrerLA, et al. (2013) Genetic analysis of quantitative phenotypes in AD and MCI: imaging, cognition and biomarkers. Brain Imaging Behav 8 : 183–207 doi:10.1007/s11682-013-9262-z
6. CruchagaC, EbbertMW, KauweJK (2014) Genetic Discoveries in AD Using CSF Amyloid and Tau. Current Genetic Medicine Reports 1–7.
7. PetersonD, MungerC, CrowleyJ, CorcoranC, CruchagaC, et al. (2013) Variants in PPP3R1 and MAPT are associated with more rapid functional decline in Alzheimer's disease: The Cache County Dementia Progression Study. Alzheimer's & Dementia 10 : 366–71 doi:10.1016/j.jalz.2013.02.010
8. PetersonD, MungerC, CrowleyJ, CorcoranC, CruchagaC, et al. (2013) Variants in PPP3R1 and MAPT are associated with more rapid functional decline in Alzheimer's disease: The Cache County Dementia Progression Study. Alzheimers Dement 10 : 366–71 doi:10.1016/j.jalz.2013.02.010
9. CruchagaC, KauweJS, HarariO, JinSC, CaiY, et al. (2013) GWAS of cerebrospinal fluid tau levels identifies risk variants for Alzheimer's disease. Neuron 78 : 256–268.
10. CruchagaC, KauweJS, NowotnyP, BalesK, PickeringEH, et al. (2012) Cerebrospinal fluid APOE levels: an endophenotype for genetic studies for Alzheimer's disease. Hum Mol Genet 21 : 4558–71.
11. KauweJS, CruchagaC, KarchCM, SadlerB, LeeM, et al. (2011) Fine mapping of genetic variants in BIN1, CLU, CR1 and PICALM for association with cerebrospinal fluid biomarkers for Alzheimer's disease. PLoS One 6: e15918.
12. KauweJS, CruchagaC, BertelsenS, MayoK, LatuW, et al. (2010) Validating predicted biological effects of Alzheimer's disease associated SNPs using CSF biomarker levels. J Alzheimers Dis 21 : 833–842.
13. CruchagaC, KauweJS, MayoK, SpiegelN, BertelsenS, et al. (2010) SNPs associated with cerebrospinal fluid phospho-tau levels influence rate of decline in Alzheimer's disease. PLoS Genet 6: e1001101 doi:10.1371/journal.pgen.1001101
14. KauweJS, WangJ, MayoK, MorrisJC, FaganAM, et al. (2009) Alzheimer's disease risk variants show association with cerebrospinal fluid amyloid beta. Neurogenetics 10 : 13–17.
15. KauweJS, CruchagaC, MayoK, FenoglioC, BertelsenS, et al. (2008) Variation in MAPT is associated with cerebrospinal fluid tau levels in the presence of amyloid-beta deposition. Proc Natl Acad Sci U S A 105 : 8050–8054.
16. KauweJS, JacquartS, ChakravertyS, WangJ, MayoK, et al. (2007) Extreme cerebrospinal fluid amyloid beta levels identify family with late-onset Alzheimer's disease presenilin 1 mutation. Ann Neurol 61 : 446–453.
17. BekrisLM, LutzF, YuCE (2012) Functional analysis of APOE locus genetic variation implicates regional enhancers in the regulation of both TOMM40 and APOE. J Hum Genet 57 : 18–25.
18. Elias-SonnenscheinLS, HelisalmiS, NatunenT, HallA, PaajanenT, et al. (2013) Genetic loci associated with Alzheimer's disease and cerebrospinal fluid biomarkers in a Finnish case-control cohort. PLoS One 8: e59676.
19. GiedraitisV, GlaserA, SarajarviT, BrundinR, GunnarssonMD, et al. (2010) CALHM1 P86L polymorphism does not alter amyloid-beta or tau in cerebrospinal fluid. Neurosci Lett 469 : 265–267.
20. HanMR, SchellenbergGD, WangLS, Alzheimer's Disease NeuroimagingI (2010) Genome-wide association reveals genetic effects on human Abeta42 and tau protein levels in cerebrospinal fluids: a case control study. BMC Neurol 10 : 90.
21. KimS, SwaminathanS, InlowM, RisacherSL, NhoK, et al. (2013) Influence of genetic variation on plasma protein levels in older adults using a multi-analyte panel. PLoS One 8: e70269.
22. KimS, SwaminathanS, ShenL, RisacherSL, NhoK, et al. (2011) Genome-wide association study of CSF biomarkers Abeta1–42, t-tau, and p-tau181p in the ADNI cohort. Neurology 76 : 69–79.
23. NhoK, CorneveauxJJ, KimS, LinH, RisacherSL, et al. (2013) Identification of functional variants from whole-exome sequencing, combined with neuroimaging genetics. Mol Psychiatry 18 : 739.
24. NhoK, CorneveauxJJ, KimS, LinH, RisacherSL, et al. (2013) Whole-exome sequencing and imaging genetics identify functional variants for rate of change in hippocampal volume in mild cognitive impairment. Mol Psychiatry 18 : 781–787.
25. RidgePG, KoopA, MaxwellTJ, BaileyMH, SwerdlowRH, et al. (2013) Mitochondrial haplotypes associated with biomarkers for Alzheimer's disease. PLoS One 8: e74158.
26. ThompsonPM, SteinJL, MedlandSE, HibarDP, VasquezAA, et al. (2014) The ENIGMA Consortium: large-scale collaborative analyses of neuroimaging and genetic data. Brain Imaging Behav
27. YoderKK, NhoK, RisacherSL, KimS, ShenL, et al. (2013) Influence of TSPO genotype on 11C-PBR28 standardized uptake values. J Nucl Med 54 : 1320–1322.
28. HoltzmanDM, MorrisJC, GoateAM (2011) Alzheimer's disease: the challenge of the second century. Sci Transl Med 3 : 77sr71.
29. ChungCM, WangRY, ChenJW, FannCS, LeuHB, et al. (2010) A genome-wide association study identifies new loci for ACE activity: potential implications for response to ACE inhibitor. Pharmacogenomics J 10 : 537–544.
30. LambertJC, Ibrahim-VerbaasCA, HaroldD, NajAC, SimsR, et al. (2013) Meta-analysis of 74,046 individuals identifies 11 new susceptibility loci for Alzheimer's disease. Nat Genet 45 : 1452–1458.
31. FerreiraMA, MathesonMC, DuffyDL, MarksGB, HuiJ, et al. (2011) Identification of IL6R and chromosome 11q13.5 as risk loci for asthma. Lancet 378 : 1006–1014.
32. DehghanA, DupuisJ, BarbalicM, BisJC, EiriksdottirG, et al. (2011) Meta-analysis of genome-wide association studies in >80 000 subjects identifies multiple loci for C-reactive protein levels. Circulation 123 : 731–738.
33. DaviesRW, WellsGA, StewartAF, ErdmannJ, ShahSH, et al. (2012) A genome-wide association study for coronary artery disease identifies a novel susceptibility locus in the major histocompatibility complex. Circ Cardiovasc Genet 5 : 217–225.
34. ChengYC, KaoWH, MitchellBD, O'ConnellJR, ShenH, et al. (2009) Genome-wide association scan identifies variants near Matrix Metalloproteinase (MMP) genes on chromosome 11q21-22 strongly associated with serum MMP-1 levels. Circ Cardiovasc Genet 2 : 329–337.
35. TolboomTC, PietermanE, van der LaanWH, ToesRE, HuidekoperAL, et al. (2002) Invasive properties of fibroblast-like synoviocytes: correlation with growth characteristics and expression of MMP-1, MMP-3, and MMP-10. Ann Rheum Dis 61 : 975–980.
36. DorrS, LechtenbohmerN, RauR, HerbornG, WagnerU, et al. (2004) Association of a specific haplotype across the genes MMP1 and MMP3 with radiographic joint destruction in rheumatoid arthritis. Arthritis research & therapy 6: R199–207.
37. O'ReillyPF, HoggartCJ, PomyenY, CalboliFCF, ElliottP, et al. (2012) MultiPhen: Joint Model of Multiple Phenotypes Can Increase Discovery in GWAS. PLoS ONE 7: e34861.
38. ObaR, IgarashiA, KamataM, NagataK, TakanoS, et al. (2005) The N-terminal active centre of human angiotensin-converting enzyme degrades Alzheimer amyloid beta-peptide. Eur J Neurosci 21 : 733–740.
39. HemmingML, SelkoeDJ (2005) Amyloid beta-protein is degraded by cellular angiotensin-converting enzyme (ACE) and elevated by an ACE inhibitor. J Biol Chem 280 : 37644–37650.
40. HuJ, IgarashiA, KamataM, NakagawaH (2001) Angiotensin-converting enzyme degrades Alzheimer amyloid beta-peptide (A beta); retards A beta aggregation, deposition, fibril formation; and inhibits cytotoxicity. J Biol Chem 276 : 47863–47868.
41. ZouK, YamaguchiH, AkatsuH, SakamotoT, KoM, et al. (2007) Angiotensin-converting enzyme converts amyloid beta-protein 1–42 (Abeta(1–42)) to Abeta(1–40), and its inhibition enhances brain Abeta deposition. J Neurosci 27 : 8628–8635.
42. HeM, OhruiT, MaruyamaM, TomitaN, NakayamaK, et al. (2006) ACE activity in CSF of patients with mild cognitive impairment and Alzheimer disease. Neurology 67 : 1309–1310.
43. NingM, YangY, ZhangZ, ChenZ, ZhaoT, et al. (2010) Amyloid-beta-Related Genes SORL1 and ACE are Genetically Associated With Risk for Late-onset Alzheimer Disease in the Chinese Population. Alzheimer disease and associated disorders
44. MinersJS, van HelmondZ, RaikerM, LoveS, KehoePG (2010) ACE variants and association with brain Abeta levels in Alzheimer's disease. Am J Transl Res 3 : 73–80.
45. HelbecqueN, CodronV, CottelD, AmouyelP (2009) An age effect on the association of common variants of ACE with Alzheimer's disease. Neurosci Lett 461 : 181–184.
46. MengY, BaldwinCT, BowirratA, WaraskaK, InzelbergR, et al. (2006) Association of polymorphisms in the Angiotensin-converting enzyme gene with Alzheimer disease in an Israeli Arab community. Am J Hum Genet 78 : 871–877.
47. KehoePG, KatzovH, AndreasenN, GatzM, WilcockGK, et al. (2004) Common variants of ACE contribute to variable age-at-onset of Alzheimer's disease. Human genetics 114 : 478–483.
48. BelbinO, BrownK, ShiH, MedwayC, AbrahamR, et al. (2011) A multi-center study of ACE and the risk of late-onset Alzheimer's disease. Journal of Alzheimer's disease: JAD 24 : 587–597.
49. BruandetA, RichardF, TzourioC, BerrC, DartiguesJF, et al. (2008) Haplotypes across ACE and the risk of Alzheimer's disease: the three-city study. Journal of Alzheimer's disease: JAD 13 : 333–339.
50. HarariO, CruchagaC, KauweJS, AinscoughBJ, BalesK, et al. (2014) Ptau-Aβ42 ratio as a continuous trait for biomarker discovery for early stage Alzheimer's disease in multiplex immunoassay panels of Cerebrospinal fluid. Biological Psychiatry 75 : 723–731.
51. YoshiyamaY, SatoH, SeikiM, ShinagawaA, TakahashiM, et al. (1998) Expression of the membrane-type 3 matrix metalloproteinase (MT3-MMP) in human brain tissues. Acta Neuropathol 96 : 347–350.
52. YoshiyamaY, AsahinaM, HattoriT (2000) Selective distribution of matrix metalloproteinase-3 (MMP-3) in Alzheimer's disease brain. Acta Neuropathol 99 : 91–95.
53. DebS, GottschallPE (1996) Increased production of matrix metalloproteinases in enriched astrocyte and mixed hippocampal cultures treated with beta-amyloid peptides. J Neurochem 66 : 1641–1647.
54. WhiteAR, DuT, LaughtonKM, VolitakisI, SharplesRA, et al. (2006) Degradation of the Alzheimer disease amyloid beta-peptide by metal-dependent up-regulation of metalloprotease activity. J Biol Chem 281 : 17670–17680.
55. YinKJ, CirritoJR, YanP, HuX, XiaoQ, et al. (2006) Matrix metalloproteinases expressed by astrocytes mediate extracellular amyloid-beta peptide catabolism. J Neurosci 26 : 10939–10948.
56. YanP, HuX, SongH, YinK, BatemanRJ, et al. (2006) Matrix metalloproteinase-9 degrades amyloid-beta fibrils in vitro and compact plaques in situ. J Biol Chem 281 : 24566–24574.
57. BackstromJR, LimGP, CullenMJ, TokesZA (1996) Matrix metalloproteinase-9 (MMP-9) is synthesized in neurons of the human hippocampus and is capable of degrading the amyloid-beta peptide (1–40). J Neurosci 16 : 7910–7919.
58. ReitzC, van RooijFJ, de MaatMP, den HeijerT, HofmanA, et al. (2008) Matrix metalloproteinase 3 haplotypes and dementia and Alzheimer's disease. The Rotterdam Study. Neurobiology of aging 29 : 874–881.
59. FlexA, GaetaniE, ProiaAS, PecoriniG, StrafaceG, et al. (2006) Analysis of functional polymorphisms of metalloproteinase genes in persons with vascular dementia and Alzheimer's disease. J Gerontol A Biol Sci Med Sci 61 : 1065–1069.
60. SaarelaMS, LehtimakiT, RinneJO, HervonenA, JylhaM, et al. (2004) Interaction between matrix metalloproteinase 3 and the epsilon4 allele of apolipoprotein E increases the risk of Alzheimer's disease in Finns. Neurosci Lett 367 : 336–339.
61. ConductierG, BlondeauN, GuyonA, NahonJL, RovereC (2010) The role of monocyte chemoattractant protein MCP1/CCL2 in neuroinflammatory diseases. J Neuroimmunol 224 : 93–100.
62. NaertG, RivestS (2011) CC chemokine receptor 2 deficiency aggravates cognitive impairments and amyloid pathology in a transgenic mouse model of Alzheimer's disease. J Neurosci 31 : 6208–6220.
63. KiyotaT, YamamotoM, XiongH, LambertMP, KleinWL, et al. (2009) CCL2 accelerates microglia-mediated Abeta oligomer formation and progression of neurocognitive dysfunction. PLoS One 4: e6197.
64. SeveriniC, PasseriPP, CiottiM, FlorenzanoF, PossentiR, et al. (2014) Bindarit, inhibitor of CCL2 synthesis, protects neurons against amyloid-beta-induced toxicity. J Alzheimers Dis 38 : 281–293.
65. Wyss-CorayT, LoikeJD, BrionneTC, LuE, AnankovR, et al. (2003) Adult mouse astrocytes degrade amyloid-beta in vitro and in situ. Nat Med 9 : 453–457.
66. GalimbertiD, FenoglioC, LovatiC, VenturelliE, GuidiI, et al. (2006) Serum MCP-1 levels are increased in mild cognitive impairment and mild Alzheimer's disease. Neurobiol Aging 27 : 1763–1768.
67. WestinK, BuchhaveP, NielsenH, MinthonL, JanciauskieneS, et al. (2012) CCL2 is associated with a faster rate of cognitive decline during early stages of Alzheimer's disease. PLoS ONE 7: e30525.
68. BoniniJA, MartinSK, DralyukF, RoeMW, PhilipsonLH, et al. (1997) Cloning, expression, and chromosomal mapping of a novel human CC-chemokine receptor (CCR10) that displays high-affinity binding for MCP-1 and MCP-3. DNA Cell Biol 16 : 1249–1256.
69. CrosslinDR, McDavidA, WestonN, ZhengX, HartE, et al. (2013) Genetic variation associated with circulating monocyte count in the eMERGE Network. Hum Mol Genet 22 : 2119–2127.
70. WilliamsDW, CalderonTM, LopezL, Carvallo-TorresL, GaskillPJ, et al. (2013) Mechanisms of HIV Entry into the CNS: Increased Sensitivity of HIV Infected CD14(+)CD16(+) Monocytes to CCL2 and Key Roles of CCR2, JAM-A, and ALCAM in Diapedesis. PLoS One 8: e69270.
71. VestergaardC, JustH, Baumgartner NielsenJ, Thestrup-PedersenK, DeleuranM (2004) Expression of CCR2 on monocytes and macrophages in chronically inflamed skin in atopic dermatitis and psoriasis. Acta dermato-venereologica 84 : 353–358.
72. McInnesIB, SchettG (2007) Cytokines in the pathogenesis of rheumatoid arthritis. Nature reviews Immunology 7 : 429–442.
73. BarlicJ, MurphyPM (2007) Chemokine regulation of atherosclerosis. Journal of leukocyte biology 82 : 226–236.
74. XiaMQ, QinSX, WuLJ, MackayCR, HymanBT (1998) Immunohistochemical study of the beta-chemokine receptors CCR3 and CCR5 and their ligands in normal and Alzheimer's disease brains. The American journal of pathology 153 : 31–37.
75. SmitsHA, RijsmusA, van LoonJH, WatJW, VerhoefJ, et al. (2002) Amyloid-beta-induced chemokine production in primary human macrophages and astrocytes. Journal of neuroimmunology 127 : 160–168.
76. AkiyamaH, BargerS, BarnumS, BradtB, BauerJ, et al. (2000) Inflammation and Alzheimer's disease. Neurobiol Aging 21 : 383–421.
77. LiangosO, AddabboF, TighiouartH, GoligorskyM, JaberBL (2010) Exploration of disease mechanism in acute kidney injury using a multiplex bead array assay: a nested case-control pilot study. Biomarkers: biochemical indicators of exposure, response, and susceptibility to chemicals 15 : 436–445.
78. ModiWS, LautenbergerJ, AnP, ScottK, GoedertJJ, et al. (2006) Genetic variation in the CCL18-CCL3-CCL4 chemokine gene cluster influences HIV Type 1 transmission and AIDS disease progression. American journal of human genetics 79 : 120–128.
79. CampbellIL, ErtaM, LimSL, FraustoR, MayU, et al. (2014) Trans-signaling is a dominant mechanism for the pathogenic actions of interleukin-6 in the brain. J Neurosci 34 : 2503–2513.
80. FerreiraRC, FreitagDF, CutlerAJ, HowsonJM, RainbowDB, et al. (2013) Functional IL6R 358Ala allele impairs classical IL-6 receptor signaling and influences risk of diverse inflammatory diseases. PLoS Genet 9: e1003444.
81. QiL, RifaiN, HuFB (2007) Interleukin-6 receptor gene variations, plasma interleukin-6 levels, and type 2 diabetes in U.S. Women. Diabetes 56 : 3075–3081.
82. ChalarisA, GewieseJ, PaligaK, FleigL, SchneedeA, et al. (2010) ADAM17-mediated shedding of the IL6R induces cleavage of the membrane stub by gamma-secretase. Biochim Biophys Acta 1803 : 234–245.
83. WangM, SongH, JiaJ (2010) Interleukin-6 receptor gene polymorphisms were associated with sporadic Alzheimer's disease in Chinese Han. Brain research 1327 : 1–5.
84. HampelH, SunderlandT, KotterHU, SchneiderC, TeipelSJ, et al. (1998) Decreased soluble interleukin-6 receptor in cerebrospinal fluid of patients with Alzheimer's disease. Brain research 780 : 356–359.
85. Del BoR, AngerettiN, LuccaE, De SimoniMG, ForloniG (1995) Reciprocal control of inflammatory cytokines, IL-1 and IL-6, and beta-amyloid production in cultures. Neuroscience letters 188 : 70–74.
86. VandenabeeleP, FiersW (1991) Is amyloidogenesis during Alzheimer's disease due to an IL-1-/IL-6-mediated ‘acute phase response’ in the brain? Immunology today 12 : 217–219.
87. RingheimGE, SzczepanikAM, PetkoW, BurgherKL, ZhuSZ, et al. (1998) Enhancement of beta-amyloid precursor protein transcription and expression by the soluble interleukin-6 receptor/interleukin-6 complex. Brain research Molecular brain research 55 : 35–44.
88. Sabater-LlealM, HuangJ, ChasmanD, NaitzaS, DehghanA, et al. (2013) Multiethnic meta-analysis of genome-wide association studies in >100 000 subjects identifies 23 fibrinogen-associated Loci but no strong evidence of a causal association between circulating fibrinogen and cardiovascular disease. Circulation 128 : 1310–1324.
89. MelzerD, PerryJR, HernandezD, CorsiAM, StevensK, et al. (2008) A genome-wide association study identifies protein quantitative trait loci (pQTLs). PLoS Genet 4: e1000072.
90. WilkJB, WalterRE, LaramieJM, GottliebDJ, O'ConnorGT (2007) Framingham Heart Study genome-wide association: results for pulmonary function measures. BMC Med Genet 8 Suppl 1: S8.
91. ChauhanD, UchiyamaH, AkbaraliY, UrashimaM, YamamotoK, et al. (1996) Multiple myeloma cell adhesion-induced interleukin-6 expression in bone marrow stromal cells involves activation of NF-kappa B. Blood 87 : 1104–1112.
92. IshiharaK, HiranoT (2002) IL-6 in autoimmune disease and chronic inflammatory proliferative disease. Cytokine & growth factor reviews 13 : 357–368.
93. TanD, WuX, HouM, LeeSO, LouW, et al. (2005) Interleukin-6 polymorphism is associated with more aggressive prostate cancer. The Journal of urology 174 : 753–756.
94. TrojanowskiJQ, VandeersticheleH, KoreckaM, ClarkCM, AisenPS, et al. (2010) Update on the biomarker core of the Alzheimer's Disease Neuroimaging Initiative subjects. Alzheimers Dement 6 : 230–238.
95. FaganAM, MintunMA, MachRH, LeeSY, DenceCS, et al. (2006) Inverse relation between in vivo amyloid imaging load and cerebrospinal fluid Abeta42 in humans. Ann Neurol 59 : 512–519.
96. PriceAL, PattersonNJ, PlengeRM, WeinblattME, ShadickNA, et al. (2006) Principal components analysis corrects for stratification in genome-wide association studies. Nat Genet 38 : 904–909.
97. BrowningSR (2008) Missing data imputation and haplotype phase inference for genome-wide association studies. Hum Genet 124 : 439–450.
98. PurcellS, NealeB, Todd-BrownK, ThomasL, FerreiraMA, et al. (2007) PLINK: a tool set for whole-genome association and population-based linkage analyses. Am J Hum Genet 81 : 559–575.
99. AbecasisG, WillerC (2007) Metal—Meta Analysis Helper. Center for Statistical Genetics
100. AulchenkoYS, RipkeS, IsaacsA, van DuijnCM (2007) GenABEL: an R library for genome-wide association analysis. Bioinformatics 23 : 1294–1296.
101. JagustWJ, LandauSM, ShawLM, TrojanowskiJQ, KoeppeRA, et al. (2009) Relationships between biomarkers in aging and dementia. Neurology 73 : 1193–1199.
102. WangK, LiM, HakonarsonH (2010) ANNOVAR: functional annotation of genetic variants from high-throughput sequencing data. Nucleic Acids Res 38: e164.
103. BoyleAP, HongEL, HariharanM, ChengY, SchaubMA, et al. (2012) Annotation of functional variation in personal genomes using RegulomeDB. Genome Res 22 : 1790–1797.
104. NgPC, HenikoffS (2003) SIFT: Predicting amino acid changes that affect protein function. Nucleic Acids Res 31 : 3812–3814.
105. AdzhubeiIA, SchmidtS, PeshkinL, RamenskyVE, GerasimovaA, et al. (2010) A method and server for predicting damaging missense mutations. Nat Methods 7 : 248–249.
Štítky
Genetika Reprodukční medicínaČlánek vyšel v časopise
PLOS Genetics
2014 Číslo 10
Nejčtenější v tomto čísle
- The Master Activator of IncA/C Conjugative Plasmids Stimulates Genomic Islands and Multidrug Resistance Dissemination
- A Splice Mutation in the Gene Causes High Glycogen Content and Low Meat Quality in Pig Skeletal Muscle
- Keratin 76 Is Required for Tight Junction Function and Maintenance of the Skin Barrier
- A Role for Taiman in Insect Metamorphosis