
Caudal Regulates the Spatiotemporal Dynamics of Pair-Rule Waves in
One of the most popular problems in development is how the anterior-posterior axis of vertebrates, arthropods and annelids is partitioned into segments. In vertebrates, and recently shown in the beetle Tribolium castaneum, segments are demarcated by means of gene expression waves that propagate from posterior to anterior as the embryo elongates. These waves are assumed to arise due to the regulation of a molecular clock by a frequency gradient. However, to date, neither a candidate nor a functional role has been identified for such a frequency gradient. Here we provide evidence that a static expression gradient of caudal regulates pair-rule oscillations during blastoderm stage in Tribolium. In such a static setup, a frequency gradient is essential to convert clock oscillations into a striped pattern. We further show that a frequency gradient might be essential even in the presence of axis elongation as a buffer against noise. Our work also provides the best evidence to date that Caudal acts as a type of morphogen gradient in the blastoderm of short-germ arthropods; however, Caudal seems to convey positional information through frequency regulation of pair-rule oscillations, rather than through threshold concentration levels in the gradient.
Published in the journal:
. PLoS Genet 10(10): e32767. doi:10.1371/journal.pgen.1004677
Category:
Research Article
doi:
https://doi.org/10.1371/journal.pgen.1004677
Summary
One of the most popular problems in development is how the anterior-posterior axis of vertebrates, arthropods and annelids is partitioned into segments. In vertebrates, and recently shown in the beetle Tribolium castaneum, segments are demarcated by means of gene expression waves that propagate from posterior to anterior as the embryo elongates. These waves are assumed to arise due to the regulation of a molecular clock by a frequency gradient. However, to date, neither a candidate nor a functional role has been identified for such a frequency gradient. Here we provide evidence that a static expression gradient of caudal regulates pair-rule oscillations during blastoderm stage in Tribolium. In such a static setup, a frequency gradient is essential to convert clock oscillations into a striped pattern. We further show that a frequency gradient might be essential even in the presence of axis elongation as a buffer against noise. Our work also provides the best evidence to date that Caudal acts as a type of morphogen gradient in the blastoderm of short-germ arthropods; however, Caudal seems to convey positional information through frequency regulation of pair-rule oscillations, rather than through threshold concentration levels in the gradient.
Introduction
The anterior-posterior (AP) axis of arthropods, annelids, and vertebrates is partitioned into segments. The French flag model, in which threshold concentrations of morphogen gradients are interpreted by downstream genes to partition a developing tissue [1], [2], provides the main theoretical framework explaining segmentation in Drosophila. Specifically, gradients of maternal factors span the AP axis of Drosophila providing positional information to downstream gap genes, which in turn diffuse in the syncytial blastoderm to form more localized morphogen gradients. Both maternal and gap gene gradients provide further positional information to the pair-rule genes whose striped expression is the first indication of segmentation in the embryo [3].
In Drosophila, all segments form more or less simultaneously in a syncytial blastoderm of fixed AP axis length. In contrast, vertebrate segmentation (somitogenesis) takes place sequentially in an elongating and cellularized embryo. A different model, the ‘clock and wavefront’ explains segmentation in vertebrates [4], [5]. Multiple genes (hairy/enhancer-of-split and genes of Notch, Wnt and FGF signaling pathways) show oscillatory expression in the presomitic mesoderm (PSM) of the vertebrate embryo and are thought to be constituents of a molecular clock [6], [7]. In cells located anterior to a wavefront, oscillations are arrested into stable stripes. The wavefront is thought to be defined by a moving threshold that forms within the overlapping posterior gradients of Wnt and FGF [8], [9] and an opposing retinoic acid gradient [10]. Oscillations seem to arrest gradually (i.e. they are modulated by a frequency gradient) as evidenced by kinematic expression waves that sweep the PSM from posterior to anterior [7].
In most short-germ arthropods, anterior segments form in a blastoderm, as in Drosophila, while posterior segments form subsequently during the germband stage out of a population of cells at the posterior end of the embryo (termed the ‘growth zone’) [11], reminiscent of somitogenesis in vertebrates. Although it is conceivable that short-germ arthropods utilize a ‘French flag’-based segmentation mechanism in the blastoderm and a ‘clock and wavefront’ mechanism in the germband, it has recently been shown that a segmentation clock operates in both the germband [12] and blastoderm [13] of the short-germ insect Tribolium castaneum, where waves of pair-rule gene expression (specifically Tc-even-skipped (Tc-eve)) propagate from posterior to anterior [13].
The identification of factors that provide positional information for segmentation in the blastoderm of short-germ arthropods has been controversial [14]–[18]. Demonstration of the clock-based nature of short-germ segmentation fuels this debate as attention now turns to the search for factors functioning as a wavefront. The homeodomain transcription factor Caudal (Cad) has been implicated as playing a prominent role in AP patterning in arthropods since its expression overlaps with the newly forming stripes [19]. Cad is required for segmentation in the Drosophila abdomen [20], and for posterior patterning in other species [21], [22]. It plays an even more prominent role in non-diptran insect segmentation; it is required for trunk segmentation in Nasonia vitripennis [23] and for both trunk and gnathal segmentation in Tribolium castaneum [24] and Gryllus bimaculatus [25]. However, the exact role of Cad in segmentation is still not known. Here we test the hypothesis that the posterior gradient of Tribolium cad (Tc-cad) expression regulates the oscillation frequency of pair-rule gene expression to produce kinematic waves in the Tribolium blastoderm. We found that the expression of Tc-eve was abolished in strong Tc-cad RNAi knock-down embryos, but in weak Tc-cad knock-down embryos, the Tc-eve expression domain was posteriorly shifted and its oscillation frequency reduced. Perturbing the Tc-cad gradient in different ways by knocking-down its regulators further demonstrated that the extension, intensity, and slope of the Tc-cad gradient correlated with the extension, frequency, and width of Tc-eve expression waves, respectively. As shown by computer simulations, these observations are consistent with the hypothesis that Tc-cad functions as a frequency gradient regulating the spatiotemporal dynamics of pair-rule gene oscillation in Tribolium. These observations, combined with the continued expression of Tc-cad in a posterior gradient suggest that Tc-cad also acts as a wavefront in the elongating germband. Our study highlights the concept of a frequency gradient as a pattern formation mechanism. Using computer modeling, we also showed that a graded frequency profile might even be essential within the clock-and-wavefront model as a buffer against noise.
Results
Characterizing Tc-cad expression in Tribolium
The wave dynamics of Tc-eve in Tribolium can be explained by assuming a posterior-to-anterior gradient that positively regulates the frequency of Tc-eve oscillations [13]. Tc-cad is an obvious candidate to encode such a frequency gradient because its mRNA expression forms a posterior-to-anterior gradient that overlaps the Tc-eve expression waves arising at the posterior throughout Tribolium segmentation (Figure 1 A–D). Since studying segmentation in the germband phase of Tribolium development is hindered by the truncation phenotype generated by most segmentation gene knock-downs, we largely restricted our analysis to the stripes that form during the blastoderm stage. The expression of Tc-cad in the blastoderm (Figure 1 E) is approximated with reasonable accuracy by a posterior-to-anterior linear gradient that plateaus at the posterior end (Figure 1 F; Text S3). We used three descriptors to characterize this gradient: maximum posterior (plateau) value, position of anterior border, and slope (Figure 1 F). We analyzed the temporal dynamics of the Tc-cad gradient by calculating its three descriptors at 14–17 and 17–20 hours after egg lay (AEL) (Figure 1 G), spanning the formation of the first and second Tc-eve expression stripes in wild type (WT) [13] (analysis of later times was precluded by primitive pit formation, asterisk in Figure 1 C). As shown in Figure 1 G, the anterior border of Tc-cad expression gradient did not experience a significant shift during the formation of the first and second Tc-eve stripes, (which is also evident in Figure 1 A, B). However, both the maximum posterior value and the slope of the Tc-cad gradient increased over time. This indicates that the Tc-cad gradient was building up during the formation of the first and second Tc-eve stripes, but did not undergo a substantial shift along the AP axis (Figure 1 H). Characterizing Tc-cad gradient dynamics with higher temporal resolution (Figure S1) indicates that this buildup phase occurred between 14 to 16 hours AEL (i.e. before completion of the first Tc-eve stripe), after which the gradient was more or less static. This argues against a substantial influence of Tc-cad temporal dynamics on the wave dynamics of Tc-eve expression in the blastoderm. By the time the third stripe formed in the germ rudiment, the Tc-cad gradient had retreated toward posterior (Figure 1 C).

The spatial distribution of Tc-cad renders it a probable wavefront candidate in a clock-and-wavefront model. In the traditional model, a wavefront should retract posteriorly (like Tc-cad expression during the germband stage). However, a static but smooth gradient (like Tc-cad expression during the formation of first and second Tc-eve stripes in the blastoderm) that modulates the frequency of Tc-eve oscillation is, in principle, capable of forming a striped expression pattern (Movies S1, lower panel) [13], [26]. Taking the initial buildup phase of the Tc-cad gradient into consideration (Movies S1, upper panel) yields similar results. However, this buildup phase is expected to slow down the formation of the first stripe (Figure S2). This agrees with experiment, since the first cycle of Tc-eve oscillations starts at 13.5 hours AEL and ends at 17 hours AEL (i.e. the first stripe takes 3.5 hours to form), while the second cycle starts at 17 hours AEL and ends at 20 hours (i.e. the second stripe takes 3 hours to form) [13]. However, this is not obvious in the timing results presented here (see below), since we chose to start our analysis at 14 hours AEL.
Regulation of the Tc-cad gradient
In both vertebrates and arthropods, canonical Wnt is a positive regulator of cdx/cad [25], [27]–[29]. Once bound by Wnt ligand, the receptor Frizzled recruits the β-catenin destruction complex (comprising Axin, APC, and other factors), rendering β-catenin free to enter the nucleus and bind Pangolin (TCF) with the help of Legless (Lgs), Pygopous (Pygo) and other coactivators [30] to activate Wnt targets. In Tribolium, wnt1 and wnt8 are expressed at the posterior pole of the blastoderm, and at the posterior end of the growth-zone in the germband [31], which is expected to produce a posterior gradient of Wnt activity, the formation of which is enhanced by the anterior localization of Wnt repressors in the blastoderm [28], [32].
Manipulating Wnt activity affected Tc-cad expression in the Tribolium blastoderm. Knocking down Tc-lgs (a positive Wnt regulator) by means of maternal RNAi (Methods) shifted the Tc-cad expression gradient posteriorly (compare Figure 2 C–C′ to Figure 2 A–A′). In addition, the posterior maximum value of Tc-cad and slope of the gradient were reduced in Tc-lgs RNAi embryos compared to WT (Figure 2 D–D″).

Knocking down Tc-apc1 (a negative Wnt regulator) repositioned the Tc-cad gradient anteriorly (Figure 2 G–H″). Interestingly, the maximum posterior value of the Tc-cad expression gradient at 14–17 hours AEL was lower in Tc-apc1 RNAi embryos than in WT embryos (Figure 2 H), but eventually reached WT levels by 17–20 hours AEL (Figure 2 H′). Thus, it appears that the Tc-cad expression gradient takes longer to mature in Tc-apc1 RNAi than in WT embryos, which might be indicative of early negative Wnt regulation of Tc-cad.
Knocking down another Wnt regulator, Tc-pan, also perturbed the Tc-cad expression gradient. Pan, a component of the activator complex, also acts as a repressor in the absence of nuclear β-catenin [33]. Hence, we expected Wnt activity to be reduced posteriorly but increased anteriorly in Tc-pan RNAi embryos compared to WT, resulting in a shallower Wnt gradient across the blastoderm, and consequently a shallower Tc-cad gradient. As expected, the border of the Tc-cad gradient in Tc-pan RNAi embryos shifted anteriorly, the gradient reached a lower maximum posterior value, and the slope was lower compared to WT (Figure 2 E–F″).
In Drosophila, two Hox3 type genes are involved in early patterning: bicoid (bcd), which is expressed anteriorly and plays a major role in AP patterning, and zerknüllt (zen), which is expressed dorsally and specifies the amnioserosa [34]. Tribolium lacks bcd [17] but one of its zen homologs, Tc-zen1, is expressed both anteriorly and dorsally [35]. Anterior expression precedes dorsal expression and is suspected to play a role in AP patterning [36]. As shown in Figure 2 I–J″, the Tc-cad gradient in Tc-zen1 RNAi embryos shifted anteriorly, but had the same slope and maximum posterior expression level as WT, indicating that Tc-zen1 represses Tc-cad anteriorly (see Figure 2 B for a summary of Tc-cad regulation).
Tc-cad gradient regulates Tc-eve waves in Tribolium
In Tribolium, Tc-eve is expressed in waves that shrink while propagating from posterior to anterior (Figure 3 A) [13]. Tc-eve and Tc-cad RNAi embryo display similar phenotypes lacking all post oral segments, and previous studies implicate cad in the regulation of eve in arthropods [24], [25].

Tc-cad RNAi
To examine a possible role of Tc-cad in regulating Tc-eve, we characterized the dynamics of Tc-eve expression in WT and Tc-cad RNAi embryos. Strong Tc-cad RNAi completely abolished Tc-eve expression (Figure S3 A). We produced milder effects by injecting lower concentrations of Tc-cad dsRNA. In these embryos, waves of Tc-eve expression propagated from posterior to anterior (Figure 3 B); however, the final positions of the Tc-eve stripes were shifted posteriorly compared to WT (compare Figure 3 B with Figure 3 A; Figure 4 A).

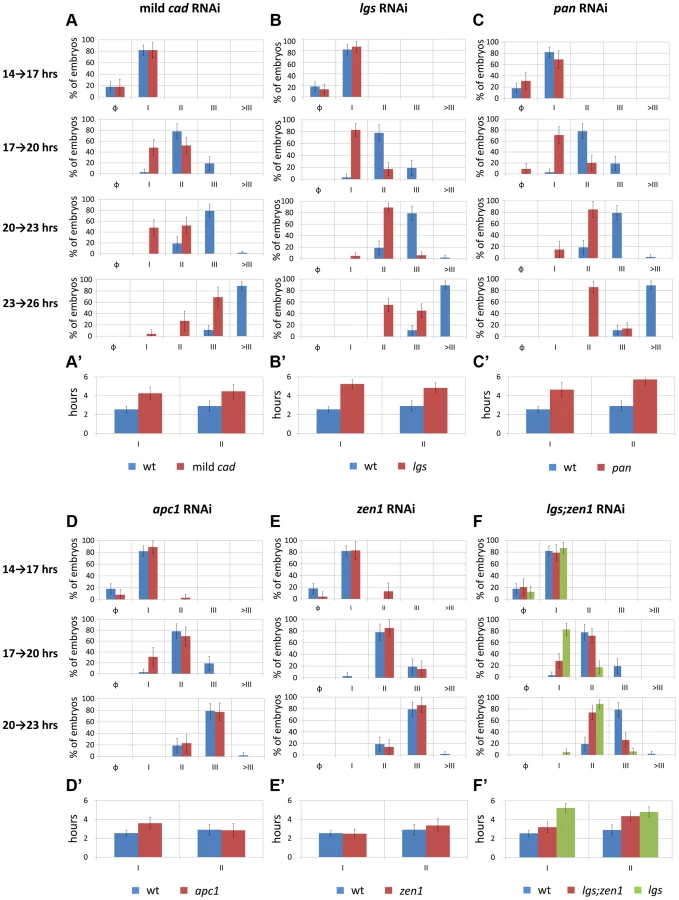
In the mild Tc-cad RNAi embryos, the three expected stripes did not fully form prior to germ rudiment condensation (Figure 3 B). To determine if this is due to a reduction in Tc-eve oscillation frequency, we measured the maximum frequency of Tc-eve oscillations by tracing Tc-eve expression over time at the posterior end of the blastoderm (Figure 5 A; Text S3). In WT, a new Tc-eve cycle peaked in every 3-hour egg collection (Figure 5 A, blue bars), consistent with the ∼3 hour periodicity we previously reported for Tc-eve oscillations at 23–24°C [13]. For mild Tc-cad RNAi, while cycle I initiated at 14 to 17 hrs AEL similar to WT, it persisted through 17 to 20 hrs AEL (Figure 5 A, red bar). The duration of Tc-eve cycles I and II in Tc-cad RNAi embryos (Figure 5 A′, Text S3) both lasted longer than in WT.
Tc-lgs RNAi
In Tc-lgs RNAi embryos, the anterior border of Tc-cad expression shifted posteriorly and the posterior maximum level decreased (Figure 2 C–D″). The Tc-eve waves were also shifted posteriorly, in accordance with the posterior shift of the Tc-cad gradient (compare Figure 3 C with Figure 3 A; Figure 4 B). In addition, the Tc-eve oscillation frequency was reduced (Figure 5 B, B′), corresponding to the reduction in posterior Tc-cad levels. Both the posterior shift and the reduced frequency of Tc-eve oscillations at the posterior end of the blastoderm upon the reduction of the Tc-cad gradient (either in mild Tc-cad RNAi or Tc-lgs RNAi) is predicted by a model in which the Tc-cad gradient regulates the frequency of Tc-eve oscillations (Movie S2, compare Figure 3 C′ to Figure 3 A′).
Tc-pan RNAi
In contrast, the Tc-cad gradient shifted anteriorly in Tc-pan RNAi embryos (Figure 2 E–F″). Correspondingly, Tc-eve waves were shifted anteriorly in Tc-pan RNAi compared to WT (compare Figure 3 D to Figure 3 A; Figure 4 C for 17–23 hours AEL). However, similar to Tc-lgs RNAi, Tc-cad mRNA levels were reduced at the posterior end of Tc-pan RNAi embryos (Figure 2 E–F″). The corresponding Tc-eve oscillation frequency was also reduced (Figure 5 C, C′). In addition to the anterior shift and frequency reduction of Tc-eve expression waves, the width of Tc-eve stripes in Tc-pan RNAi embryos was strikingly wider than those in WT (compare Figure 3 D to Figure 3 A; Figure 4 C′ and C″). This corresponds to the stretching effect of Tc-pan RNAi knock-down on the Tc-cad gradient, evident in the lower slope and anterior shift of this gradient in Tc-pan RNAi embryos compared to WT (Figure 2 F–F″).
Interestingly, in Tc-lgs RNAi embryos the first Tc-eve stripe, which formed at 17–20 hours AEL, was wider than that of WT (Figure 4 B′) in accordance with the reduction of the slope of Tc-cad gradient there (Figure 2 D–D″), but by 20–23 hours AEL the width of Tc-eve stripes is similar to WT (Figure 4 B′ and B″). In contrast to Tc-pan RNAi, Tc-cad slope reduction in Tc-lgs RNAi embryos might not be severe enough to result in detectable differences in the final width of Tc-eve stripes. Comparison of the Tc-cad gradient in RNAi embryos that were fixed and stained in parallel confirmed that while the level of Tc-cad expression at the posterior end in both Tc-lgs and Tc-pan was similar, the slope reduction in Tc-pan RNAi was more severe than in Tc-lgs RNAi embryos (Figure 2 M–M″).
The final anterior (but initial posterior) shift (Figure 4 C), the reduced frequency of Tc-eve oscillations at the posterior end of the blastoderm, and the wider Tc-eve stripe that were observed upon reducing and stretching the Tc-cad gradient in Tc-pan RNAi embryos is predicted by a model in which the Tc-cad gradient modulates the frequency of Tc-eve oscillations (Movie S3, Figure 3 D′).
Tc-apc1 RNAi
In Tc-apc1 RNAi embryos, Tc-eve waves shifted towards the anterior (compare Figure 3 E to Figure 3 A; Figure 4 D) corresponding to the anterior shift in the Tc-cad gradient (Figure 2 G–H″). The first Tc-eve stripe took longer to form in Tc-apc1 RNAi embryos compared to WT (Figure 5 D′), corresponding to a lower maximum posterior value of Tc-cad in Tc-apc1 RNAi embryos during 14–17 AEL (Figure 2 H). The second stripe formed with near normal kinetics in Tc-apc1 RNAi embryos (Figure 5 D′), in accordance with the eventual increase of the maximum posterior value of Tc-cad in Tc-apc1 RNAi during 17–20 AEL (Figure 2 H′).
Tc-zen1 RNAi
In Tc-zen1 RNAi embryos, Tc-eve waves shifted towards the anterior (compare Figure 3 F to Figure 3 A) corresponding to the anterior shift of the Tc-cad gradient (Figure 2 I–J″). The buildup of Tc-cad transcripts in the posterior in Tc-zen1 RNAi embryos was similar to those in WT (Figure 2 J–J″); correspondingly, the timing of Tc-eve waves in Tc-zen1 RNAi and WT embryos are very similar (Figure 5 E, E′). The anterior shift of Tc-eve waves upon anterior extension of the Tc-cad gradient (in Tc-apc1 and Tc-zen1 RNAi) is predicted by a model in which Tc-cad gradient modulates the frequency of Tc-eve oscillations (Movies S4 and S5; Figures 3 E′ and 3 F′).
The slope of Tc-cad gradient in both Tc-apc1 and Tc-zen1 RNAi embryos is largely similar to that of WT (Figure 2 H–H″ and J–J″), and the corresponding width of Tc-eve stripes is also similar to WT (Figure 4 D′, D″, E′ and E″), with the possibility of a slight initial reduction in the slope of the Tc-cad gradient in Tc-apc1 RNAi embryos (Figure 2 H) and the corresponding slight increase in Tc-eve stripe width (Figure 4 D′). The final stripe width reduction (at 20–23 hours AEL) in Tc-apc1 RNAi embryos (and possibly Tc-cad RNAi embryos; Figure 4 A′ and D′) could be due to a defect in the characteristic split of mature Tc-eve stripes into secondary, segmental stripes (compare Figure 3 E class III.1 embryo to Figure 3 A class III.1 embryo; while the splitting defect is variable in mild Tc-cad RNAi embryos, Figure S3 B).
Tc-lgs;Tc-zen1 double RNAi
Since Tc-lgs and Tc-zen1 RNAi shifted the Tc-cad gradient (and Tc-eve stripes) in opposite directions, we sought to examine the effect of the double Tc-lgs;Tc-zen1 RNAi knock-down. Tc-zen1 RNAi rescued to some degree the posterior shift in Tc-cad gradient induced by Tc-lgs RNAi (Figure 2 K–L″). The anterior border of the Tc-eve expression domain in Tc-lgs;Tc-zen1 double RNAi embryos is closer to that of WT than that of Tc-lgs RNAi (Figure 3G; Figure 4 F). Surprisingly, although the Tc-cad posterior expression level is not altered in Tc-zen1 RNAi, the posterior maximum expression level of Tc-cad was partially rescued in Tc-lgs;Tc-zen1 double RNAi embryos at 17–20 hours AEL (Figure 2 N–N″). Corresponding to this, The first Tc-eve stripe forms more quickly in Tc-lgs;Tc-zen1 RNAi compared to Tc-lgs RNAi (Figures 5 F, F′). However, this rescue effect eventually fades by the end of the blastoderm stage (20 to 23 hours AEL; Figure 5 F, F′), when Tc-zen1 is normally down-regulated (Figure S4).
The intermediate phenotype of Tc-lgs;Tc-zen1 RNAi between that of WT and Tc-lgs RNAi is predicted by a model in which Tc-cad gradient modulates the frequency of Tc-eve oscillations (Movie S6; Figure 3 G′).
Graded frequency profile as a buffer against noise
Axis elongation is an essential component of the clock-and-wavefront model. We have previously shown that blastoderm segmentation in Tribolium seems to be clock-based [13]. Despite the lack of axis elongation at the blastoderm stage, we did not exclude the possible existence of a retreating frequency gradient (wavefront). In the current study, we provide evidence that Tc-cad expression acts as a frequency gradient that modulates pair-rule gene oscillations in the blastoderm. Although a static step frequency gradient (i.e. suddenly dropping from non-zero to zero frequency) does not possess any patterning capacity, a static but gradually decreasing frequency gradient can generate a striped pattern [26]. Indeed, the first two stripes of Tc-eve form during a time period when the Tc-cad gradient is largely static. After the formation of the first two stripes, Tc-cad expression then abruptly retreats to the prospective growth zone (Figure 1 C). Later during axis elongation in the germband stage, Tc-cad expression retreats posteriorly with every newly forming Tc-eve stripe (Figure 1 D).
However, in principle, a step frequency gradient is capable of generating a striped pattern during the germband retraction phase. In vertebrates, a transition from high to low frequency (termed the ‘arrest front’) is thought to be determined by a threshold within a retracting posterior gradient. Such a mechanism might be very sensitive to the location of the threshold. Uncertainty in threshold location due to noise might lead to the generation of noisy patterns. On the other hand, gradually arresting oscillations would average out the noise and make the mechanism independent of precise threshold location. To investigate this, we developed two computer models for the clock-and-wavefront mechanism: one that utilizes a step frequency gradient by applying a threshold on a retracting smooth gradient (threshold-based model), and the other utilizes a smooth retracting frequency gradient without applying any thresholds (threshold-free model). Both generated similar striped patterns in the absence of noise (Figures 6 A–D; Movies S7 and S8). We then investigated the performance of both models after introducing random fluctuations in the intensity of the posterior gradient at each cell. This is expected to result in independent random shifts in threshold locations across the lateral axis of the embryo, which ultimately leads to salt-and-pepper noise at the stripe borders; however, the threshold-free model is more robust to this type of noise than the threshold-based model (Figures 6 E–H; Movies S9 and S10).

Discussion
In this work we provide evidence that an anterior-to-posterior gradient of Tc-cad expression in Tribolium regulates waves of Tc-eve pair-rule gene expression. By examining the spatiotemporal dynamics of Tc-eve expression in WT and RNAi knockdowns of different Tc-cad regulators, three correlations were revealed: (1) the spatial extent of Tc-cad correlates with that of Tc-eve waves, (2) the level of Tc-cad expression correlates with the frequency of Tc-eve oscillations at the posterior end of the blastoderm, and (3) the slope of the Tc-cad gradient correlates with the width of Tc-eve stripes. These three correlations are consistent with the hypothesis that the Tc-cad gradient modulates the frequency of pair-rule oscillations resulting in waves of gene expression (Figure 3 A′, C′–G′; Movies S2, S3, S4, S5, S6). A clock regulated by a frequency gradient is one way of transforming a temporally periodic process into a spatially periodic one; another would be the clock-and-wavefront model. One advantage of patterning with a frequency gradient, in contrast to the clock-and-wavefront model, is that it does not require axis elongation, which might explain how the Tribolium blastoderm is segmented. Another advantage, that we demonstrated using computer modelling, is that even within the framework of the clock-and-wavefront, utilizing a graded frequency profile renders the segmentation process more robust against noisy wavefront gene expression (Figure 6; Movies S7, S8, S9, S10).
The role of Caudal in segmentation
In Drosophila, maternal cad mRNA (Dm-cad) is ubiquitously expressed in the early blastoderm [37]. A posterior-to-anterior protein gradient of Dm-Cad forms due to translational repression by a reciprocal gradient of Dm-Bicoid [38]. Dm-Cad acts as an activator of posterior gap [39] and pair-rule genes [40] and binds to the enhancers of these genes [41], [42]. However, the mild segmentation defects in embryos in which the shape of Dm-Cad gradient has been altered argues against its function as a morphogen gradient [20], [43]. In the wasp Nasonia vitripennis, Nv-cad plays a more prominent role in activating gap and pair-rule genes, and a limited positioning role [23]. In the cricket Gryllus bimaculatus, Gb-cad was found to activate the pair-rule gene Gb-eve, and activate and position gap gene domains. This indicates that cad might act as a morphogen gradient in non-dipteran insects. In this study, we described similar results in Tribolium. We showed that in strong Tc-cad RNAi, expression of Tc-eve was abolished (Figure S2 A); while in weak Tc-cad RNAi, Tc-eve expression was posteriorly shifted (Figure 3 B). However, a morphogen gradient acting through concentration thresholds is less likely to act in positioning the highly dynamic pair-rule gene expression domains in Tribolium. Instead, we argue that Tc-cad regulates the frequency of a pair-rule clock to produce the observed wave dynamics.
Three cad homologs are found in mouse: Cdx1, Cdx2, and Cdx4. They are expressed in nested domains in the posterior end of the embryo. The Cdx1–Cdx2 double mutant exhibits fused somites [44], suggesting a role in somitogenesis. However, the Cdx1–Cdx2 double mutant also shows down-regulation of some caudalizing factors involved in somitogenesis (such as wnt3a) that are themselves Cdx regulators [45], [46]. Cdx genes also directly regulate Hox genes in a dose dependent manner [47], [48], and even regulate their activation times [49].
In summary, cad(-related) genes are involved in posterior patterning in many species. While it is not clear whether they play a permissive or instructive role, there is evidence that they might act as a morphogen gradient for gap genes in basal insects (like in Gryllus) and for Hox genes in vertebrates. In this study, we showed that Tc-cad regulates the spatiotemporal dynamics of Tribolium pair-rule genes in a dose dependent manner, stressing the instructive role of cad in the development of a non-dipteran insect. However, we cannot exclude the possibility that Tc-cad regulates pair-rule genes indirectly. Indeed, Tc-cad and Wnt might cross-regulate in a positive feedback loop to form identical gradients. In this case, it is hard to decide which is the direct regulator (or whether both Wnt and Tc-Cad are direct regulators) of Tc-eve expression without performing detailed cis-regulatory analysis of the Tc-eve locus.
The patterning capacity of frequency gradients and the robustness of the clock-and-wavefront model
In the original formulation of the clock-and-wavefront model, the anterior-to-posterior movement of a step frequency profile (i.e. suddenly dropping from non-zero to zero frequency) over an oscillating field of cells sequentially generates a striped pattern in an anterior-to-posterior order [4]. Later, this mechanism was modified by assuming a graded frequency profile to accommodate the observation that oscillations organize into kinematic waves in the chick PSM [7]. Several efforts have been made to identify molecular gradient(s) that regulate the frequency of the vertebrate segmentation clock. A posterior-to-anterior Wnt activity gradient was found to define the PSM oscillation domain in the mouse [50], [51]. Furthermore, down-regulation of Wnt activity reduced the clock frequency in both mouse and chick [52]. However, elevated and flattened constitutive stabilization of β-catenin in the mouse PSM only extended the oscillation domain, arguing against a role for the shape of Wnt activity gradient in segmentation [50]. A posterior-to-anterior FGF gradient in the PSM was found to define where oscillations arrest [9], [53], [54], but manipulating the level of FGF signaling does not alter the clock period [9], [52]. A gradient of Her13.2 in zebrafish was suggested to modulate clock frequency through heterodimerization with other zebrafish clock constituents: Her1 and Her7 [55], [56]. However, this idea was recently challenged and an alternative model of gradual switching between two oscillatory modules was suggested [57].
It is not known whether the gradual arrest of oscillations and the resulting kinematic waves in vertebrates have any functional role or are a mere peculiarity, since, based on computer simulations of the clock-and-wavefront model, stripe widths depend only on the wavefront velocity and the maximum clock period, not on the shape of the frequency profile [5]. Although used for cosmetic means within the clock-and-wavefront model, a graded frequency profile (even a static one) by itself has a patterning capacity [26]; kinematic waves were observed in an oscillating Zhabotinskii chemical reaction, where a reactant controlling the frequency of oscillation is distributed in a gradient [58], [59]. Since a static step frequency profile is unable to generate any stripes, the patterning capacity of a graded frequency profile might explain how blastodermal Tc-eve stripes in Tribolium form in the absence of axis elongation. Although the possibility of a yet unidentified frequency gradient that sweeps across the blastoderm still exists, we showed in this study that a strong candidate for the frequency gradient in Tribolium, Tc-cad, does not appreciably shift during the formation of the first two Tc-eve stripes (Figure 1 G, H).
In addition to its necessity in the absence of axis elongation, a graded frequency profile renders the clock-and-wavefront robust against noise in wavefront gene expression, as shown by computer simulations (Figure 6 and Movies S7, S8, S9, S10). This improvement in robustness might be due to the distributed nature by which oscillations are arrested in a graded frequency profile, in contrast to the total reliance on a single threshold in a step frequency profile. This and other recent works reinforce the importance of the concept of a frequency (or phase) gradient in sequential patterning [60], [61].
In clock-based segmentation models that utilize a static frequency gradient, stripes continue to shrink and never stabilize (although stripe shrinkage rate decreases with time, Movie S1). Stripe stabilization can be achieved by the retraction of the frequency gradient, kick-starting another ‘stabilizing’ genetic program that completely freezes the stripes. Such a stabilizing program might further refine the stripes and/or split them into secondary stripes. Interestingly, in the germband stage (where Tc-cad retracts continuously along with germband elongation), once a Tc-eve stripe forms, it splits into two secondary (segmental) stripes [13], whereas in the blastoderm stage, the first Tc-eve stripe does not split until Tc-cad expression completely retreats towards the posterior, at which time the second Tc-eve stripe is already formed and the third stripe is starting to emerge (Figure 1 B–D). This suggests a link between Tc-cad retraction and Tc-eve splitting. Stabilizing and refinement/splitting strategies might rely on auto - and cross-regulatory interactions between pair-rule genes or on a reaction diffusion mechanism [62] or both.
Materials and Methods
In situ hybridization, immunocytochemistry, and RNAi
In situ hybridization was performed using DIG-labeled RNA probes and anti-DIG::AP antibody (Roche). Signal was developed using NBT/BCIP (BM Purple, Roche), or Fast Red/HNPP (Roche). Immunocytochemistry was performed using anti-Eve (mouse monoclonal antibody 2B8, hybridoma bank, University of Iowa) as primary, and anti-mouse::POD as secondary antibody (ABC kit, Vector). AlexaFluor 488 tyramide (Invitrogen) was used to give green fluorescent signal. All expression analyses were performed using embryos from uninjected GA-1 strain (WT) or adult GA-1 females injected with double-stranded RNA (ds RNA) of the gene of interest. dsRNA was synthesized using the T7 megascript kit (Ambion) and mixed with injection buffer (5 mM KCl, 0.1 mM KPO4, pH 6.8) before injection. Used dsRNA concentrations: 200 ng/µl for severe Tc-cad, 7.5 ng/µl for mild Tc-cad, 200 ng/µl for Tc-lgs, 200 ng/µl for Tc-pan, 1 µg/µl for Tc-apc1, 1 µg/µl for Tc-zen1, and 200 ng/µl; 1 µg/µl for Tc-lgs;Tc-zen double RNAi.
Egg collections for developmental time windows
One hour developmental windows were generated by incubating one hour egg collections at 23–24°C for the desired length of time. For 3-hour developmental windows, eggs were collected after three hours instead of one hour. The beetles were reared in whole-wheat flour supplemented with 5% dried yeast.
Supporting Information
Zdroje
1. RogersKW, SchierAF (2011) Morphogen gradients: From generation to interpretation. Annu Rev Cell Dev Biol 27 : 377–407.
2. WolpertL (1969) Positional information and the spatial pattern of cellular differentiation. J Theor Biol 25 (1) 1–47.
3. Lawrence PA (1992) The making of a fly: The genetics of animal design. Oxford, UK: Blackwell Scientific.
4. CookeJ, ZeemanEC (1976) A clock and wavefront model for control of the number of repeated structures during animal morphogenesis. J Theor Biol 58 (2) 455–476.
5. OatesAC, MorelliLG, AresS (2012) Patterning embryos with oscillations: Structure, function and dynamics of the vertebrate segmentation clock. Development 139 (4) 625–639.
6. DequeantML, GlynnE, GaudenzK, WahlM, ChenJ, et al. (2006) A complex oscillating network of signaling genes underlies the mouse segmentation clock. Science 314 (5805) 1595–1598.
7. PalmeirimI, HenriqueD, Ish-HorowiczD, PourquieO (1997) Avian hairy gene expression identifies a molecular clock linked to vertebrate segmentation and somitogenesis. Cell 91 (5) 639–648.
8. AulehlaA, WehrleC, Brand-SaberiB, KemlerR, GosslerA, et al. (2003) Wnt3a plays a major role in the segmentation clock controlling somitogenesis. Dev Cell 4 (3) 395–406.
9. DubrulleJ, McGrewMJ, PourquieO (2001) FGF signaling controls somite boundary position and regulates segmentation clock control of spatiotemporal Hox gene activation. Cell 106 (2) 219–232.
10. Diez del CorralR, Olivera-MartinezI, GorielyA, GaleE, MadenM, et al. (2003) Opposing FGF and retinoid pathways control ventral neural pattern, neuronal differentiation, and segmentation during body axis extension. Neuron 40 (1) 65–79.
11. DavisGK, PatelNH (2002) Short, long, and beyond: Molecular and embryological approaches to insect segmentation. Annu Rev Entomol 47 : 669–699.
12. SarrazinAF, PeelAD, AverofM (2012) A segmentation clock with two-segment periodicity in insects. Science 336 (6079) 338–341.
13. El-SherifE, AverofM, BrownSJ (2012) A segmentation clock operating in blastoderm and germband stages of Tribolium development. Development 139 (23) 4341–4346.
14. KotkampK, KlinglerM, SchoppmeierM (2010) Apparent role of Tribolium orthodenticle in anteroposterior blastoderm patterning largely reflects novel functions in dorsoventral axis formation and cell survival. Development 137 (11) 1853–1862.
15. SchroderR (2003) The genes orthodenticle and hunchback substitute for bicoid in the beetle Tribolium. Nature 422 (6932) 621–625.
16. PeelAD, ChipmanAD, AkamM (2005) Arthropod segmentation: Beyond the Drosophila paradigm. Nat Rev Genet 6 (12) 905–916.
17. BrownS, FellersJ, ShippyT, DenellR, StauberM, et al. (2001) A strategy for mapping bicoid on the phylogenetic tree. Curr Biol 11 (2) R43–4.
18. LynchJA, BrentAE, LeafDS, PultzMA, DesplanC (2006) Localized maternal orthodenticle patterns anterior and posterior in the long germ wasp Nasonia. Nature 439 (7077) 728–732.
19. Chipman AD (2008) Thoughts and speculations on the ancestral arthropod segmentation pathway. In: Minelli A, Fusco G, editors. Evolving Pathways: Key Themes in Evolutionary Developmental Biology. : Cambridge University Press. pp. 343–358.
20. MacdonaldPM, StruhlG (1986) A molecular gradient in early Drosophila embryos and its role in specifying the body pattern. Nature 324 (6097) 537–545.
21. EdgarLG, CarrS, WangH, WoodWB (2001) Zygotic expression of the caudal homolog pal-1 is required for posterior patterning in Caenorhabditis elegans embryogenesis. Dev Biol 229 (1) 71–88.
22. EpsteinM, PillemerG, YelinR, YisraeliJK, FainsodA (1997) Patterning of the embryo along the anterior-posterior axis: The role of the caudal genes. Development 124 (19) 3805–3814.
23. OlesnickyEC, BrentAE, TonnesL, WalkerM, PultzMA, et al. (2006) A caudal mRNA gradient controls posterior development in the wasp Nasonia. Development 133 (20) 3973–3982.
24. CopfT, SchroderR, AverofM (2004) Ancestral role of caudal genes in axis elongation and segmentation. Proc Natl Acad Sci U S A 101 (51) 17711–17715.
25. ShinmyoY, MitoT, MatsushitaT, SarashinaI, MiyawakiK, et al. (2005) caudal is required for gnathal and thoracic patterning and for posterior elongation in the intermediate-germband cricket Gryllus bimaculatus. Mech Dev 122 (2) 231–239.
26. Murray JD (2002) Mathematical biology: An introduction. : Springer, pp. 418–422.
27. PilonN, OhK, SylvestreJR, SavoryJG, LohnesD (2007) Wnt signaling is a key mediator of Cdx1 expression in vivo. Development 134 (12) 2315–2323.
28. FuJ, PosnienN, BolognesiR, FischerTD, RaylP, et al. (2012) Asymmetrically expressed axin required for anterior development in Tribolium. Proc Natl Acad Sci U S A 109 (20) 7782–7786.
29. McGregorAP, PechmannM, SchwagerEE, FeitosaNM, KruckS, et al. (2008) wnt8 is required for growth-zone establishment and development of opisthosomal segments in a spider. Curr Biol 18 (20) 1619–1623.
30. LoganCY, NusseR (2004) The Wnt signaling pathway in development and disease. Annu Rev Cell Dev Biol 20 : 781–810.
31. BolognesiR, BeermannA, FarzanaL, WittkoppN, LutzR, et al. (2008) Tribolium wnts: Evidence for a larger repertoire in insects with overlapping expression patterns that suggest multiple redundant functions in embryogenesis. Dev Genes Evol 218 (3–4) 193–202.
32. BucherG, FarzanaL, BrownSJ, KlinglerM (2005) Anterior localization of maternal mRNAs in a short germ insect lacking bicoid. Evol Dev 7 (2) 142–149.
33. CavalloRA, CoxRT, MolineMM, RooseJ, PolevoyGA, et al. (1998) Drosophila TCF and Groucho interact to repress Wingless signaling activity. Nature 395 (6702) 604–608.
34. StauberM, JackleH, Schmidt-OttU (1999) The anterior determinant bicoid of Drosophila is a derived Hox class 3 gene. Proc Natl Acad Sci U S A 96 (7) 3786–3789.
35. FalcianiF, HausdorfB, SchroderR, AkamM, TautzD, et al. (1996) Class 3 Hox genes in insects and the origin of zen. Proc Natl Acad Sci U S A 93 (16) 8479–8484.
36. van der ZeeM, BernsN, RothS (2005) Distinct functions of the Tribolium zerknullt genes in serosa specification and dorsal closure. Curr Biol 15 (7) 624–636.
37. MlodzikM, GehringWJ (1987) Expression of the caudal gene in the germ line of Drosophila: Formation of an RNA and protein gradient during early embryogenesis. Cell 48 (3) 465–478.
38. DubnauJ, StruhlG (1996) RNA recognition and translational regulation by a homeodomain protein. Nature 379 (6567) 694–699.
39. SchulzC, TautzD (1995) Zygotic caudal regulation by hunchback and its role in abdominal segment formation of the Drosophila embryo. Development 121 (4) 1023–1028.
40. HaderT, La RoseeA, ZieboldU, BuschM, TaubertH, et al. (1998) Activation of posterior pair-rule stripe expression in response to maternal caudal and zygotic knirps activities. Mech Dev 71 (1–2) 177–186.
41. DearolfCR, TopolJ, ParkerCS (1989) The caudal gene product is a direct activator of fushi tarazu transcription during Drosophila embryogenesis. Nature 341 (6240) 340–343.
42. Rivera-PomarR, LuX, PerrimonN, TaubertH, JackleH (1995) Activation of posterior gap gene expression in the Drosophila blastoderm. Nature 376 (6537) 253–256.
43. MlodzikM, GibsonG, GehringWJ (1990) Effects of ectopic expression of caudal during Drosophila development. Development 109 (2) 271–277.
44. SavoryJG, MansfieldM, RijliFM, LohnesD (2011) Cdx mediates neural tube closure through transcriptional regulation of the planar cell polarity gene Ptk7. Development 138 (7) 1361–1370.
45. GraingerS, LamJ, SavoryJG, MearsAJ, RijliFM, et al. (2012) Cdx regulates Dll1 in multiple lineages. Dev Biol 361 (1) 1–11.
46. SavoryJG, BouchardN, PierreV, RijliFM, De RepentignyY, et al. (2009) Cdx2 regulation of posterior development through non-Hox targets. Development 136 (24) 4099–4110.
47. DeschampsJ, van NesJ (2005) Developmental regulation of the Hox genes during axial morphogenesis in the mouse. Development 132 (13) 2931–2942.
48. GauntSJ, CockleyA, DrageD (2004) Additional enhancer copies, with intact cdx binding sites, anteriorize Hoxa-7/lacZ expression in mouse embryos: Evidence in keeping with an instructional cdx gradient. Int J Dev Biol 48 (7) 613–622.
49. SchyrRB, ShabtaiY, ShashikantCS, FainsodA (2012) Cdx1 is essential for the initiation of HoxC8 expression during early embryogenesis. FASEB J 26 (6) 2674–2684.
50. AulehlaA, WiegraebeW, BaubetV, WahlMB, DengC, et al. (2008) A beta-catenin gradient links the clock and wavefront systems in mouse embryo segmentation. Nat Cell Biol 10 (2) 186–193.
51. AulehlaA, WehrleC, Brand-SaberiB, KemlerR, GosslerA, et al. (2003) Wnt3a plays a major role in the segmentation clock controlling somitogenesis. Dev Cell 4 (3) 395–406.
52. GibbS, ZagorskaA, MeltonK, TeninG, VaccaI, et al. (2009) Interfering with wnt signaling alters the periodicity of the segmentation clock. Dev Biol 330 (1) 21–31.
53. NaicheLA, HolderN, LewandoskiM (2011) FGF4 and FGF8 comprise the wavefront activity that controls somitogenesis. Proc Natl Acad Sci U S A 108 (10) 4018–4023.
54. SawadaA, ShinyaM, JiangYJ, KawakamiA, KuroiwaA, et al. (2001) Fgf/MAPK signaling is a crucial positional cue in somite boundary formation. Development 128 (23) 4873–4880.
55. CinquinO (2007) Repressor dimerization in the zebrafish somitogenesis clock. PLoS Comput Biol 3 (2) e32.
56. KawamuraA, KoshidaS, HijikataH, SakaguchiT, KondohH, et al. (2005) Zebrafish Hairy/Enhancer of split protein links FGF signaling to cyclic gene expression in the periodic segmentation of somites. Genes Dev 19 (10) 1156–1161.
57. SchroterC, AresS, MorelliLG, IsakovaA, HensK, et al. (2012) Topology and dynamics of the zebrafish segmentation clock core circuit. PLoS Biol 10 (7) e1001364.
58. BeckMT, VaradiZB (1972) One, two and three-dimensional spatially periodic chemical reactions. Nature Physical Science 235 : 15–16.
59. ThoenesD (1973) Spatial oscillations in the Zhabotinskii reaction. Nature Physical Science 243 : 18–20.
60. LauschkeVM, TsiairisCD, FrancoisP, AulehlaA (2013) Scaling of embryonic patterning based on phase-gradient encoding. Nature 493 (7430) 101–105.
61. Ten TusscherKH (2013) Mechanisms and constraints shaping the evolution of body plan segmentation. Eur Phys J E Soft Matter 36 (5) 54-13054-7
62. MeinhardtH (2008) Models of biological pattern formation: From elementary steps to the organization of embryonic axes. Curr Top Dev Biol 81 : 1–63.
Štítky
Genetika Reprodukční medicínaČlánek vyšel v časopise
PLOS Genetics
2014 Číslo 10
Nejčtenější v tomto čísle
- The Master Activator of IncA/C Conjugative Plasmids Stimulates Genomic Islands and Multidrug Resistance Dissemination
- A Splice Mutation in the Gene Causes High Glycogen Content and Low Meat Quality in Pig Skeletal Muscle
- Keratin 76 Is Required for Tight Junction Function and Maintenance of the Skin Barrier
- A Role for Taiman in Insect Metamorphosis