
Fat-Dachsous Signaling Coordinates Cartilage Differentiation and Polarity during Craniofacial Development
Little is known about the mechanisms of cell-cell communication necessary to assemble skeletal elements of appropriate size and shape. In this study, we investigate the roles of genetic factors belonging to a developmental pathway that affects skeletal progenitor behavior: the atypical cadherins Fat3 and Dachsous2 (Dchs2), and REREa/Atr2a. We show that cartilage precursors fail to rearrange into linear stacks and at the same time misregulate expression of sox9a, a key regulator of cartilage differentiation, in zebrafish embryos deficient in Fat3 or its partner Dchs2. Similar cartilage defects are observed in rerea−/ − mutants, and Fat3 interacts physically and genetically with REREa. Our results suggest that Fat3, Dchs2 and REREa interact to control polarized cell-cell intercalation and simultaneously control skeletal differentiation through Sox9. By transplanting cartilage precursors between wild-type and Fat3, Dchs2 or REREa deficient embryos we demonstrate that all three factors exert long-range influences on neighboring cells, most likely mediated by another polarizing signal. We propose a model in which this coordinates the polarity and differentiation of chondrocytes to shape skeletal primordia, and that defects in these processes underlie human skeletal malformations.
Published in the journal:
. PLoS Genet 10(10): e32767. doi:10.1371/journal.pgen.1004726
Category:
Research Article
doi:
https://doi.org/10.1371/journal.pgen.1004726
Summary
Little is known about the mechanisms of cell-cell communication necessary to assemble skeletal elements of appropriate size and shape. In this study, we investigate the roles of genetic factors belonging to a developmental pathway that affects skeletal progenitor behavior: the atypical cadherins Fat3 and Dachsous2 (Dchs2), and REREa/Atr2a. We show that cartilage precursors fail to rearrange into linear stacks and at the same time misregulate expression of sox9a, a key regulator of cartilage differentiation, in zebrafish embryos deficient in Fat3 or its partner Dchs2. Similar cartilage defects are observed in rerea−/ − mutants, and Fat3 interacts physically and genetically with REREa. Our results suggest that Fat3, Dchs2 and REREa interact to control polarized cell-cell intercalation and simultaneously control skeletal differentiation through Sox9. By transplanting cartilage precursors between wild-type and Fat3, Dchs2 or REREa deficient embryos we demonstrate that all three factors exert long-range influences on neighboring cells, most likely mediated by another polarizing signal. We propose a model in which this coordinates the polarity and differentiation of chondrocytes to shape skeletal primordia, and that defects in these processes underlie human skeletal malformations.
Introduction
What are the mechanisms of cell-cell communication that mediate organ morphogenesis? Bones, for example, have many different sizes and shapes yet the individual and collective cell behaviors necessary to assemble these shapes remain largely unknown. During development, cartilage serves as the blueprint for much of the adult skeleton. Cartilage models of long bones, including the digits, are aligned into columns of discoid cells that resemble stacks of coins [1]. This basic arrangement is also found in other endochondral bones, including in the craniofacial skeleton where studies in zebrafish suggest that these stacks form by oriented cell intercalations [2]. Notably, cartilage differentiation and morphogenesis are initiated by sox9, but the morphogenetic pathway(s) activated by this transcription factor remain unknown [3], [4].
Cell-cell intercalations such as those that occur in cartilage are often regulated by planar cell polarity (PCP) pathways [5]. First described in Drosophila epithelia, PCP refers to coordinated polarity within a cell sheet [6]. More recently, vertebrates have been shown to utilize PCP factors not only in polarizing epithelia but also in orienting cell divisions and movements, such as the cell intercalations driving tissue convergence and extension during gastrulation, neurulation and kidney formation [5], [7]–[11]. Hallmarks of PCP in epithelia are the locations of polarized hairs or cilia protruding from cells. Similarly, primary cilia and their associated basal bodies/microtubule organizing centers (MTOCs) orient towards the leading edges of intercalating cells [12], and distally in chondrocytes in the digits of mouse limbs [13]. These coordinated polarity dynamics observed in migrating cells and chondrocytes suggest that PCP may also be part of the mechanism that controls skeletal morphogenesis.
Two main pathways regulate PCP independently in Drosophila: the Frizzled (Fz) pathway and the Fat/Dachsous (Dchs) pathway [14]. Both pathways are conserved in vertebrates and variously required for polarity of diverse tissues, including cochlear hair cells and hair follicles [5], [15]. In mice, components of the Fz pathway regulate oriented divisions and intercalations of chondrocytes in the growth plates of long bones [16], and Fat3/4 cooperate during fusion of vertebral arches [17]. However, little is known about requirements for the Fat/Dchs pathway in skeletal morphogenesis.
Four relatives of components of the Drosophila Ft/Ds pathway function in vertebrate PCP: 1) Ft, 2) Ds, 3) Four-jointed (Fj) and 4) Atrophin (Atro) [18]–[21]. In Drosophila, heterophilic binding of the protocadherins Ft and Ds mediates cell-cell adhesion and communication, while the Golgi kinase Fj phosphorylates their cadherin domains to modulate their binding affinity [22]–[24]. Atro also modulates signaling and binds the intracellular domain of Ft [20], but has a dual role as a transcriptional co-repressor that interacts with histone deacetylase (HDAC) [25], [26]. Ft or Ds mutant clones induced within imaginal discs trigger reversals of cell polarity outside the clone in one direction. In addition, Ds and Fj form opposing gradients across fly epithelia and interact with uniformly expressed Ft molecules [23], [27], [28]. This suggests a model in which the linear gradient of Ft/Ds heterodimers polarizes cell fields [29]. However, more recent quantitative analysis of these polarity reversals in the fly eye instead suggests that Ft and Ds interact to modulate a secondary signal that regulates long-range polarity [30]. Whether or not vertebrate Fat/Dchs signaling propagates polarity at a distance, utilizes molecular gradients, or interacts with other polarizing signals remains completely unknown in any tissue or organ.
Here we use the accessibility and miniature organization of the zebrafish jaw skeleton to investigate the genetic mechanisms of cartilage morphogenesis. We show that morphogenesis of polarized chondrocyte stacks results from oriented cell intercalations that depend upon Fat3, Dchs2 and REREa/Atr2a and their regulation of sox9a expression. Chimaeric analyses show that all three are required non-cell autonomously and over several cell-diameters for cartilage stacking and polarity, consistent with activation of a secondary signal that regulates polarized cell-cell intercalation. Fat3 and REREa interact physically and genetically, and our results suggest that Fat3 indirectly induces sox9a by preventing REREa from repressing it, while Dchs2 induces sox9a expression. Sox9a in turn activates fat3 and dchs2 expression. We propose a model in which Fat/Dchs signaling coordinates morphogenesis and differentiation of cartilage by the non-cell autonomous regulation of polarized cell-cell intercalation and sox9a expression.
Results
Cartilage stacking and polarity in the pharyngeal skeleton
To understand the cellular basis of cartilage morphogenesis in the zebrafish pharyngeal skeleton we focused on pharyngeal arch 1 (PA1, mandibular), which in larvae consists of two elements, the ventral, lower – Meckel's cartilage (Mc) - and dorsal, upper – palatoquadrate (pq) - jaw cartilages. We conducted time-lapse analysis of pre-cartilage morphogenesis during the jaw-elongation period in a sox10:lyn-tdTomato transgenic driving membrane-localized red fluorescence in pharyngeal neural crest (NC) cells (Fig. 1A, B; Video S1) [31], [32]. Cell-cell rearrangements drive cartilage morphogenesis between 48-56 hpf. During this period, morphogenesis of the sheet-like pq (Fig. 1A′ B′) and rod-like Mc (Fig. 1A″, B″) was driven by a combination of radial and medio-lateral cell intercalations (Fig. 1C), while little cellular rearrangement occurred at the presumptive joint (arrowheads in Fig. 1A,B). Cell division did not contribute to growth of cartilage during this period but was observed in surrounding tissues (Video S1). EdU labeling confirmed the near absence of proliferation in intercalating prechondrocytes, as previously reported [2](Fig. S1A). Coupling of chondrocyte intercalation and differentiation was revealed in sox10:eGFP transgenics, where increased GFP fluorescence provides a readout of cartilage differentiation (Fig. 1D–F). A stable arrangement of chondrocytes in PA1 was achieved by 66 hpf. Quantification of chondrocyte morphology in pq revealed that in stacks the cell length to width ratio [LWR] is typically 3.6 +/ − 1, with 78% of chondrocytes oriented perpendicular to the long axis of pq (n = 91 cells, 5 embryos) (Fig. 2A, B).


To characterize cell polarity during and after PA1 cartilage morphogenesis, sox10:eGFP transgenics were stained using an anti-gamma tubulin antibody to reveal the positions of microtubule organizing centers (MTOCs) [12], [33]–[35]. This revealed a dynamic pattern of polarity during the cell-cell intercalation period – 48-54 hpf, which stabilized by 66 hpf (Fig. 1D–F). Co-staining of acetylated alpha-tubulin showed that most MTOCs were associated with primary cilia (Fig. S1B). MTOCs in prechondrocytes within pq and Mc were initially oriented towards the center of each condensation (Fig. 1D″-E″). As Mc cell rearrangements stabilized by 66 hpf, three zones of uniform polarity became apparent along its dorsal-ventral (D–V) axis: 1) ventrally oriented near the jaw joint, 2) ventrally oriented near the midline joint with the contralateral Mc, and 3) dorsally oriented throughout the highly stacked region of Mc in between (Fig. 1F, G). In contrast, MTOCs were uniformly ventrally localized in pq at 66 hpf (Fig. 1F, G). Quantification of MTOC orientation in pq revealed 81% of chondrocytes were ventrally polarized (n = 113 cells, 5 embryos, Fig. 2A, B). Additional cryptic polarity reversals were observed throughout the cartilaginous skeleton of arches 2–7 at this stage (Fig. 1G).
To determine if such patterns of cartilage polarity are conserved across vertebrates, we stained MTOCs in Mc in mice. Similar to our data in zebrafish, chondrocytes in vibratome sections of Mc in mouse embryos at stages E12.5 and E13.5 were polarized (81% of MTOCs were ventrally oriented, n = 243, 2 embryos)(Fig. 1H, I and Fig. 2C). Furthermore, a distinct reversal in MTOC orientation was detected near the ventral (distal) end of Mc (Fig. 1H, J). Thus chondrocyte stacking, domains of coordinated polarity and cryptic boundaries between them are conserved in Mc in both fish and mammals.
Fat3, Dchs2 and REREa are required for cartilage stacking and polarity
Cartilage stacking defects were previously reported in PA1 of zebrafish atr2a/rerea−/− mutants [36]. Drosophila Atro interacts with Ft in a common PCP pathway [20]. Therefore, we examined expression of multiple zebrafish Ft-, Ds - and Fj - orthologues – rerea is ubiquitously expressed in the head [36]. We found that fat3, dachsous2 (dchs2) and four-jointed1 (fjx1) are expressed in skeletogenic populations of all pharyngeal arches and the pectoral fin and co-expressed with col2a1, a marker for chondrocyte differentiation, between 48–72 hpf (Fig. 3A–F and Fig. S2A, B). Fat3 expression is also detected at lower levels in cells surrounding skeletogenic areas (Fig. S2C, C′). Both fat3 and dchs2 are expressed in rerea−/− mutants (Fig. S2E, G). In order to visualize Fat3 protein localization, we generated an anti-Fat3 polyclonal antibody using the intracellular domain as epitope. Our antibody revealed that Fat3 localizes to the membranes of chondrogenic and non-chondrogenic pharyngeal NC cells at 54 hpf (Fig. 3G–H′), with stronger signal in non-chondrogenic areas (arrow).

To test for potential roles for Fat/Dchs signaling in cartilage PCP, we investigated prechondrocyte intercalation and polarity in REREa-, Fat3 - or Dchs2-deficient embryos in a sox10:eGFP background between 48–66 hpf. Stacking defects were observed in rerea−/− mutants as early as 60 hpf, suggesting a failure in cell-cell intercalation (Fig. 4A–F). Patterns of intercalating cell polarity, as assayed by MTOC position, in pq were generally similar in rerea−/− mutants to siblings at 48–60 hpf - MTOCs were oriented towards the center of the condensation. However, by 66 hpf, most chondrocytes in rerea−/− mutants failed to orient their MTOCs ventrally (Fig. 4F and Fig. 2D).

To test requirements for Fat3 in cartilage morphogenesis we designed two antisense morpholino oligonucleotides (MO) – fat3-MO1 and fat3-MO2, targeting the translation start site and a splice acceptor site, respectively. These MOs caused severe reductions in Fat3 protein levels, as assayed by whole mount immunostaining of PA1 in injected embryos (Fig. 4I, J), and fat3-MO1 suppressed eGFP expression when co-injected with fat3-5′UTR-eGFP mRNA (Fig. 4K, L). Both MOs caused similar cartilage differentiation defects at 66 hpf, with greater severity in dorsal elements, as revealed by loss of fluorescence in sox10:eGFP transgenics under epifluorescence microscopy (Fig. S3B; Table 1). A mixture of fat3-MO1 (23.1 nM) and fat3-MO2 (69.2 nM) gave consistent phenotypes when coinjected with p53-MO (7.7 nM) to eliminate non-specific apoptosis [37], [38] and was used in all subsequent experiments. To quantify defects in prechondrocyte shape and orientation we focused on pq at 66 hpf under confocal microscopy (Fig. 4G): Fat3-deficient cells were significantly less elongated, lost their perpendicular orientation, and coordinated polarity (Fig. 2D).

Similarly, we designed two MOs against distinct regions of the Dchs2 translation start region, dchs2-MO1 and dchs2-MO2. Knock-down efficiency was demonstrated by coinjection of either MO with dchs2-5′UTR-eGFP mRNA, which suppressed eGFP expression (Fig. 4M–O). Both MOs (92.3 nM) caused differentiation defects of the pharyngeal skeleton at 66 hpf (Fig. S3C; Table 1). Similar to Fat3, Dchs2-deficient cells were less elongated and without coordinated orientation or polarity (Fig. 4H; Fig. 2D).
These results demonstrate that REREa, Fat3 and Dchs2 are required for cartilage stacking and polarity, consistent with a role in PCP. Fat3 and Dchs2 are also required for cartilage differentiation.
Fat3, Dchs2 and REREa promote cartilage intercalation non-cell autonomously
A key aspect of PCP pathways is their role in coordinating the polarity/behavior of cell populations through cell-cell communication. We thus proceeded to test the non-cell autonomous requirements of REREa, Fat3 and Dchs2 in cartilage morphogenesis and differentiation by chimaeric analysis. WT NC cells from sox10:lyn-tdTomato transgenic donors were transplanted into sox10:eGFP hosts deficient in REREa, Fat3 or Dchs2 using the detailed fate map for the zebrafish gastrula (Fig. 5A). Chimaeras were screened for tdTomato+ NC cells at 24 hpf and raised to 66 hpf, when cartilage polarity and differentiation are spatially and temporally stabilized (see Fig. 1). The length-width ratio (LWR) and orientation of the long axes of cells were measured as assays of intercalation, while MTOC position was used to determine cell polarity.

WT transplants rescued intercalation in rerea−/− embryos (Fig. 2E; Fig. 5B–D). In chimaeras, both cartilage stacking and polarity of rerea−/− cells were rescued when compared with contralateral cartilages in the same animals, serving as an internal control. Notably, WT NC cells rescued stacking and polarity of REREa-deficient cartilage even when small numbers of transplanted WT cells contributed to the pq – 3 out of 5 chimaeras, exemplifying the long-range action of REREa in regulating cartilage morphogenesis.
WT NC transplants similarly rescued cartilage intercalation and polarity, but also differentiation, non-cell autonomously in both Fat3 - and Dchs2-deficient embryos (Fig. 2F, G; Fig. 5E-J). WT transplants rescued stacking, polarity and differentiation - even when very small numbers of WT cells contributed to the pq - and long-range rescue was observed in 5 out of 21 Fat3-deficient embryos, and 6 out of 21 Dchs2-deficient embryos.
Regulatory feedback between Fat3, Dchs2, REREa and Sox9a
sox10:eGFP fluorescence is strongly reduced in cartilage precursors of Fat3 - or Dchs2-deficient embryos, indicating a differentiation defect. To examine this in more detail we assayed sox9a and col2a1 expression by ISH. Expression of both genes was reduced or absent during the normal time-course of cranial cartilage differentiation (54–72 hpf) in both Fat3 - and Dchs2-deficient embryos, with the dorsal arches affected at a greater frequency than ventral arches (Fig. 6A–C). In contrast, sox9a expression appeared spatially expanded in rerea−/− mutants, including ectopic expression in the presumptive jaw-joint interzone (Fig. 6D), as previously reported [36]. These results suggest that Fat3 and Dchs2 promote and REREa represses sox9a expression.

Previous studies have reported stacking and differentiation defects in sox9a−/− mutant embryos [4], which we confirmed by injecting a Sox9a-MO mix into sox10:eGFP embryos [4](Fig. S4). Sox9a-deficient embryos showed stacking and polarity defects comparable to Fat3 - or Dchs2 - deficient embryos (Fig. 2D). Analysis of fat3 and dchs2 mRNA by ISH revealed that both were reduced in the presumptive pharyngeal skeleton of Sox9a-, as well as Fat3 - and Dchs2-deficient embryos (Fig. 6E–H, Fig. S5). These results show that Sox9a is required for the expression of fat3 and dchs2, which in turn positively regulate sox9a expression.
REREa interacts with Fat3 in a common pathway upstream of Sox9a
To further investigate the functional relationship between Fat3, Dchs2 and REREa, we assayed sox9a and col2a1 expression in embryos deficient in both REREa and Fat3, or REREa and Dchs2. rerea+/+ and +/− embryos injected with Fat3-MO showed loss or reduction of sox9a/col2a1 expression similar to WT embryos (n = 121)(Fig. 7C, G). In contrast, robust sox9a/col2a1 expression was detected in the presumptive pharyngeal skeleton of all rerea−/− mutants deficient in Fat3 (n = 35) (Fig. 7D, G). This loss-of-function interaction suggests that REREa represses sox9a expression in Fat3-deficient tissues. rerea−/− embryos (n = 27) injected with Dchs2-MO showed reduced sox9a/col2a1 expression, similar to Dchs2-MO injected siblings (n = 47)(Fig. 7E–G).

Drosophila Atro binds Fat [20], as does Atr1 to Fat1 in mouse vascular smooth muscle cell primary cultures [39]. To test if zebrafish REREa/Atr2a binds Fat3 we performed in vitro binding assays with 2 non-overlapping fragments of the full-length Fat3 intracellular domain, together with a subset of the Atro domain of REREa containing the highly conserved Atr-box required for strong Fat-binding [39] (Fig. 8). We found that the N-terminal fragment of the Fat3 intracellular domain bound the Atro domain of REREa (Fig. 8). Our results are consistent with direct interactions between Fat3 and REREa upstream of sox9a expression. Taken together, these results suggest that Fat3 and REREa interact directly in a common pathway regulating sox9a expression. Further, the repressor activity of REREa on sox9a transcription appears to be inhibited by Fat3.

Discussion
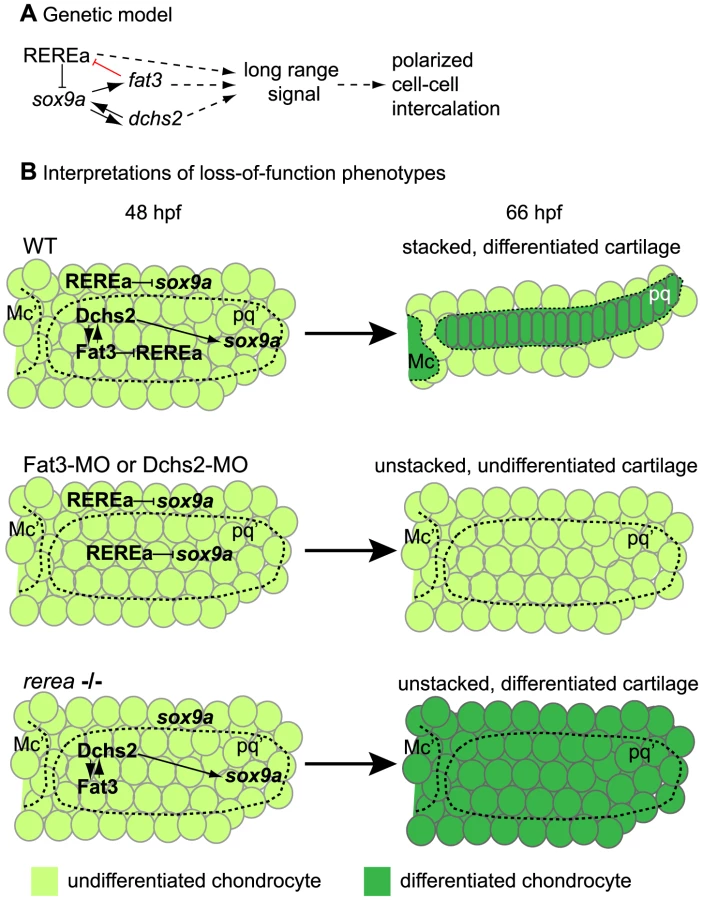
In this study, we show that zebrafish pharyngeal cartilages – which form the blueprint for much of the adult craniofacial skeleton - are composed of polarized arrays of stacked chondrocytes. This neat organization is achieved through cell-cell intercalation and requires Fat3, Dchs2 and REREa (Fig. 9, Table 2). Our chimaeric analyses show that all three factors are required to promote polarized intercalation of prechondrocytes non-cell autonomously and over several cell diameters. While Fat3-Dchs2 bridges may rescue cells in contact with WT transplants in Fat3 - or Dchs2-deficient embryos, the long-range rescue we observe likely reflects the activation of an unknown secondary signal that regulates long-range polarity. Furthermore, in our model Fat signaling plays more of a permissive role in cartilage morphogenesis and polarity, since we do not detect intercalation and/or polarity perturbations across boundaries between WT transplants and Fat3-, Dchs2 - or REREa-deficient cells. Our results also provide a novel transcriptional link between Fat3/Dchs2/REREa and Sox9 in cartilage morphogenesis: REREa represses sox9a transcription (either directly or indirectly), which is antagonized by its interaction with Fat3, while Dchs2 activates sox9a expression. Sox9a is in turn required for fat3/dchs2 expression.

Whether or not vertebrate Fat/Dchs signaling controls a PCP mechanism analogous to fly epithelia continues to be debated, and whether or not it can do so in a mesenchymal tissue like the skeleton, remains unclear. However, fat3, dchs2 and fjx1 are all expressed in craniofacial skeletal precursors and both Fat3 and Dchs2 deficient cartilages lose coordinated polarity and fail to intercalate (similar to rerea−/− mutants), consistent with a PCP-based model. Further, Fat3, Dchs2 and REREa regulate polarized cell-cell intercalation at long-range, likely through the modulation of a secondary signal, as recently demonstrated for Drosophila Ft/Ds signaling [30]. Lastly, defects in oriented precartilage cell intercalations resemble defects in convergence and extension movements during gastrulation [8], [40], [41], which are considered a hallmark of impaired vertebrate PCP [5].
Sox9 is a well-known regulator of cartilage differentiation, but its roles in morphogenesis remain unclear. Human Sox9 heterozygous mutations cause Campomelic Dysplasia (CD), a condition characterized by several skeletal dysmorphologies including cleft palate and hypoplasia/bending of many endochondral bones [42]. While differentiation defects in CD can be explained by disruption of Col2a1 expression, a direct transcriptional target of Sox9 [43], dysmorphologies of precartilage condensations of Sox9 mutant humans, mice and zebrafish remain unexplained [4], [42]. Our results demonstrate that Sox9a is part of a regulatory loop consisting of Fat3, Dchs2, and the transcriptional co-repressor REREa, which we propose coordinates differentiation and morphogenesis. In our model, Sox9a regulates fat3 and dchs2 levels, which in turn control polarized cell-cell intercalations and also feedback through REREa to allow differentiation. This model is consistent with all of our chimaeric results and points to a novel role for Sox9a in cartilage polarity and stacking.
Our analysis of the intracellular localization of MTOC's/ciliary basal bodies reveals unexpected domains of cartilage polarity throughout the pharyngeal skeleton, both in fish and mice. It also provides a read-out of cell polarity – MTOCs organize the microtubule cytoskeleton, Golgi complex, and primary cilium [5] – that is governed by PCP signaling in gastrulating cells [9], [12] as well as cartilage cells of the digits in mouse limbs [13]. We find that MTOCs orient towards the core of skeletal condensations during cell intercalation, similar to MTOCs in cultured cells [44], and cells converging during gastrulation [12]. In later stages, MTOCs in cartilage relocate to either the dorsal or the ventral side of each stacked chondrocyte in both zebrafish and mice. Notably, distinct zones of ventrally - or dorsally-oriented MTOCs are juxtaposed within individual cartilage elements, and these zones do not correlate with any obvious anatomical boundaries such as joints. Do these switches in MTOC orientation reflect local sources of signaling molecules? Are they instructive for setting up domains of proliferation, local tissue interactions, or muscle-skeleton attachments?
Fat3 is a vertebrate orthologue of Drosophila fat2/fat-like [45], which regulates PCP of actin fibers within the ovarian follicle epithelium, without demonstrated links to Ds or Atro [46]. In contrast, Drosophila ft – the orthologue of vertebrate fat4, regulates PCP in the eye, abdominal cuticle and wing discs, together with Ds, Fj, and Atro [18], [20], [27], [47]. We provide new genetic evidence for a requirement for Fat3, Dchs2 and REREa in a common pathway regulating morphogenesis and differentiation of vertebrate pharyngeal cartilage. A physical interaction between RERE/Atr2 and Fat1 was previously reported in murine smooth muscle cells [39], suggesting that the direct interaction between Fat and Atro orthologues may be generally conserved. Our study also suggests that some form of signal transduction occurs downstream of both Fat3 and Dchs2, with Fat3 modulating REREa activity and Dchs2 activating sox9a transcription. While a prevalent model proposes that Fat-Ds-mediated cell-cell communication is unidirectional, with Ds acting as ligand and Fat as receptor [29], our finding parallels that of recent studies suggesting signal transduction downstream of Ds in Drosophila [48]–[50].
The roles we have found for the Fat/Dchs pathway in cartilage cell intercalation and morphogenesis resemble those of the Fz-PCP pathway that have been described in various vertebrate contexts [5], [7]–[11], including the zebrafish pharyngeal skeleton [51], [52]. However, studies in Drosophila suggest that Fat-PCP and Fz-PCP pathways regulate tissue polarity independently [14]. What seems to set the Fat/Dchs pathway apart in cartilage, based on our findings, is its role in coordinating morphogenesis and differentiation through Sox9. Similarly, in the fly eye, Ft and Atro coordinate R3/R4 photoreceptor fate determination with polarity, suggesting a conserved role for this pathway in coupling polarity and differentiation [18], [20], [53]–[55]. These processes must be coordinated during the development of all tissues and organs, yet are rarely studied together and the underlying mechanisms remain unclear. Future studies are needed to clarify whether or not Fat signaling plays similar roles in other tissues (e.g. cranial neural tube, renal tubules, etc.) where it has been implicated [11], [17].
Materials and Methods
Ethics statement
All animals were handled in strict accordance with good animal practice as defined by the relevant national and/or local animal welfare bodies, and all animal work was approved by the University of California, Irvine Institutional Animal Care and Use Committee.
Animals
Adult zebrafish of the *AB strain, carrying alleles of rerea/atr2atb210 (bab) [36], the transgenic reporter line sox10:eGFP [56], [57] or sox10:lyn-tdTomato [32] were maintained and staged as described [31], [58]. CD-1 and Rosa26flox-mTRed-Stop-flox-mGFP mice were maintained as described [59]. Embryonic day 12.5 and 13.5 (E12.5 and E13.5) timed matings were setup by crossing CD1 females (Charles River) with Rosa26flox-mTRed-Stop-flox-mGFPmales [60].
Tissue labeling procedures
Whole-mount in situ hybridization was carried out as previously described (Thisse et al., 1993). fat3, dchs2 and fjx1 amplicons were amplified from 54 hpf cDNA using the following primers: Fat3f: CTTCATCGCCTTCAGGAAGA, Fat3r: GGCGGGTAGTCAC TGTCAAT, Dchs2f: CCGAGGAAGAGACAGCAGAGG, Dchs2r: CGTATTCCTGGCTGGGCA AC, Fjx1f: GAGCAGCGGGTGTTCTGGAG, Fjx1r: CATCAATCCTGCTCTGCAATGTG. Each amplicon was subcloned into pCR4-TOPO (Invitrogen) following manufacturer's instructions, transformed into BL21 competent cells and sequenced. Published probes include col2a1 [61] and sox9a [62].
Immunohistochemistry was performed with rabbit anti-gamma-Tubulin (1/100 Genetex GTX113286), mouse anti alpha-acetylated Tubulin (1/100 Sigma T6557) and Alexa Fluor 568 Phalloidin (1/50 Life technologies A12380). Fixed mouse heads were embedded in 5% agarose and 100 µm sections were cut on a vibratome.
Visualization of mouse embryonic cartilages was achieved by performing alcian blue staining as previously described [63]
Microinjection of morpholino antisense oligonucleotides
Morpholino antisense oligos (MO) were designed to block translation or splicing (Gene Tools, Inc.) including: fat3-MO1, 5′-CCTTCACCTGTGCAAACAGAGAACA-3′; fat3-MO2, 5′-TGCCCTCTTGCTCAGTTCGGCTCAT-3′; dchs2-MO1, 5′-CATGTTCATGC-GAAAACATTAGCAG; dchs2-MO2, 5′-AGAAAGTCCGTGTGTAAAACTCCAT-3′; Sox9a i1d, 5′-AATGAATTACTCACCTCCAAAGTTT-3′ [62]; Sox9a i2d, 5′-CGAGTCAAGTTT-AGTGTCCCACCTG-3′ [62]. MOs were prepared at 1 mM in dH2O and stored at room temperature. To construct fat3-5′UTR-eGFP and dchs2-5′-UTR-eGFP reporter genes, cDNA amplicons containing target sites of MOs were subcloned in frame into the pCS2-eGFP vector. MO - and mRNA injection volumes were approximately 500 pL. A 4 hr developmental delay was usually observed with MO-injected - and rerea−/− embryos, which was corrected for throughout the study.
Imaging
Embryos labeled by in situ hybridization were photographed on a Zeiss Axioplan 2 microscope, equipped with a MicroPublisher 5.0 RTV camera using Volocity software (Improvision). Fluorescent immunostained embryos were photographed on a Zeiss LSM780 confocal microscope using a 63x/1.15 W C-APO objective. For time-lapse imaging, embryos were imaged on a Nikon Eclipse Ti spinning disk microscope equipped with a 40x/1.15 WI Apo LWD objective. Approximately 100 um z-stacks were captured at 0.5 um intervals every 5 minutes for 8 hours. ImageJ/Fiji was used for image processing. Cell contours were hand-drawn in ImageJ and measured for length-width ratio (LWR) and orientation. Each cell was divided into 4 quadrants to determine MTOC position. Cell orientation and MTOC position were plotted as rosette diagrams and Watson's U2 tests for significance were conducted using Vector Rose (PAZ software). In Fat3-MO or Dchs2-MO embryos, LWR and orientation were recorded within a 3-to-4 cell-thick presumptive palatoquadrate (pq) region bordered posteriorly by the mandibular aorta, dorsally by the adductor mandibularis muscle (amm) and anteriorly by the presumptive jaw joint – at amm mid-length.
Chimaeric analyses
WT, sox10:lyn-tdTomato donor embryos were injected with 3% rhodamine-dextran at the 1-2-cell stage and cells were transplanted into sox10:eGFP hosts at the shield stage (6 hpf). Host embryos with red fluorescent cells in the pharyngeal arches were sorted at 24 hpf and reared up to 66 hpf for immunochemistry. rerea−/− mutant hosts were identified by lack of pectoral fins and eye coloboma at 66 hpf.
Biochemical analysis
For the GST pull-down assay, 2 fat3 fragments were PCR-amplified and cloned in frame with the N-terminal Myc tag provided in the pCS2-MT vector. Myc-Fat3 N (aa 4184-4366) and C (aa 4357–4500) were then synthesized by in vitro translation using TNT Quick (Promega). GST-REREa (aa 1007–1227) was produced by PCR-amplification and cloned in frame into pGEX-4T-1 (Amersham) GST. GST-REREa protein was produced in BL21 cells, extracted in PBS with protease inhibitor cocktail (Sigma) and purified using glutathione-coupled beads (GE healthcare).
For binding assays, equal amounts of Myc-Fat3 were added to 100 µL of pre-equilibrated beads containing GST-fusions in HMK buffer [64] and rotated at room temperature for 3 hours. Beads were recovered, washed in HMK and analyzed by SDS-PAGE gels followed by western blotting with ECL chemoluminescence (Amersham). The following primary antibodies were used: mouse anti-Myc (a gift from J. Sosnik, 1∶5000), rabbit anti GST (GeneScript 1∶10,000).
Supporting Information
Zdroje
1. DoddsGS (1930) Row formation and other types of arrangement of cartilage cells in endochondral ossification. Anatomical Record 46 : 385–399.
2. KimmelCB, MillerCT, KruzeG, UllmannB, BreMillerRA, et al. (1998) The shaping of pharyngeal cartilages during early development of the zebrafish. Developmental Biology 203 : 245–263.
3. BiWM, DengJM, ZhangZP, BehringerRR, de CrombruggheB (1999) Sox9 is required for cartilage formation. Nature Genetics 22 : 85–89.
4. YanYL, WilloughbyJ, LiuD, CrumpJG, WilsonC, et al. (2005) A pair of Sox: distinct and overlapping functions of zebrafish sox9 co-orthologs in craniofacial and pectoral fin development. Development 132 : 1069–1083.
5. GrayRS, RoszkoI, Solnica-KrezelL (2011) Planar Cell Polarity: Coordinating Morphogenetic Cell Behaviors with Embryonic Polarity. Developmental Cell 21 : 120–133.
6. AdlerPN (2002) Planar signaling and morphogenesis in Drosophila. Developmental Cell 2 : 525–535.
7. HeisenbergCP, TadaM, RauchGJ, SaudeL, ConchaML, et al. (2000) Silberblick/Wnt11 mediates convergent extension movements during zebrafish gastrulation. Nature 405 : 76–81.
8. KellerR, DavidsonL, EdlundA, ElulT, EzinM, et al. (2000) Mechanisms of convergence and extension by cell intercalation. Philosophical Transactions of the Royal Society B-Biological Sciences 355 : 897–922.
9. WallingfordJB, RowningBA, VogeliKM, RothbacherU, FraserSE, et al. (2000) Dishevelled controls cell polarity during Xenopus gastrulation. Nature 405 : 81–85.
10. CirunaB, JennyA, LeeD, MlodzikM, SchierAF (2006) Planar cell polarity signalling couples cell division and morphogenesis during neurulation. Nature 439 : 220–224.
11. SaburiS, HesterI, FischerE, PontoglioM, EreminaV, et al. (2008) Loss of Fat4 disrupts PCP signaling and oriented cell division and leads to cystic kidney disease. Nature Genetics 40 : 1010–1015.
12. SepichDS, UsmaniM, PawlickiS, Solnica-KrezelL (2011) Wnt/PCP signaling controls intracellular position of MTOCs during gastrulation convergence and extension movements. Development 138 : 543–552.
13. GaoB, SongH, BishopK, ElliotG, GarrettL, et al. (2011) Wnt Signaling Gradients Establish Planar Cell Polarity by Inducing Vangl2 Phosphorylation through Ror2. Developmental Cell 20 : 163–176.
14. LawrencePA, StruhlG, CasalJ (2007) Planar cell polarity: one or two pathways? Nature Reviews Genetics 8 : 555–563.
15. DevenportD, FuchsE (2008) Planar polarization in embryonic epidermis orchestrates global asymmetric morphogenesis of hair follicles. Nature Cell Biology 10 : 1257–U1212.
16. LiYW, DudleyAT (2009) Noncanonical frizzled signaling regulates cell polarity of growth plate chondrocytes. Development 136 : 1083–1092.
17. SaburiS, HesterI, GoodrichL, McNeillH (2012) Functional interactions between Fat family cadherins in tissue morphogenesis and planar polarity. Development 139 : 1806–1820.
18. YangCH, AxelrodJD, SimonMA (2002) Regulation of Frizzled by fat-like cadherins during planar polarity signaling in the Drosophila compound eye. Cell 108 : 675–688.
19. AdlerPN, CharltonJ, LiuJC (1998) Mutations in the cadherin superfamily member gene dachsous cause a tissue polarity phenotype by altering frizzled signaling. Development 125 : 959–968.
20. FantoM, ClaytonL, MeredithJ, HardimanK, CharrouxB, et al. (2003) The tumor-suppressor and cell adhesion molecule Fat controls planar polarity via physical interactions with Atrophin, a transcriptional co-repressor. Development 130 : 763–774.
21. ZeidlerMP, PerrimonN, StruttDI (1999) The four-jointed gene is required in the Drosophila eye for ommatidial polarity specification. Current Biology 9 : 1363–1372.
22. BrittleAL, RepisoA, CasalJ, LawrencePA, StruttD (2010) Four-Jointed Modulates Growth and Planar Polarity by Reducing the Affinity of Dachsous for Fat. Current Biology 20 : 803–810.
23. MatakatsuH, BlairSS (2004) Interactions between Fat and Dachsous and the regulation of planar cell polarity in the Drosophila wing. Development 131 : 3785–3794.
24. SimonMA, XuAG, IshikawaHO, IrvineKD (2010) Modulation of Fat:Dachsous Binding by the Cadherin Domain Kinase Four-Jointed. Current Biology 20 : 811–817.
25. ZoltewiczJS, StewartNJ, LeungR, PetersonAS (2004) Atrophin 2 recruits histone deacetylase and is required for the function of multiple signaling centers during mouse embryogenesis. Development 131 : 3–14.
26. WangL, RajanH, PitmanJL, McKeownM, TsaiCC (2006) Histone deacetylase-associating Atrophin proteins are nuclear receptor corepressors. Genes & Development 20 : 525–530.
27. CasalJ, StruhlG, LawrencePA (2002) Developmental compartments and planar polarity in Drosophila. Current Biology 12 : 1189–1198.
28. SimonMA (2004) Planar cell polarity in the Drosophila eye is directed by graded four-jointed and Dachsous expression. Development 131 : 6175–6184.
29. LawrencePA, StruhlG, CasalJ (2008) Do the protocadherins Fat and Dachsous link up to determine both planar cell polarity and the dimensions of organs? Nature Cell Biology 10 : 1379–1382.
30. SharmaP, McNeillH (2013) Regulation of long-range planar cell polarity by Fat-Dachsous signaling. Development 140 : 3869–3881.
31. SchillingTF, KimmelCB (1997) Musculoskeletal patterning in the pharyngeal segments of the zebrafish embryo. Development 124 : 2945–2960.
32. SchillingTF, Le PabicP, HoffmanTL (2010) Using transgenic zebrafish (Danio rerio) to study development of the craniofacial skeleton. Journal of Applied Ichthyology 26 : 183–186.
33. JonesC, RoperVC, FoucherI, QianD, BanizsB, et al. (2008) Ciliary proteins link basal body polarization to planar cell polarity regulation. Nature Genetics 40 : 69–77.
34. ParkTJ, MitchellBJ, AbituaPB, KintnerC, WallingfordJB (2008) Dishevelled controls apical docking and planar polarization of basal bodies in ciliated epithelial cells. Nature Genetics 40 : 871–879.
35. BorovinaA, SuperinaS, VoskasD, CirunaB (2010) Vangl2 directs the posterior tilting and asymmetric localization of motile primary cilia. Nature Cell Biology 12 : 407–U242.
36. PlasterN, SonntagC, SchillingTF, HammerschmidtM (2007) REREa/Atrophin-2 interacts with histone deacetylase and Fgf8 signaling to regulate multiple processes of zebrafish development. Developmental Dynamics 236 : 1891–1904.
37. PlasterN, SonntagC, BusseCE, HammerschmidtM (2006) p53 Deficiency rescues apoptosis and differentiation of multiple cell types in zebrafish flathead mutants deficient for zygotic DNA polymerase delta 1. Cell Death and Differentiation 13 : 223–235.
38. RobuME, LarsonJD, NaseviciusA, BeiraghiS, BrennerC, et al. (2007) p53 activation by knockdown technologies. Plos Genetics 3 : 787–801.
39. HouR, SibingaNES (2009) Atrophin Proteins Interact with the Fat1 Cadherin and Regulate Migration and Orientation in Vascular Smooth Muscle Cells. Journal of Biological Chemistry 284 : 6955–6965.
40. JessenJR, TopczewskiJ, BinghamS, SepichDS, MarlowF, et al. (2002) Zebrafish trilobite identifies new roles for Strabismus in gastrulation and neuronal movements. Nature Cell Biology 4 : 610–615.
41. YinC, KiskowskiM, PouilleP-A, FargeE, Solnica-KrezelL (2008) Cooperation of polarized cell intercalations drives convergence and extension of presomitic mesoderm during zebrafish gastrulation. Journal of Cell Biology 180 : 221–232.
42. BiWM, HuangWD, WhitworthDJ, DengJM, ZhangZP, et al. (2001) Haploinsufficiency of Sox9 results in defective cartilage primordia and premature skeletal mineralization. Proceedings of the National Academy of Sciences of the United States of America 98 : 6698–6703.
43. BellDM, LeungKKH, WheatleySC, NgLJ, ZhouS, et al. (1997) SOX9 directly regulates the type-II collagen gene. Nature Genetics 16 : 174–178.
44. YvonAMC, WalkerJW, DanowskiB, FagerstromC, KhodjakovA, et al. (2002) Centrosome reorientation in wound-edge cells is cell type specific. Molecular Biology of the Cell 13 : 1871–1880.
45. TanoueT, TakeichiM (2005) New insights into Fat cadherins. Journal of Cell Science 118 : 2347–2353.
46. ViktorinovaI, KonigT, SchlichtingK, DahmannC (2009) The cadherin Fat2 is required for planar cell polarity in the Drosophila ovary. Development 136 : 4123–4132.
47. StruttH, StruttD (2002) Nonautonomous planar polarity patterning in Drosophila: Dishevelled-independent functions of frizzled. Developmental Cell 3 : 851–863.
48. MatakatsuH, BlairSS (2012) Separating planar cell polarity and Hippo pathway activities of the protocadherins Fat and Dachsous. Development 139 : 1498–1508.
49. PanGH, FengYQ, AmbegaonkarAA, SunGP, HuffM, et al. (2013) Signal transduction by the Fat cytoplasmic domain. Development 140 : 831–842.
50. DegoutinJL, MiltonCC, YuE, TippingM, BosveldF, et al. (2013) Riquiqui and Minibrain are regulators of the Hippo pathway downstream of Dachsous. Nat Cell Biol 15 : 1176–1185.
51. TopczewskiJ, SepichDS, MyersDC, WalkerC, AmoresA, et al. (2001) The zebrafish glypican knypek controls cell polarity during gastrulation movements of convergent extension. Developmental Cell 1 : 251–264.
52. PiotrowskiT, SchillingTF, BrandM, JiangYJ, HeisenbergCP, et al. (1996) Jaw and branchial arch mutants in zebrafish.2. Anterior arches and cartilage differentiation. Development 123 : 345–356.
53. CooperMTD, BraySJ (1999) Frizzled regulation of Notch signalling polarizes cell fate in the Drosophila eye. Nature 397 : 526–530.
54. FantoM, MlodzikM (1999) Asymmetric Notch activation specifies photoreceptors R3 and R4 and planar polarity in the Drosophila eye. Nature 397 : 523–526.
55. ZhengL, ZhangJJ, CarthewRW (1995) Frizzled regulates mirror-image symmetrical pattern-formation in the Drosophila eye. Development 121 : 3045–3055.
56. WadaN, JavidanY, NelsonS, CarneyTJ, KelshRN, et al. (2005) Hedgehog signaling is required for cranial neural crest morphogenesis and chondrogenesis at the midline in the zebrafish skull. Development 132 : 3977–3988.
57. CarneyTJ, DuttonKA, GreenhillE, Delfino-MachinM, DufourcqP, et al. (2006) A direct role for Sox10 in specification of neural crest-derived sensory neurons. Development 133 : 4619–4630.
58. KimmelCB, BallardWW, KimmelSR, UllmannB, SchillingTF (1995) Stages of embryonic-development of the zebrafish. Developmental Dynamics 203 : 253–310.
59. WuHH, IvkovicS, MurrayRC, JaramilloS, LyonsKM, et al. (2003) Autoregulation of neurogenesis by GDF11. Neuron 37 : 197–207.
60. MuzumdarMD, TasicB, MiyamichiK, LiL, LuoL (2007) A global double-fluorescent Cre reporter mouse. Genesis 45 : 593–605.
61. YanYL, HattaK, RigglemanB, PostlethwaitJH (1995) EXPRESSION OF A TYPE-II COLLAGEN GENE IN THE ZEBRAFISH EMBRYONIC AXIS. Developmental Dynamics 203 : 363–376.
62. YanYL, MillerCT, NissenR, SingerA, LiuD, et al. (2002) A zebrafish sox9 gene required for cartilage morphogenesis. Development 129 : 5065–5079.
63. Nagy A, Gertsenstein M, Vintersten K, Behringer R (2009) Alcian blue staining of the mouse fetal cartilaginous skeleton. Cold Spring Harb Protoc 2009: pdb prot5169.
64. ZhangS, XuL, LeeJ, XuT (2002) Drosophila atrophin homolog functions as a transcriptional corepressor in multiple developmental processes. Cell 108 : 45–56.
Štítky
Genetika Reprodukční medicínaČlánek vyšel v časopise
PLOS Genetics
2014 Číslo 10
Nejčtenější v tomto čísle
- The Master Activator of IncA/C Conjugative Plasmids Stimulates Genomic Islands and Multidrug Resistance Dissemination
- A Splice Mutation in the Gene Causes High Glycogen Content and Low Meat Quality in Pig Skeletal Muscle
- Keratin 76 Is Required for Tight Junction Function and Maintenance of the Skin Barrier
- A Role for Taiman in Insect Metamorphosis